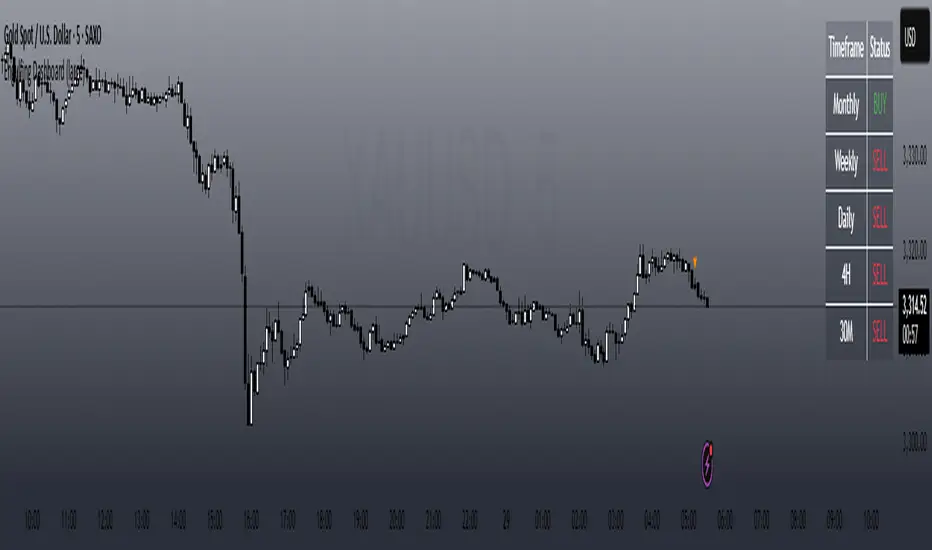
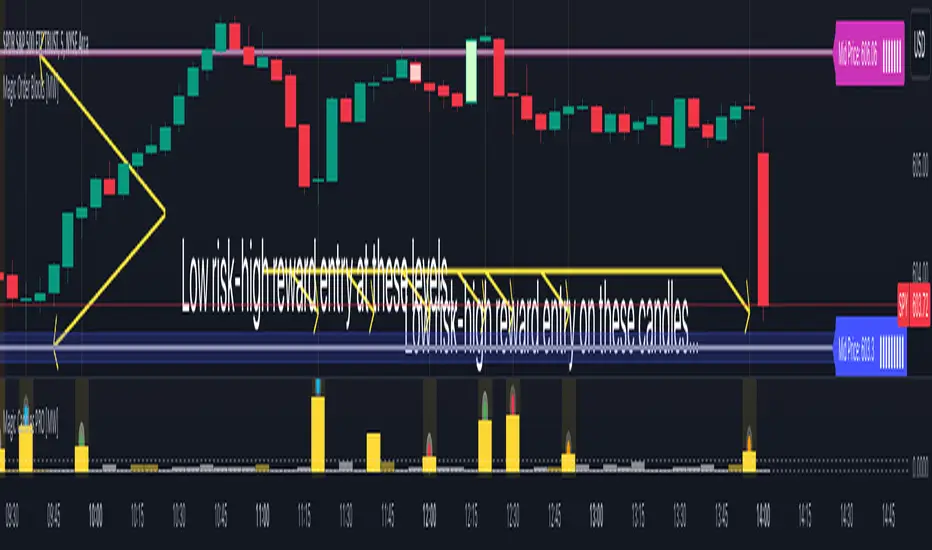
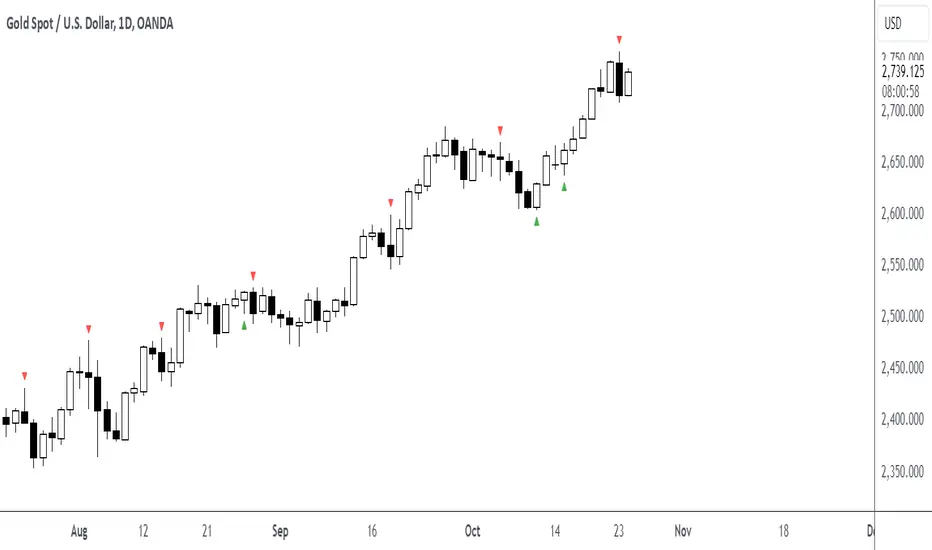
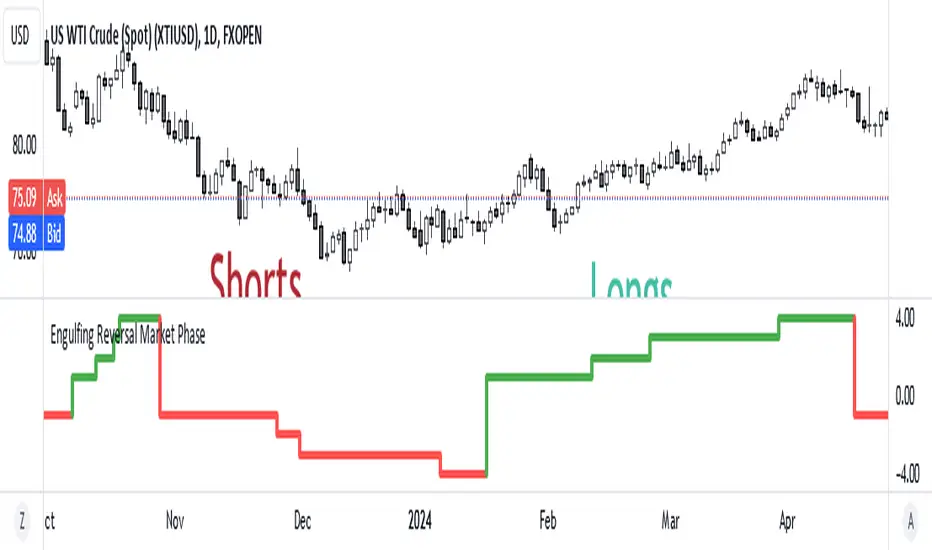
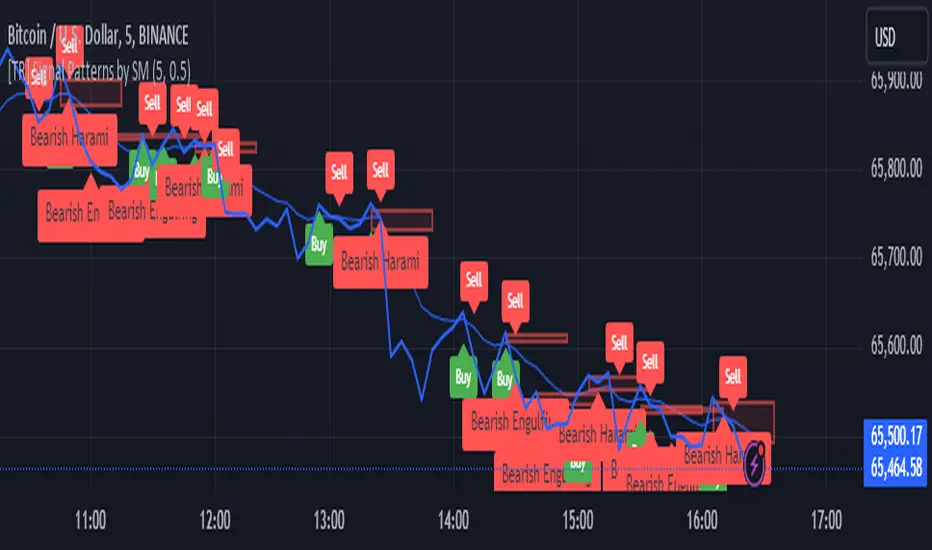
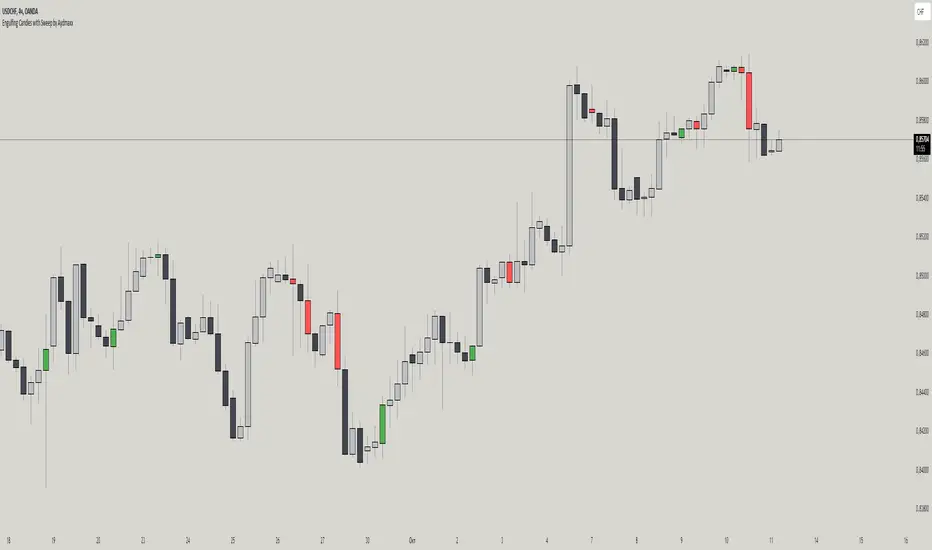
Fetch EngulfingBuysThis script makes use of bullish engulfing candles, trend analysis, and time.
The trend is devided between an up- and downtrend. This is based on a simple cross over strategy, using the 9 and 50 moving averages.
The buys are calculated based on how many times a bullish engulfing candle was displayed on the chart during a downtrend. Bullish engulfing candles in an uptrend will never result in a buy signal.
The sells are simply based on time. This means that the script counts how many days you have been in a trade. The default is 100 candles. You can tweak this in the settings of the indicator.
Finally, this script does not provide you with any stop-losses. I am planning on releasing a v2 once I figured out what a good balance is. Also, you might notice that there are more buys than sells. This is because only the first trade in the series is tracked. V2 could improve on this flaw of the indicator.
Hope you enjoy this first iteration of the indicator.
Engulfing Candle
Pin Bar, Inside Bars and Engulfing Candle SticksIntroducing the Candlestick Pattern Plotter, a comprehensive TradingView indicator designed to elevate your technical analysis by automatically identifying and plotting three essential candlestick patterns – Pin Bars, Engulfing Candles, and Inside Bars. This powerful tool equips traders with a holistic view of market dynamics, enabling them to make informed decisions based on key price action signals.
Pin Bar Identification:
The indicator adeptly recognizes Pin Bars, a pivotal candlestick pattern characterized by a small body and a long wick in the opposite direction of the prevailing trend.
Pin Bars are instrumental in signaling potential trend reversals or continuations, providing crucial insights for strategic decision-making.
Engulfing Candle Detection:
Identify Engulfing Candles effortlessly with this indicator, showcasing instances where the body of one candle fully engulfs the body of the previous candle.
Engulfing Candles serve as powerful reversal indicators, offering valuable insights into shifts in market sentiment and potential trend reversals.
Inside Bar Recognition:
The indicator goes beyond traditional patterns by identifying Inside Bars, where the range of a candle is entirely within the previous candle's high and low.
Inside Bars often signify consolidation or a period of indecision in the market, providing traders with crucial information about potential breakouts or reversals.
Seamlessly integrate the Candlestick Pattern Plotter into your TradingView chart, enjoying a user-friendly interface for swift interpretation of candlestick patterns.
Toggle the display of Pin Bars, Engulfing Candles, and Inside Bars on and off with ease, allowing you to focus on the specific patterns most relevant to your analysis.
Real-Time Alerts:
Stay ahead of the market with real-time alerts that notify you when a Pin Bar, Engulfing Candle, or Inside Bar is identified on the chart.
Timely notifications keep you informed, ensuring you never miss a potential trading opportunity based on these crucial candlestick patterns.
Enhance your trading strategy with the precision of Pin Bars, Engulfing Candles, and Inside Bars, seamlessly integrated into your analysis through the Candlestick Pattern Plotter. Gain a comprehensive understanding of market movements and make well-informed decisions in real-time.
Advanced Engulfing CandlesThere are a plenty of Engulfing candle detecting indicators but every single of them detect engulfing candles engulfed by only single candle but sometime it take more then one candle to engulf the previous opposite candle, which is also considered as engulfing candle.
So this script show both type of candles.
Type of Engulfing Candles
Normal Engulfing Candles
Candle engulfed by more then one continuous candle
I hope you will like it.
If you find any bugs or have any suggestions for any possible addition feel free to comment or DM me.
Trend-based Price Action StrategyThis is a strategy script that combines trend-based price action analysis with the Relative Strength Index (RSI) and Exponential Moving Averages (EMA) as trend filters. Here's a summary of the key components and logic:
Price Action Candlestick Patterns:
Bullish patterns: Engulfing candle and Morning Star.
Bearish patterns: Engulfing candle and Evening Star.
RSI Integration:
RSI is used to identify overbought and oversold conditions.
EMA Trend Filter:
Three EMAs with different periods: Fast , Medium and Slow.
Long trend condition occur when the fast EMA is above the medium and the medium is above the slow EMA.
Short trend condition occur when the slow EMA is above the medium and the medium is above the fast EMA.
Long entry conditions: RSI is oversold, RSI is decreasing, bullish candlestick pattern, and EMA trend filter conditions are met.
Short entry conditions: RSI is overbought, RSI is decreasing, bearish candlestick pattern, and EMA trend filter conditions are met.
Exit conditions:
Take profit or stop loss is reached.
Plotting:
Signals are plotted on the chart when entry conditions are met.
EMAs are plotted when the EMA trend filter is enabled.
This script aims to capture potential trend reversal points based on a combination of candlestick patterns, RSI, and EMA trend analysis.
Traders can use this script as a starting point for further customization or as a reference for developing their own trading strategies. It's important to note that past performance is not indicative of future results, and thorough testing and validation are recommended before deploying any trading strategy.
Japanese Candle Patterns Detector in Potential Price ZoneThis script would find the 8 famous "Japanese Candle Stick Patterns" in your chart.
Please be aware it find patterns in "Potential price zones" only, which help you to avoid none-important patterns during a price trend.
I used RSI and ATR in my codes to find best candle forms and price conditions.
*** This indicator shared before but without source code. According to follow requests, I publish it again with source codes. I hope it helps you in trading journey...
Bellow patterns are detecting:
Hammer | ShootingStar | Engulfing Candle | Doji | Tweezers Top/Buttom | Three White Soldiers/Three Black Crows | Marubozu | Harami
* You can select your preferred patterns from indicator setting.
* Pattern names are abbreviated for better view on chart.
* Separate alerts for different type of candles for whom looking for a specific candle pattern
* Main alert which notify about every kind of candle patterns detect in a chart
PERFECT ENGULFING Candlestick Patterns by AnmolWill add some more patterns and conditions in it in future, for now its for detecting PERFECT Engulfings only.
Use these Engulfing to take a trade when it get detected on support/resistance
Engulfing and emaThis is a Pine Script script that helps you see the Engulfing Candlestick and Inside Bar (Boring Candle) candle patterns on the TradingView chart, as well as drawing two Exponential Moving Averages (EMA). Here's a simple explanation:
1. **Candle Pattern**:
- This script identifies the Engulfing Candlestick pattern, which indicates potential changes to the price. If this pattern is detected, the script will show a green (for buy) or red (for sell) arrow above or below that candle.
- The script also identifies the Inside Bar (Boring Candle), which indicates the period area in the market. This candle will be the color you choose (default is orange).
2. **Moving Average (EMA)**:
- This script also plots two Exponential Moving Averages (EMA) on the chart. EMA is a tool that helps you see price trends more clearly.
3. **Risk Management**:
- This script calculates the Stop Loss (SL) and Take Profit (TP) levels for each Engulfing pattern. This helps you manage your trading risks.
- Labels are displayed on the charts for SL and TP, so you know where to place them.
With the help of this script, you can easily identify important patterns in the market and manage your risks better. Make sure to choose a demo account before using it in real trading.
Engulfing Box & LinesThe "Engulfing Box & Lines" indicator aims to spot and highlight Engulfing candlestick patterns within a trend. These patterns can provide valuable indications of a possible trend reversal, and the indicator underlines them through the use of colored rectangles and horizontal lines. To fully understand the functioning and use of this indicator, let's explore its key elements and associated strategies.
Identification of Engulfing Patterns:
The indicator focuses on detecting two types of Engulfing candles:
Bullish Engulfing: Occurs when a bullish candle (open lower than close) completely encloses the body of the previous bearish candle. This could indicate a possible upside reversal.
Bearish Engulfing: Occurs when a bearish candle (opening higher than closing) entirely engulfs the body of the previous bullish candle. This could signal a potential bearish reversal.
Using the EMA 200:
The indicator uses the 200-period Exponential Moving Average (EMA) as a reference to determine the position of the candles with respect to the long-term trend. When the price is above the 200 EMA, the bullish Engulfing candles are highlighted with a green box, while below the 200 EMA, red boxes are shown for the bearish Engulfing candles.
Size of Boxes and Lines:
The colored boxes represent the size of the body of the candle that caused the Engulfing. Additionally, a horizontal line is drawn close to the body of the candle, serving as the fulcrum of the indicator.
Trading Strategies:
This indicator can be used for different trading strategies:
Trend Continuation: During a positive trend, the onset of an engulfing pattern suggests a possible continuation of the trend. The horizontal lines represent potential support areas, where the price could bounce. Traders might consider buying during such bounces.
Retracements and Entries: Lines can act as support or resistance zones, depending on the trend. When the price approaches a line, a retracement could occur. Traders might move to a lower timeframe to spot entry signals, using the line as a reference.
Closing Positions: Lines could also be used to define exit levels. For example, a trader might decide to exit a position when the price approaches a resistance line.
Confirmations with Other Indicators: The indicator could be used in conjunction with other technical tools, such as oscillators or candlestick analysis, to confirm signals and improve the accuracy of trading decisions.
Buy/Sell EMA CandleThis indicator is designed to display various technical indicators, candle patterns, and trend directions on a price chart. Let's break down the code and explain its different sections:
Exponential Moving Averages (EMA):
The code calculates and plots five EMAs of different lengths (13, 21, 55, 90, and 200) on the price chart. These EMAs are used to identify trends and potential crossovers.
Engulfing Candle Patterns:
The code identifies and highlights potential bullish and bearish engulfing candle patterns. It checks if the current candle's body size is larger than the combined body sizes of the previous and subsequent four candles. If this condition is met, it marks the pattern on the chart.
s3.tradingview.com
EMA Crossovers:
The code identifies and highlights points where the shorter EMA (ema1) crosses above or below the longer EMA (ema2). It plots circles to indicate these crossover points.
Candle Direction and RSI Trend:
The code determines the trend direction of the last candle based on whether it closed higher or lower than its open price. It also calculates the RSI (Relative Strength Index) and determines its trend direction (overbought, oversold, or neutral) based on predefined thresholds.
s3.tradingview.com
Table Display:
The code creates a table displaying trend directions for different timeframes (monthly, weekly, daily, 4-hour, and 1-hour) for candle direction and RSI trends. The trends are labeled with "L" for long, "S" for short, and "N/A" for not applicable.
High Volume Bars (HVB):
The code identifies and colors bars with above-average volume as either bullish or bearish based on whether the price closed higher or lower than it opened. The color and conditions for high volume bars can be customized.
s3.tradingview.com
Doji Candle Pattern:
The code identifies and marks doji candle patterns, where the open and close prices are very close to each other within a certain percentage of the candle's high-low range.
RSI-Based Candle Coloring:
The code adjusts the color of the candles based on the RSI value. If the RSI value is above the overbought threshold or below the oversold threshold, the candles are colored yellow.
Usage and Interpretation:
Traders can use this indicator to identify potential trend changes based on EMA crossovers and candle patterns like engulfing and doji.
The RSI trend direction can provide additional insight into potential overbought or oversold conditions.
High volume bars can indicate potential price reversals or continuation patterns.
The table provides an overview of trend directions on different timeframes for both candle direction and RSI trends.
Keep in mind that this is a complex indicator with multiple features. Users should carefully evaluate its performance and consider combining it with other indicators and analysis methods for more accurate trading decisions.
The table is designed to provide a consolidated view of trend directions and other indicators across multiple timeframes. It is displayed on the chart and organized into rows and columns. Each row corresponds to a specific aspect of analysis, and each column corresponds to a different timeframe.
Here's a breakdown of the components of the table:
Row 1: Separation.
Row 2 (Header Row): This row contains the headers for the columns. The headers represent the different timeframes being analyzed, such as Monthly (M), Weekly (W), Daily (D), 4-hour (4h), and 1-hour (1h).
Row 3 (Content Row): This row contains labels indicating the types of information being displayed in the columns. The labels include "T" for Trend, "C" for Current Candle, and "R" for RSI Trend.
Row 4 and Onwards: These rows display the actual data for each aspect of analysis across different timeframes.
For each aspect of analysis (Trend, Current Candle, RSI Trend), the corresponding rows display the following information:
Monthly (M): The trend direction for the given aspect on the monthly timeframe.
Weekly (W): The trend direction for the given aspect on the weekly timeframe.
Daily (D): The trend direction for the given aspect on the daily timeframe.
4-hour (4h): The trend direction for the given aspect on the 4-hour timeframe.
1-hour (1h): The trend direction for the given aspect on the 1-hour timeframe.
The trend directions are represented by labels such as "L" for Long, "S" for Short, or "N/A" for Not Applicable.
The table's purpose is to provide a quick overview of trend directions and related information across multiple timeframes, aiding traders in making informed decisions based on the analysis of trend changes and other indicators.
Engulfing IndicatorThis is an "Engulfing" indicator. The "Engulfing" candle pattern is a reversal pattern that can appear at the end of an uptrend or downtrend.
The indicator includes the following inputs or settings:
1. `tolerance`: This defines the percentage difference in size that there must be between the body of the current candle and that of the previous candle to consider that one candle "engulfs" the other.
2. `tailSizePercentage`: This defines the maximum percentage size of the candle's tail in relation to the body of the candle for it to be considered valid.
3. `hideBuy` and `hideSell`: If set to true, they hide the buy and sell labels on the chart.
4. `checkTailSize` and `checkPrevTailSize`: If set to true, they check the size of the tail of the current and previous candle in relation to the body of the candle. If the tail is too large (as defined by `tailSizePercentage`), it is not considered valid.
The indicator works as follows:
First, it calculates the size of the body of the current and previous candle. Then, it checks if the current candle is green (close greater than open) or red (close less than open).
Next, it checks if the current candle "engulfs" the previous one. This means that, in the case of a green candle, the open must be less than or equal to the previous candle's close and the close must be greater than or equal to the previous candle's open. For a red candle, it's the other way around.
The indicator also checks if the size of the previous candle's body is at least a certain percentage (defined by `tolerance`) of the size of the current candle's body.
If `checkTailSize` or `checkPrevTailSize` is enabled, the indicator also checks the size of the tail of the current and/or previous candle. If the tail is too large in relation to the body of the candle (as defined by `tailSizePercentage`), the candle is not considered valid.
Finally, if all conditions are met, a buy or sell signal is generated and a label is drawn on the chart. An alert is also generated.
Buy&Sell Bullish Engulfing - The Quant Science🇺🇸
GENERAL OVERVIEW
Buy&Sell Bullish Engulfing - The Quant Science It is a Buy&Sell strategy based on the 'Bullish Engulfing' candlestick pattern. The main goal of the strategy is to achieve a consistent and sustainable return over time, with a manageable level of risk.
Bullish Engulfing
The template was developed at the top of the Indicator provided by TradingView called 'Engulfing - Bullish'.
ENTRY AND EXIT CRITERIA
Entry: A single long order is opened when the candlestick pattern is formed, and the percentage size of the order (%) is fixed by the trader through the user interface.
Exit: The long trade is closed on a percentage equity take profit-stop loss.
----------------------------------------------------------------------------------------------------------------------------------------------------------------------------------------------
🇮🇹
PANORAMICA GENERALE
Buy&Sell Bullish Engulfing - The Quant Science è una strategia Buy&Sell basata sul candlestick pattern 'Bullish Engulfing'. L'obiettivo principale della strategia è ottenere un ritorno costante e sostenibile nel tempo, con un livello gestibile di rischio.
Bullish Engulfing
Il template è stato sviluppato al top dell' Indicatore fornito da Trading View chiamato 'Engulfing - Bullish'.
CRITERI DI ENTRATA E USCITA
Entrata: viene aperto un singolo ordine long quando si forma il candlestick pattern, la size percentuale dell'ordine (%) viene selezionato tramite l'interfaccia utente dal trader.
Uscita: la chiusura della posizione avviene unicamente tramite un take profit-stop loss percentuale calcolato sul capitale.
Trading Session TemplateDescription:
The Trading Session Template Indicator is a powerful script that allows traders to customize their own trading session time range on a chart. With this indicator, you have the flexibility to define specific hours during which you prefer to focus your trading activities. The example chart showcases the New York session hours, but you can easily adapt it to any desired time range based on your trading strategy and preferences.
Key Features:
Customizable Trading Session: The indicator empowers you to define your own trading session time range, tailored to your preferred market sessions or specific trading hours. This flexibility ensures that the indicator aligns with your unique trading strategy.
Highlighted Trading Session: When a new trading day begins, the script automatically scans for the specified time range. Once the first candle within the range begins printing, the background color of the chart is highlighted, indicating the beginning of the trading session. When the last candle within the range is closed, the background color returns to normal.
Focus on Specific Market Sessions: This indicator is particularly useful for traders who prefer to trade certain market sessions or specific hours during the day. By customizing the trading session, you can better align your trading activities with specific market conditions and trading opportunities.
Candle Pattern Detection: The indicator includes the ability to detect candle patterns such as Doji, Engulfing, Hammer, and Shooting Star. You can activate the desired candle patterns and set up alerts for them. When an alert is triggered, indicating the formation of a specific candle pattern, you can further analyze the market and make informed trading decisions.
ATR Filter: The indicator offers an ATR (Average True Range) filter to limit noise and focus on candle patterns with a size comparable to the ATR. You can set a minimum and maximum size for a candle compared to the ATR. This helps you filter out smaller or larger candles that may not align with your trading preferences.
Stop Loss (SL) and Take Profit (TP) Levels: When a candle pattern is detected, based on the ATR, the indicator can display suggested Stop Loss and Take Profit levels. This feature provides additional guidance for risk management and potential profit targets.
User-Friendly Interface: The indicator provides a user-friendly interface with adjustable settings and switches for customization. Tooltips are available to guide you through the various options and configurations, making it easy to adapt the indicator to your trading style and preferences.
Note:
The Trading Session Template Indicator is designed for timeframes lower than 1D. It does not plot any information on timeframes of 1D and higher.
Disclaimer:
The Trading Session Template Indicator is provided for informational and educational purposes only. Trading in the financial markets involves risk, and you should only trade with funds that you can afford to lose. The indicator's past performance is not indicative of future results. Always conduct your own research and due diligence before making any investment decisions. The creator of this indicator shall not be held responsible for any losses or damages incurred from the use of this indicator.
3 Line Strike MTF [MsF]Japanese below / 日本語説明は英文の後にあります。
-------------------------
*This indicator is based on TheTrdFloor's "3 Line Strike ". It's a very cool indicator. thank you.
In addition to the original indicator, it will be judged Engulfing only when the display of the MTF signal and the candle have a difference of 2 times or more.
=== Function description ===
1. Display of the MTF signal
Detects Engulfing of the specified Multi Time Frame. MTF Engulfing is displayed with 🍆 and 🍑.
2. Judged Engulfing on a difference of 2 times or more
Show a signal if the body of the current candle is more than twice as large as the body of the previous candle. This will make the signal mark appear larger than normal.
=== Parameter description ===
- COMMON SETTING
- Show Signal on MTF ? … If the check this, you can get MTF 3 Line Strike
- Judge Double Engulfing ? … If you check it, the signal will come up only when the Engulfing has doubled or more.
- 3 LINE STRIKE
- Show Bearish 3 Line Strike … The Bearish 3 Line Strike (3LS-Bear) is a candlestick pattern comprised of 3 bullish (green) candles, followed by a bearish engulfing candle (see 'Big A$$ Candles' below). This pattern tends to be best used as a signal of the end of a retracement period as part of a trend continuation strategy. Default: Checked
- Show Bullish 3 Line Strike … The Bullish 3 Line Strike (3LS-Bull) is a candlestick pattern comprised of 3 bearish (red) candles, followed by a bullish engulfing candle (see 'Big A$$ Candles' below). This pattern tends to be best used as a signal of the end of a retracement period as part of a trend continuation strategy. Default: Checked
- BIG A$$ CANDLES
- Show Bearish Big A$$ Candles … Bearish 'Big A$$ Candles' are the same as Bearish Engulfing candles.
- Show Bullish Big A$$ Candles … Bullish 'Big A$$ Candles' are the same as Bullish Engulfing candles.
-------------------------
本来のインジケーターに、①MTFシグナルの表示と②ローソク足の表示に2倍以上の差がある場合のみ包み足の判定を追加しました。
=== 機能説明 ===
1. MTFシグナルの表示
指定された時間足の包み足を検出します。 🍆 と 🍑 で表示されます。
2. 2倍以上の差で包み足判定
現在のローソクの実体が前のローソクの実体よりも 2 倍以上大きい場合にシグナルを表示します。マークは通常よりも大きく表示されます。
=== パラメータの説明 ===
- COMMON SETTING
- Show Signal on MTF ? … MTFシグナルを表示します
- Judge Double Engulfing ? … 包み足が前の足の2倍以上になった場合のみシグナルを発報します
- 3 LINE STRIKE
- Show Bearish 3 Line Strike … 陰線が3連続続いた後の包み足を検出します
- Show Bullish 3 Line Strike … 陽線が3連続続いた後の包み足を検出します
- BIG A$$ CANDLES
- Show Bearish Big A$$ Candles … 陽線の包み足を検出します
- Show Bullish Big A$$ Candles … 陰線の包み足を検出します
Engulfing and Doji Scanner with SLThe Bullish Engulfing pattern occurs when the close is higher than the open, and scripts will look for this pattern by checking the difference in the close and open prices sufficiently in pips. Likewise, the Bearish Engulfing pattern occurs when the close is lower than the open, and scripts will look for this pattern by checking for sufficient difference in the open and close in pips.
The Doji pattern occurs when the absolute difference between the open and close prices is very small compared to the price range for that period. The script will look for these patterns by comparing the difference between the open and close prices by a certain percentage of the price range.
After the patterns are detected, the script will calculate the Stop Loss (SL) and Take Profit (TP) levels based on the parameters set. The SL level will be determined based on the lowest price range with certain adjustments, while the TP level is calculated using a 1:1 ratio to the SL distance.
This script will display arrows and Stop Loss and Take Profit labels on the chart to assist traders in identifying relevant patterns and levels. However, it is important to remember that these scripts only assist in the analysis of patterns and levels, and a more complete trading strategy and decision-making remains the responsibility of the trader.
Liquidity Engulfing & Displacement [MsF]Japanese below / 日本語説明は英文の後にあります。
-------------------------
*This indicator is based on upslidedown's "Liquidity Engulfing Candles ". It's a very cool indicator. thank you.
It has 2 functions: show the Liquidity Engulfing on HTF and candle color change when displacement occurs.
=== Function description ===
1. Liquidity Engulfing on HTF
This indicator gives Liquidity Engulfing signals not only for the current candle, but also for H4 and H1 on HTF.
You can use that a bullish engulfing on H1 is a BOS on m5 and on H4 is a BOS on m15. It uses the theory of stop hunt from ICT.
Also, It's possible to fire alert.
2. Displacement
Change the color display of the candlesticks when a bullish candleStick or bearish candleStick is attached. Furthermore, by enabling the "Require FVG" option, you can easily discover the FVG (Fair Value Gap). It is a very useful function for ICT trading.
When H1 candle takes liquidity from one side and moves with an explosive move to the other side of the previous candle (displacement), it creates break of market structure on M5. Entry on discount FVG or OTE with stop loss at or below the stop hunt wick.
=== Parameter description ===
- Liquidity engulfing candles(LEC) SETTING
- Show H1 LEC … Whether to show LEC for H1
- Show H4 LEC … Whether to show LEC for H4
- Show Current LEC … Whether to show LEC for current timeframe
- Apply Stop Hunt Wick Filter … Require candle wick into prior candle retracement zone
- Apply Close Filter … Require LL/HH on candle in order to print a valid engulfing signal
- DISPLACEMENT SETTING
- Require FVG … Draw only when FVG occurs
- Displacement Type … Displacement from open to close? or from high to low?
- Displacement Length … Period over which to calculate the standard deviation
- Displacement Strength … The larger the number, the stronger the displacement detected
-------------------------
2つの機能があります: 上位足のLiquidity engulfing(流動性獲得)を表示することと、大きな変位が発生したときにローソク足の色を変更することです。
=== 機能説明 ===
1. 上位足のLiquidity engulfing
このインジケーターは、現在のローソク足だけでなく、上位足の H4 および H1 に対してもLiquidity engulfingシグナルを提供します。
H1はm5、H4はm15での使用を推奨します。これはICTのストップハント理論を活用しています。また、アラートを発することも可能です。
2. 変位(DISPLACEMENT)
大きな陽線、陰線を付けた場合に、そのローソク足をカラー表示を変更します。
さらに"Require FVG"オプションを有効にすることで、FVG(Fair Value Gap)を容易に発見することができます。ICTトレードにを行うにあたり大変有用な機能となっています。
=== パラメータの説明 ===
- Liquidity engulfing candles(LEC) SETTING
- Show H1 LEC … H1のLECを表示するかどうか
- Show H4 LEC … H4のLECを表示するかどうか
- Show Current LEC … 現在の期間の LEC を表示するかどうか
- Apply Stop Hunt Wick Filter … ハラミ足、もしくは包み足になっている場合のみに検知させる
- Apply Close Filter … 1つ前のローソクよりも終値で超えていた場合のみに検知させる
- DISPLACEMENT SETTING
- Require FVG … FVG発生時のみ描画する
- Displacement Type … openからcloseまでの変位か?highからlowまでの変位か?
- Displacement Length … 標準偏差を計算する期間
- Displacement Strength … 変位の強さ(数字が大きいほど強い変位を検出)
Bull & Bear Engulfing - 3 Strike and 180 CandlesHello, SenatorVonShaft here.
This indicator shows 3 differend candlestick formations:
1- Bullish & Bearish Engulfing Candle
2- Bullish & Bearish 3 Strike Candle
3- Bullish & Bearish 180 Degree Candle
It has 3 variables
1- Bar Fullness - Differs from %50 - %100 showing 1 candle's fullness
2- Avg. Backwds Candls - Gets the average weight of the backward candles
3- Avg. Bar Height Multiplier - This variable is multiplied by above value to determine engulfing candles.
Plots:
- Green & Red Arrows Only : Shows Bullish & Bearish engulfing candles
- Green & Red 180 : Shows a bullish or bearish engulfing candle taken over by a bigger opposite candle
- Green & Red 3S : Shows bullish & bearish 3 strike candle formation
Please feel free to comment your thoughts below.
See you.
FRAMA and Candlestick Patterns [CSM]FRAMA (Fractal Adaptive Moving Average) is a technical analysis indicator that adapts its smoothing period according to the market's volatility, allowing it to provide accurate signals in all market conditions. This indicator script plots the FRAMA on a chart and generates buy and sell signals based on the FRAMA and candlestick patterns. It also includes an option to filter signals based on bullish and bearish engulfing patterns.
To detect candlestick patterns, the script imports the "BankNifty_CSM" library from the creator's public library on TradingView. The FRAMA calculation is done using a loop that iterates over the last "length" number of bars, with the smoothing factor adjusted based on the "fracDim" parameter.
The buy and sell signals are generated based on the position of the current price relative to the FRAMA line. If the "engulfing" parameter is set to true, the signals are further filtered based on bullish and bearish engulfing patterns.
Overall, this script combines various technical indicators and candlestick pattern recognition to provide a complete trading strategy. However, as with any trading strategy, it should be thoroughly backtested and evaluated before using it in a live trading environment.
Liquidity prints / quantifytools- Overview
Liquidity prints detect points in price where buyers or sellers are being effectively absorbed, indicative of price being on a path of resistance. In other words, the prints detect points in price where hard way is likely in current motion and easy way in the opposite. Prints with ideal attributes such as prints into extended trends or into a deviation are marked separately as print confluence. Prints with important or multiple confluence factors give further color into potential strength and duration of print influence. Liquidity prints are detected using an universally applicable method based on price action (OHLC). The prints principally work on any chart, whether that is equities, currencies, cryptocurrencies or commodities, charts with volume data or no volume data. Essentially any asset that can be considered an ordinary speculative asset. The prints also work on any timeframe, from second charts to monthly charts. Liquidity prints are activated real-time after a confirmed bar close, meaning they are not repainted and can be interacted with once a confirmation is in place.
Liquidity prints are based on the premise that price acts a certain way when sufficient liquidity is found, in other words when price shows exhaustion of some sort. A simple example of such price action are wicks, attempted moves that were rejected within the same time period where move was initiated. This type of price action typically takes place when price is close to or at meaningful amount of bids in an order book. There's no guarantee the stacked orders can't be just cleared and moved through, but at face value it does not make sense to expect price moving the hard way. When sufficient amount of characteristics in price action are hinting proximate liquidity, a print is activated. As a barometer for print feedback quality, short term impact on price rate of change and likelihood of print lows/highs being revisited during backtesting period are tracked for each print. Peak increase/decrease during backtesting period is also recorded and added to average calculations. Liquidity prints can also be backtested using any script that has a source input, including mechanic strategies utilizing Tradingview's native backtester.
Key takeaways
Liquidity prints are activated when price is showing signs of grind against path of greater resistance, leaving path of least resistance to the opposite direction.
Liquidity prints with ideal attributes are marked separately as print confluence, giving further color into print strength and duration of influence.
Liquidity prints are backtested using price rate of change, print invalidation mark and peak magnitude metrics.
Liquidity prints can be backtested and utilized in any other Tradingview script, including mechanic strategies utilizing Tradingview's native backtester.
Liquidity prints are detected using price action based methodology. They principally work on any chart or timeframe, including charts with no volume data.
Liquidity prints are activated real-time after a confirmed bar close and are not repainted.
For practical guide with practical examples, see last section.
Accessing script 🔑
See "Author's instructions" section, found at bottom of the script page.
Disclaimer
Liquidity prints are not buy/sell signals, a standalone trading strategy or financial advice. They also do not substitute knowing how to trade. Example charts and ideas shown for use cases are textbook examples under ideal conditions, not guaranteed to repeat as they are presented. Liquidity prints notify when a set of conditions (various reversal patterns, overextended price etc.) are in place from a purely technical standpoint. Liquidity prints should be viewed as one tool providing one kind of evidence, to be used in conjunction with other means of analysis.
Liquidity print quality is backtested using metrics that reasonably depict their expected behaviour, such as historical likelihood of price slowing down or turning shortly after a print. Print quality metrics are not intended to be elaborate and perfect, but to serve as a general barometer for print feedback. Backtesting is done first and foremost to exclude scenarios where prints clearly don't work or work suboptimally, in which case they can't be considered as valid evidence. Even when print metrics indicate historical reactions of good quality, price impact can and inevitably does deviate from the expected. Past results do not guarantee future performance.
- Example charts
Chart #1: BTCUSDT
Chart #2: DXY
Chart #3: NQ futures
Chart #4: Crude oil futures
Chart #5: Custom timeframes
- Print confluence
Attributes that make prints ideal in one way or another are marked separately as print confluence, giving clue into potential strength and duration of print influence. Prints with important or multiple confluence factors can be considered as heavier and more reliable evidence of price being on a path of resistance. Users can choose which confluence to show/hide (by default all) and set a minimum amount of confluence for confluence text to activate (by default 1).
Confluence type #1: Trend extensions
Price trending for abnormally long time doesn't happen too often and requires effort to sustain. Prints taking place at extended trends often have a longer duration influence, indicating a potential larger scale topping/bottoming process being close. Trend extension confluence is indicated using a numbered label, equal to amount of bars price has been in a trending state.
Confluence type #2: Consecutive prints
Prints that take place consecutively imply heavier resistance ahead, as required conditions trigger multiple times within a short period. Consecutive prints tend to lead to more clean, aggressive and heavier magnitude reactions relative to prints with no confluence. Consecutive print confluence is indicated using a numbered label with an x in front, equal to amount of prints that have taken place consecutively.
Confluence type #3: Deviations
When price closes above/below prior print highs/lows and closes right back in with a print, odds are some market participants are stuck in an awkward position. When market participants are stuck, potential for a snowball effect of covering underwater positions is higher, driving price further away. Prints into deviations act similarly to consecutive prints, elevating potential for more aggressive reactions relative to prints with no confluence. Deviation confluence is indicated using a label with a curve symbol.
- Backtesting
Built-in backtesting is based on metrics that are considered to reasonably quantify expected behaviour of prints. Main purpose of the metrics is to form a general barometer for monitoring whether or not prints can be viewed as valid evidence. When prints are clearly not working optimally, one should adjust expectations accordingly or take action to improve print performance. To make any valid conclusions of print performance, sample size should also be significant enough to eliminate randomness effectively. If sample size on any individual chart is insufficient, one should view feedback scores on multiple correlating and comparable charts to make up for the loss.
For more elaborate backtesting, prints can be used in any other script that has a source input, including fully mechanic strategies utilizing Tradingview's native backtester. Print plots are created separately for regular prints and prints with each type of confluence.
Print feedback
Print feedback is monitored for 3 bars following a print. Feedback is considered to be 100% successful when all 3/3 bars show a supportive reaction. When 2/3 bars are supportive, feedback rate is 66%, 1/3 bars = 33% and 0/3 = 0%. After print backtesting period is finished, performance of given print is added to average calculations.
Metric #1 : Rate of change
Rate of change used for backtesting is based on OHLC4 average (open + high + low + close / 4) with a length of 3. Rate of change trending up is considered valid feedback for bullish liquidity prints, trending down for bearish liquidity prints. Note that trending rate of change does not always correlate with trending price, but sometimes simply means current trend in price is slowing down.
Metric #2 : Invalidation mark
Print invalidation marks are set at print low/high with a little bit of "wiggle room". Wiggle room applied is always 1/10th of print bar range. E.g. for a bullish print with bar range of 2%, invalidation mark is set to 0.20% below print low. For most prints this is practically at print low/high, but in the case of prints with high volatility a more noticeable excess is given, due to the expectation of greater adverse reaction without necessarily meaning invalidation. A low being above invalidation mark is considered valid feedback for bullish prints and a high being below invalidation mark for bearish prints.
Metric #3 : Peak increase/decrease
Unlike prior two metrics, peak increase/decrease is not feedback the same way, but rather an assisting factor to be viewed with feedback scores. Peak increase/decrease is measured from print close to highest high/lowest low during backtesting period and added to average calculations
Feedback scores
When liquidity prints are working optimally, quality threshold for both feedback metrics are met. By default, threshold is set to 66%, indicating valid feedback on 2/3 of backtesting periods on average. When threshold is met, a tick will appear next to feedback scores, otherwise an exclamation mark indicating suboptimal performance on either or both.
By default, the prints are filtered as little as possible, idea behind being that it is better to have more poor prints filtered with discretion/mechanically afterwards than potentially filtering too much from the get go. Sometimes filtering is insufficient, leading to failed reactions beyond a tolerable level. When this is the case, print sensitivity can be adjusted via input menu, separately for bullish and bearish prints. Print filter sensitivity ranges from 1 to 5, by default set to 1. Lower sensitivity sets looser criteria for print activation, higher sensitivity sets stricter criteria. For most charts and timeframes default sensitivity works just fine, but when this is not the case, filters can be tweaked in search of better settings. If feedback score threshold is met, it's better to keep filter sensitivity intact and use discretion, which is much more nuanced and capable than any mechanical process. If feedback scores are still insufficient after tweaking, depending on the severity of lack, prints should be vetted extra carefully using other means of analysis or simply avoided.
Verifying backtest calculations
Backtest metrics can be toggled on via input menu, separately for bullish and bearish prints. When toggled on, both cumulative and average counters used in print backtesting will appear on "Data Window" tab. Calculation states are shown at a point in time where cursor is hovered. E.g. when hovering cursor on 4th of January 2021, backtest calculations as they were during this date will be shown. Backtest calculations are updated after backtest period of a print has finished (3 bars). Assisting backtest visuals are also plotted on chart to ease inspection.
- Alerts
Available alerts are the following.
- Bullish/bearish liquidity print
- Bullish/bearish liquidity print with specified print confluence
- Bullish/bearish liquidity print with set minimum print confluence amount exceeded
- Visuals
Visual impact of prints can be managed by adjusting width and length via input menu. Length of prints is available in 3 modes (1-3 from shortest to longest) and width in 10 modes (1-10 from narrowest to widest).
Print confluence text can be embedded inside print nodes, eliminating visuals outside the chart.
Metric table is available in two themes, Classic and Stealth.
Metric table can be offsetted horizontally or vertically from any four corners of the chart, allowing space for tables from other scripts.
Table sizes, label sizes and colors are fully customizable via input menu.
-Practical guide
Key in maximizing success with prints is knowing when they are likely reliable and when not. In general, the more volatile and ranging the market regime, the better liquidity prints will work. Any type of volatile spike in price, parabola or a clean range is where liquidity prints provide optimal feedback. On the other hand low volatility and trending environments are suboptimal and tend to provide more mute/lagged or completely failed feedback. Anomalies such as market wide crashes are also environments where prints can't be expected to work reliably.
Being aware of events on multiple timeframes is crucial for establishing bias for any individual timeframe. Not often it makes sense to go against higher timeframe moves on lower timeframes and this principle of timeframe hierarchy also applies to prints. In other words, higher timeframe prints dictate likelihood of successful prints on lower timeframes. If hard way on a weekly chart is up, same likely applies to daily chart during weekly print influence time. In such scenarios, it's best to not swim in upstream and avoid contradicting lower timeframe prints, at least until clear evidence suggesting otherwise has developed.
Points in price where it anyway makes sense to favor one side over the other are key points of confluence for prints as well. Prints into clean range highs/lows with clean taps can be valuable for optimal entry timing. This is especially true if simultaneously previous pivot gets taken out, increasing odds of liquidity indicated by a print being swept stop-losses.
Prints that don't match underlying bias (e.g. bullish prints at range high, bearish prints at range low) should be avoided until clear evidence has developed favoring them, such as a convincing break through a level followed by a re-test.
Prints that are immediately rejected aggressively are more likely prints that end up failing. Next bar following a print closing below print lows/above print highs is a strong hint of print failure. To consider print still valid in such cases, there should be quick and clear defending of print lows/highs. Failed prints are an inevitable bummer, but never useless. Failed prints are ideal for future reference, as liquidity still likely exists there. Re-tests into these levels often provide sensible entries.
Stacked confluence doesn't come too often and is worth paying special attention to, as multiple benefitting factors are in place simultaneously.
From a more zoomed out perspective, any larger zone with multiple prints taking place inside are potential topping/bottoming processes taking place, also worth paying attention to.
Engulfing Pinbar [serkany88]This is an experimental candlestick pattern that combines pinbars and engulfing patterns as my own implementation. These signals can be used as a possible reversal points based on timeframe used or set wick size. Of course these signals should never be used on their own but rather can be used as another confluence of possible entry signal.
Functional and Manual alerts provided with simple and clean code.
TLDR: Use as a possible reversal point for your entries in combination with your trend and volatility filters. Green means possible bullish move, Red means possible bearish move.
The Candle Hunter Candlestick Pattern - by Karoshi TradingThe Candle Hunter Indicator - by Karoshi Trading
The Candle Hunter Indicator is based on specific Candlesticks and Patterns.
Activating this indicator will mark all specific Bullish & Bearish Candles on the Chart.
Depending on your settings, not all candles will be displayed on the chart.
The goal of this indicator is, to highlight all the important trending candles and ignore all ranging candles.
This can be helpful for rejecting/bouncing zones or S&R Levels. Or even if you like to trade reversals, you do not want to trade it on low volume ranging candles.
This indicator should only be used as a supplementary tool while trading, not as a stand alone.
Which Candles & Pattern will be marked on the chart?
1# Pinbar / Hammer (multiple Variations)
2# Marubozu Candles (multiple Variations)
3# Engulfing Candles (Multiple Variations)
How does this indicator works?
First of all, the indicator has to calculate 3 different parameters, before marking one of the given candle. To do so, we will need the average volume, average candle size and the specific candles.
1st Parameter: Defining the needed Candles
First of all, the indicator will calculate, based on the opening & closing price and also the wick (range of each candle). If one of the calculation is a match, for the mentioned candles above, we come to step 2.
2nd Parameter: Average Candle Size
The next one is the size of each candle, compared to the average candle on the chart.
You can customize the settings, but in this example, we want the specific candle be at least 1.5 times the size of the average last 14 candles.
3rd Parameter: Average Volume
The indicator will now calculate the average volume of the last selected candles period (default settings = 14) and compare it to the current candle. In this example, the current candle should be at least 1.5 times the average volume.
The indicator provides two possibilities to calculate the average volume:
1# Volume MA = Volume Moving Average
2# Volume SA = Volume Simple Average
Result: Colorizing the given Candle
After all parameters were met, the indicator will colorize and mark with a label + name all the candles on the chart.
Special Settings:
1st The Engulfing Candles, have 3 different options:
1# Classic = Only the body of the previous candle has to be engulfed by the current candle
2# Reinforced = The full candle + wick of the previous candle has to be engulfed
3# Multiple Candles = Minimum 3 previous candles has to be engulfed to be marked on the chart
The numbers of candles are changeable and you can have all 3 options simultaneously active.
That means, that the code will check all 3 options to see if there is a match.
2nd Marubozu Candle
You can set the ratio between body compared to wick in the settings. Depends if you want full marubozu candles or also the variations of it.
3rd Hammer Wick
You can decide how much bigger the wick should be, compared to the body of the candle. The default settings are set on 1.5 times.
You can also set the position of the body. As example if the settings are set on 30%, the body of the hammer should be on the upper half of a bullish hammer or the lower 30% of the candle if bearish.
FOREX MASTER PATTERN Companion ToolWhat This Indicator Does
The Forex Master Pattern uses candlesticks, which provide more information than line, OHLC or area charts. For this reason, candlestick patterns are a useful tool for gauging price movements on all time frames. While there are many candlestick patterns, there is one which is particularly useful...
The Engulfing Pattern
An engulfing pattern provides an excellent trading opportunity because it can be easily spotted and the price action indicates a strong and immediate change in direction. In a downtrend, an up candle real body will completely engulf the prior down candle real body (bullish engulfing). In an uptrend a down candle real body will completely engulf the prior up candle real body (bearish engulfing).
Used in conjunction with the FOREX Master Pattern value line, the Engulfing Pattern can assist the trader with reversal timing or trend confirmation during the expansion and trend phases.
As shown in the screenshot below. Engulfing Candles usually precede a sharp move in price in the direction of the engulfing candle.
As shown in the screenshot below, when the Show Lines option is ON while using the indicator, both red and green lines are drawn on the chart automatically when engulfing candles form. These lines are projected forward 100 bars and tend to be reliable support and resistance areas. These areas are typically hidden from view.
In addition to the Show Lines option, the indicator (by default) creates boxes around trading zones that are created when an engulfing candle is formed. (There is an option to hide these from view if desired).
As seen in the screenshot below, these areas / zones are wider than a line and encompass a resistance / support zone rather than a specific price. Liquidity is usually high in these areas and a lot of selling / buying occurs here. These zones are drawn in advance out into the future giving the trader an idea of where price will revert to eventually.
A combination of LINES and AREAS can be used giving the user a better idea of where within the zone price will go.
As seen on the screenshot below, this combination provides a pretty accurate indication of the reversal point well in advance.
As seen in the screenshot below, when a ZONE / AREA has been fully breached (crossed) by price, the area is deactivated an no longer continues forward on the chart. Until price breaches an area, it remains valid and continues on the chart until and only if it is breached by price.
The Indicator is fully customizable.
The use can change the color of the engulfing candles, the color of the zones, transparency etc. You can turn OFF or ON any of the features such as lines, zones, bar coloring, and plotted arrows.
I really hope you get value from this indicator and... HAPPY TRADING!!
AI-EngulfingCandleThis script is the combination of RSI and Engulfing Pattern
How it works
1. when RSI > 70 and form the bullish engulfing pattern . it gives sell signal
2. when RSI < 30 and form the bearish engulfing pattern . it gives buy signal
settings:
basic setting for RSI has been enabled in the script to set the levels accordingly to your trades
Engulfing Candles (Bullish and Bearish) + Trend | by Octopu$⛳ Engulfing Candles (Bullish and Bearish ) with Trend Recognition | by Octopu$
This Indicator identifies and plots Engulfing Candlestick Patterns.
Engulfing Candles are a combination of two bars on a price chart.
They are used to indicate/anticipate a market reversal.
The second candlestick must be bigger than the first, so it 'engulfs' the previous bar.
This indicator identifies both Price Movements:
Bullish stands for Upside
Bearish stands for Downside
These are NOT entry/exit signals to buy or sell securities*
(*The combination of your understanding and analysis as well as other Indicators and Factors as Confluence, you can improve your Charting Analysis.)
www.tradingview.com
SPY
ANY Ticker. ANY Timeframe.
( SPY 5m as an example only.)
Features:
• Engulfing Candles
• Bullish Setups
• Bearish Setups
• Symbol Signals
Options:
• Color Picker
• Symbol Selector
• Toggle On/Off
• Show name
• Trend Direction
Notes:
v1.0
Indicator release.
Changes and updates can come in the future for additional functionalities or per requests. Follow and Stay Tuned!
Did you like it? Please Support and Shoot me a message! I'd appreciate if you dropped by to say thanks! Thank you.
- Octopu$
🐙