Engulfing Pattern Alerts By PropFirm AlgoWe have now decided to make this indicator to support the trading community! If you find yourself struggling to identify bullish engulfing and bearish engulfing candles, this one is for you.
Release Notes:
Initial release with robust detection of bullish and bearish engulfing patterns.
Added trend and volume filters for enhanced pattern accuracy.
Custom alerts for real-time notifications of potential trading opportunities.
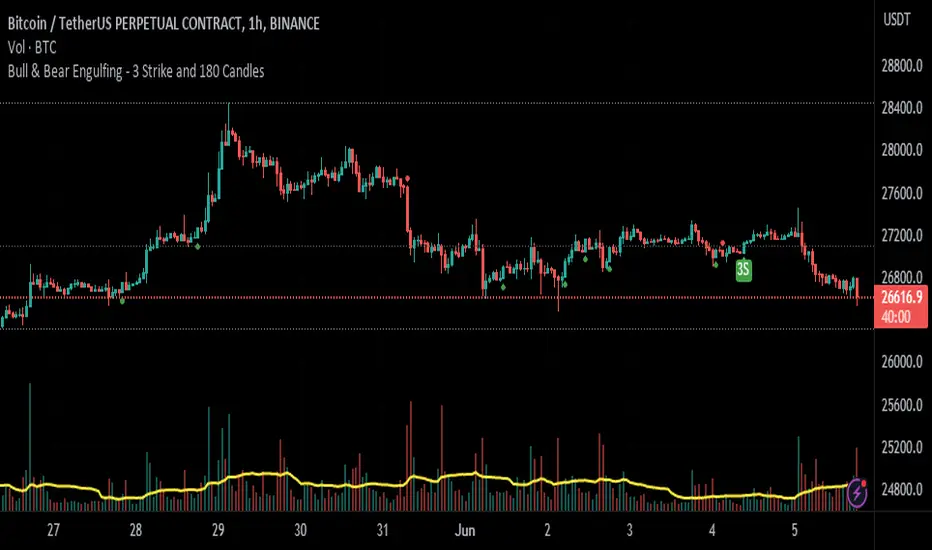
Appendix 1 - Example Case of Use For Educational Study.
Appendix 2 - Technical description which focuses on explaining the functionality of the script, how the code works, and how it can be used by traders, providing further immediate insight value.
Appendix 1:
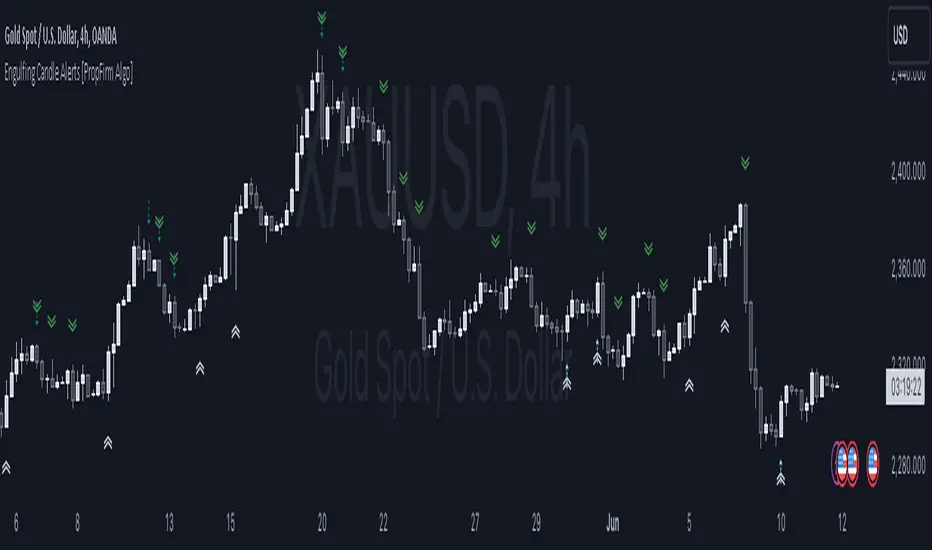
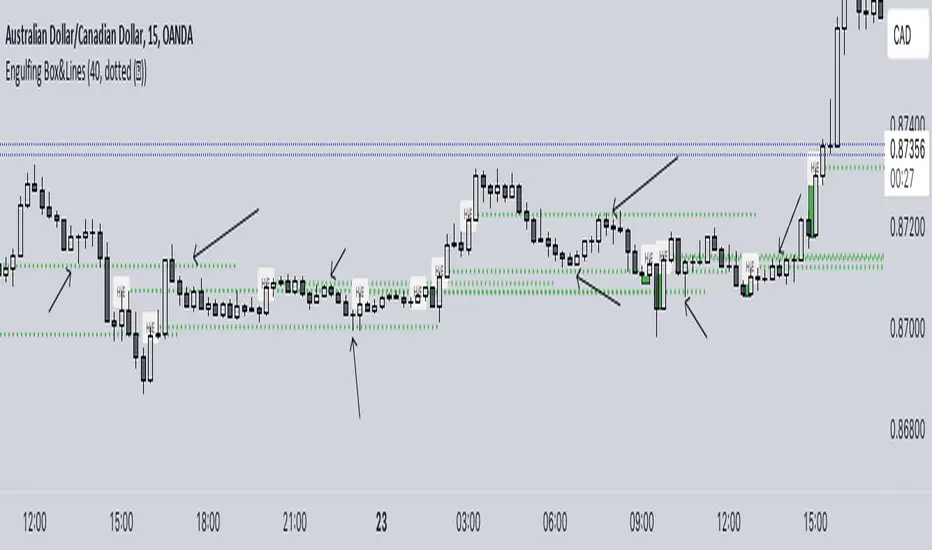
This indicator will provide you with Two types Bullish and Bearish Engulfing Alerts.
The Regular Bullish and Bearish Engulfing Candle's Shown As
Bullish Engulfing ︽
Bearish Engulfing ︾
And the Filtered Bullish and Bearish Engulfing Candle Shown As
Filtered Bullish Engulfing ⇡
Filtered Bearish Engulfing ⇣
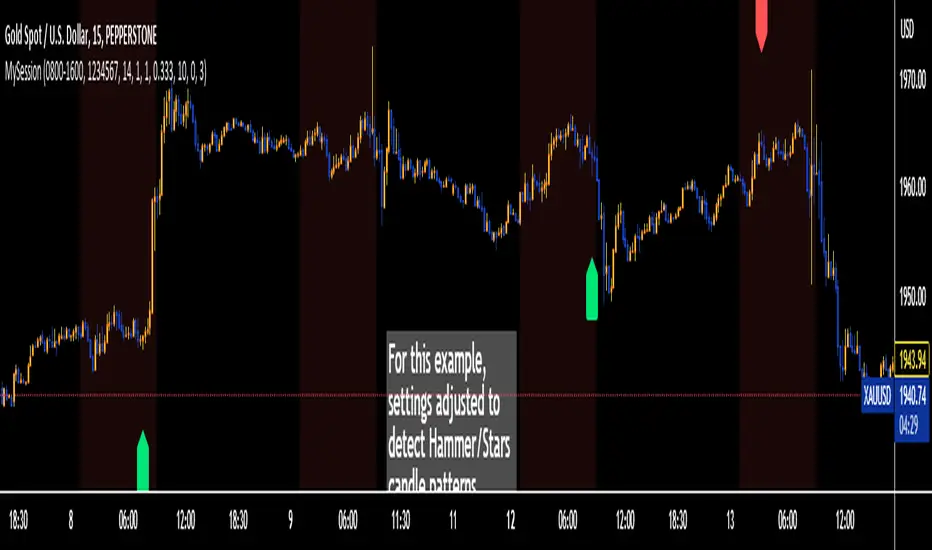
You can also change the Alert Symbol to any text, symbol or emoji of choice in the Setting Style Panel . This allows you to customize the alert symbol style to your liking, Example....
Using the power of artificial intelligence, we coded this indicator based on technical descriptions to perfect this simple problem.
Use this tool together with different strategies as a confirmation to your trading bias.
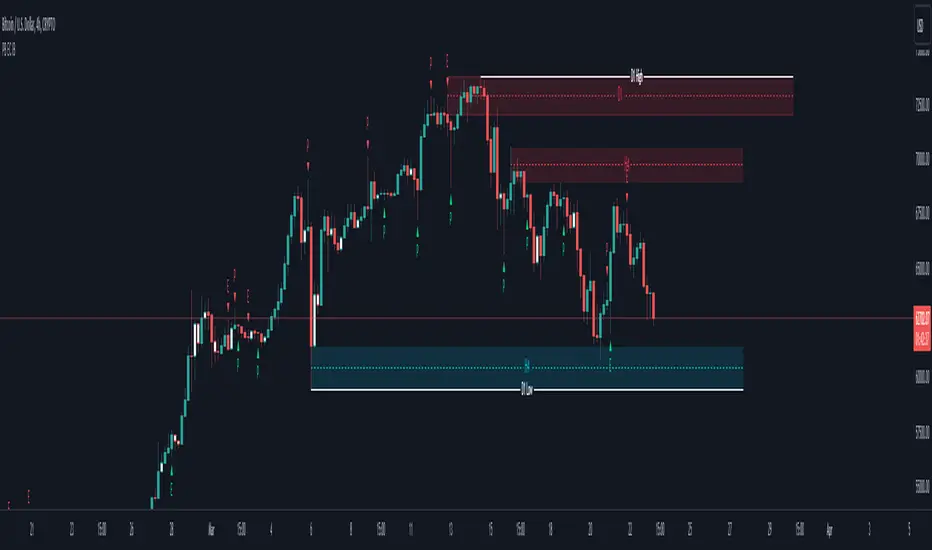
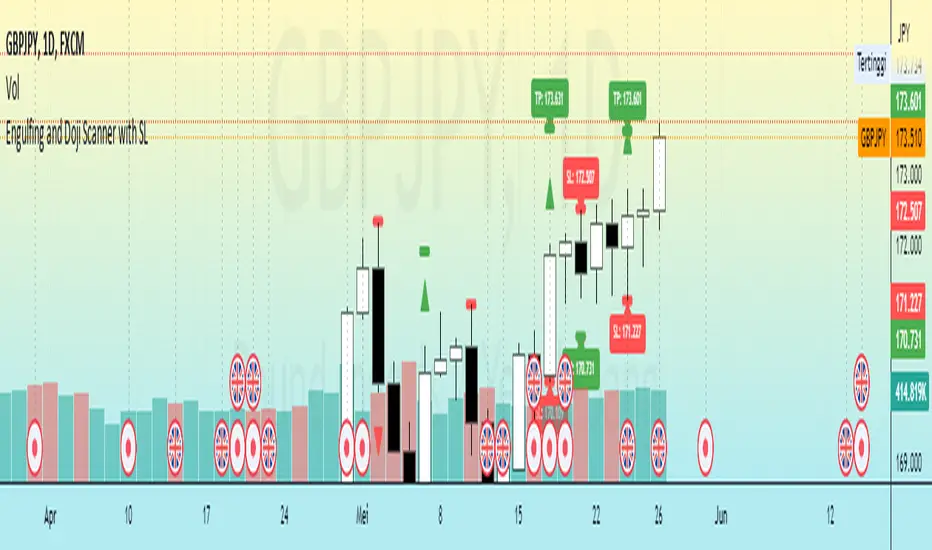
Use Supply and Demand Zones together with the Engulfing Pattern Alerts
First, Verify if the bullish engulfing candle is at the end of a dying trend.
Secondly, Check if it’s at a major 1-hour, 4-hour, or daily support and resistance zone.
Then wait for the retest, then enter a position.
DON’T USE THE ENGULFING ALERT AS A POINT OF ENTRY, OR WHILE MARKETS ARE CONSOLIDATING nor in the middle of an active trend.
Now for the second most used method:
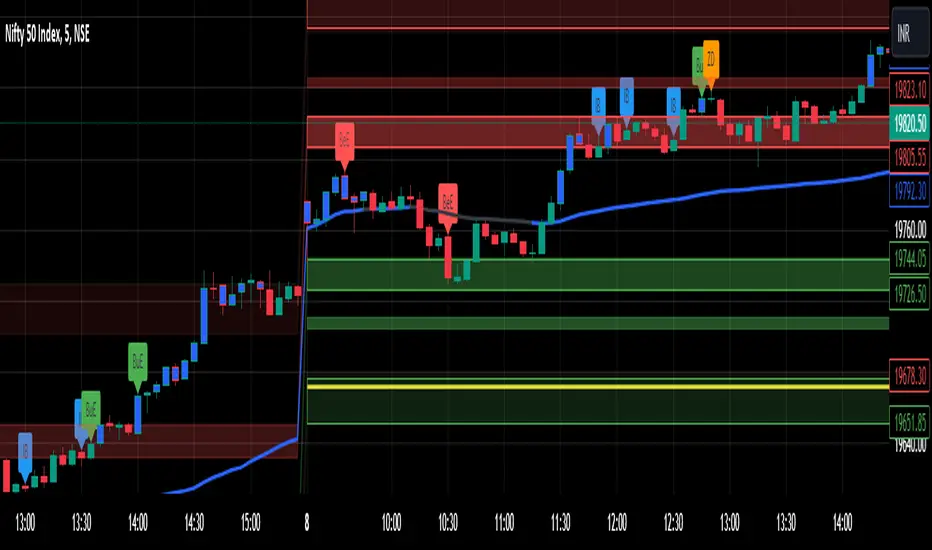
Use The Fibonacci together with the Engulfing Pattern Alerts
First, Identify an impulse candle that creates a new trend in the market.
Then Draw out your Fibonacci tool from the start of the candle to the end of the impulse leg where rejection is shown.
Wait for the price to retrace to the 61.8 retracement and use the engulfing candle as a second confirmation.
And lastly, wait for the price to retest the fib level showing signs of rejection, then enter.
Appendix 2:
Technical Description:
The "Engulfing Pattern Alerts By PropFirm Algo" script is a sophisticated tool designed to identify and alert traders of potential bullish and bearish engulfing patterns in the market, enhanced by trend and volume filters for improved accuracy. This script helps traders spot potential trend reversals by analyzing candlestick patterns in conjunction with volume data and moving averages.
Key Features:
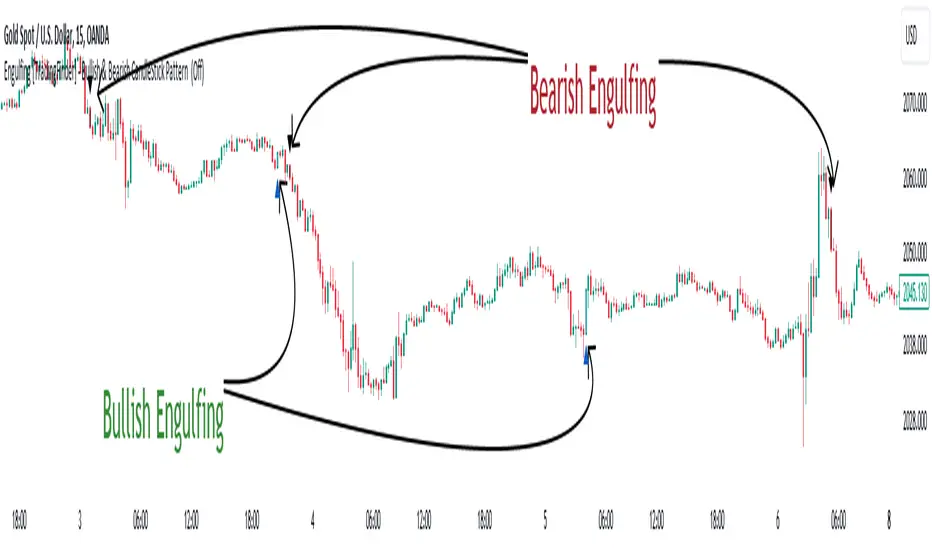
Bullish Engulfing Pattern Detection: Identifies when a smaller bearish candle is followed by a larger bullish candle, indicating potential upward price movement.
Bearish Engulfing Pattern Detection: Identifies when a smaller bullish candle is followed by a larger bearish candle, indicating potential downward price movement.
Volume Filter: Enhances pattern reliability by ensuring the identified pattern is accompanied by a significant volume increase.
Trend Filter: Utilizes Simple Moving Averages (SMA) to filter patterns based on the prevailing market trend, reducing false signals on the "Filtered Engulfing Alerts" Setting.
Custom Alerts: Configurable alerts for both bullish and bearish engulfing patterns, allowing traders to stay informed in real-time.
How It Works:
Bullish Engulfing Pattern:
Detected when the body of the current candle completely engulfs the body of the previous candle.
Confirmed if the current candle closes higher than it opens, and the previous candle closes lower than it opens.
Volume on the current candle must be greater than the previous candle.
Bearish Engulfing Pattern:
Detected when the body of the current candle completely engulfs the body of the previous candle.
Confirmed if the current candle closes lower than it opens, and the previous candle closes higher than it opens.
Volume on the current candle must be greater than the previous candle.
Trend Filter:
Uses moving averages to determine the market trend.
Bullish patterns are only considered in downtrends.
Bearish patterns are only considered in uptrends.
Alerts:
Alerts can be set up for both bullish and bearish patterns, ensuring you are notified when significant market movements are detected.
How to Use:
Add the script to your chart.
Configure the alert settings according to your trading preferences.
Monitor your chart for plotted symbols indicating potential bullish (︽) and bearish (︾) engulfing patterns.
Utilize the alert conditions to get notified when these patterns occur.
Penunjuk Pine Script®