Extended Recursive Bands - Maximum Efficiency With Extra OptionsIntroducing A New Calculation For Efficient Bands Calculation !
Here it is ! The Recursive Bands Indicator, an indicator specially created to be extremely efficient, i think you already know that calculation time is extra important in algorithmic trading, and this is the principal motivation for the creation of the proposed indicator. Originally described in my paper "Pierrefeu, Alex (2019): Recursive Bands - A New Indicator For Technical Analysis" , the indicator framework has been widely used in my previous uploaded indicators, however it would have been a shame to not upload it, however user experience being a major concern for me, i decided to add extra options, which explain the term "extended".
On The Indicator Calculation
You can skip this part if it doesn't interest you. The calculation of the indicator is based on recursion, but i want to explain the mathematical formula described in the paper.
I've seen some users trying to remake it from the calculations, however there was always something weird, and i understand, mathematical notations are always a bit weird, even myself don't always write them correctly/understand them, however this one is relatively simple to understand.
First lets explain each elements of the calculation :
α = smoothing constant, or 2/(length+1)
max/min = maximum and minimum function, max return the greatest input value while min return the lowest one, for example :
max(4,2) = 4 while min(4,2) = 2
the "||" notation mean taking the absolute value, for example : |-1| = abs(-1) = 1
The calculation after the max/min function is called the correction factor, and is the core of the indicator. The last two variables are just here to provide an initial value for upper and lower, basically when we start our calculations we will assign the value of the closing price for upper and lower.
The motivation behind using a smoothing constant in range of (0,1) was to tell the reader that the indicator is easily made adaptive, this is what i did on my adaptive trailing stop indicator by using the efficiency ratio as smoothing variable, the user can use 1/length instead of the provided calculation for alpha.
If you interested on the indicator main logic, it is actually really simple, by using upper = max(price,upper) and lower = min(price,lower) we would get the maximum/minimum price value at time t , therefore upper can only be greater or equal than its precedent value, while lower can only be lower or equal than its precedent value, in order to fix that we subtract/sum upper/lower with a value, this allow the upper band to be lower than its precedent value and lower to be greater than its precedent value, this is the role of the correction factor.
The Indicator
The indicator display one upper and one lower band, every common usages applied to bands indicators such as support/resistance, breakout, trailing stop...etc, can also be applied to this one. length control how reactive the bands are, higher values of length will make the bands cross the price less often.
In order to provide more flexibility for the user i added the option to use various methods for the calculation of the indicator, therefore the indicator can use the average true range, standard deviation, average high-low range, and one totally exclusive method specially designed for this indicator.
Classic Method
This option make the indicator use its classical calculation, this is the most efficient method of all.
Atr Method (atr)
This method use the average true range as correction factor, notice that lower values of length can still produce wide band.
Standard Deviation Method (stdev)
This method use a biased estimate of the standard deviation as correction factor.
The method produce smoother bands that converge more slowly toward the price in comparison with the classic correction factor.
Average High-Low Range Method (ahlr)
This method use the average of the high-low range as correction factor, extremely similar to the average true range.
Rising Falling Volatility (rfv) Method
A new method created for this indicator, this correction factor use the absolute prices changes when price value is greater/lower than any length past values of the price, this allow to have more boxy shaped bands, work best with greater values of length.
The bands can be in contact with this method, a possible fix in the future.
Conclusion
The recursive band indicator is one of my greatest indicators in my opinion (i would love to have yours), as you can see the idea behind it is extremely simple and allow for a super efficient band indicator, which was the original motivation behind it, in order to provide more fun for the users i also added more option for the correction factor, this allow the user to be creative and not get stuck with the original calculation.
Like the trend step indicator family we have almost ended our series on the recursive band framework, 1 more trailing stop will be added in the future, and then we'll have more "boring" stuff until i find something cool again, it shouldn't be long ;)
Thanks for reading !
Envelope (ENV)

Smart Envelope - Running Away From The TrendIntroduction
Envelopes indicators consist in displaying one upper and one lower extremity on the price chart. They are most of the time built by adding/subtracting a volatility estimator (rolling stdev, atr, range...etc) to a central tendency estimator (SMA, EMA, LSMA...etc) . Their interpretation is often subject to debate amongst technical analyst, some will use a support and resistance methodology, where price will start a downtrend once it cross the upper extremity, and a down trend once it cross the lower one. Others will prefer a breakout methodology, where price will reach higher highs once it cross the upper extremity, and lower lows when it cross the lower one. Because of price non stationarity its hard to select the best methodology, the support and resistance one will mostly work on ranging markets, while the breakout methodology mostly work on trending ones.
Therefore new methods where proposed, instead of using moving averages with a high lag, faster filters where used, such as the least squares moving average or zero lag exponential moving average, other band indicators where also created using adaptive filters, but improvements remain relatively low. The most difficult task would be to make extremities with the ability to return accurate support and resistances levels, and today i want to provide a new way to construct such extremities by using the recursive bands framework that allow extremely creative and efficient indicators.
The Main Idea
With classical bands indicators, the upper and lower extremity will still be correlated with the main trend, the problem behind such method is that we can't use a support and resistance methodology with trending markets, the fact that reversals exist tells us that our extremities will always be crossed by the main trend, here is an example :
Here the support is correlated with the main trend, in order for it to be accurate we must assume the trend will go on for ever, and will only detect higher lows, this is what we expect with the orange line, but we can see that a severe down trend totally destroy our plan.
In short we need to give some headroom to our extremities, and thus one extremity can't be correlated with the main trend.
The proposed Indicator
We want to minimize the correlation between the extremities, so if the upper extremity rise, the lower one must fall. This allow to give some headroom and allow the user to anticipate larger movements, this is how bands seeking to give support and resistances points should work.
The indicator has a length setting that control the wideness of the extremities, unlike other indicators low values such as 14 can still create really wide bands, take that into account.
length = 5. Lower length values allow for more motion from the extremities, but does not necessarily involve detecting shorter terms support and resistances levels. The factor setting is not that important, but it allow to return extremities with more motion when high, and really wide bands when below 1 and greater than 0.
Central Tendency Estimator
Something fun with the recursive band framework is that the bands are no longer based on the central tendency estimator but its the central tendency estimator who is based on the bands. The central tendency estimator can also provide support and resistances points with the price, like classical moving averages, altho its lack of motion is this time a downside.
Conclusion
Altho the extremities are more accurate than other band indicators, the problem remain the same, larger trend will always break the extremities and continue creating higher/lower highs/lows, at this point our stop loss would certainly be triggered. This is a huge downsides of contrarian strategy, we sure might anticipate reversals earlier, but we are exposed to larger price movements, therefore the risk is extreme.
But the proposed methodology might still prove useful to develop more robust support and resistances levels based on envelopes indicators.
Thanks for reading !

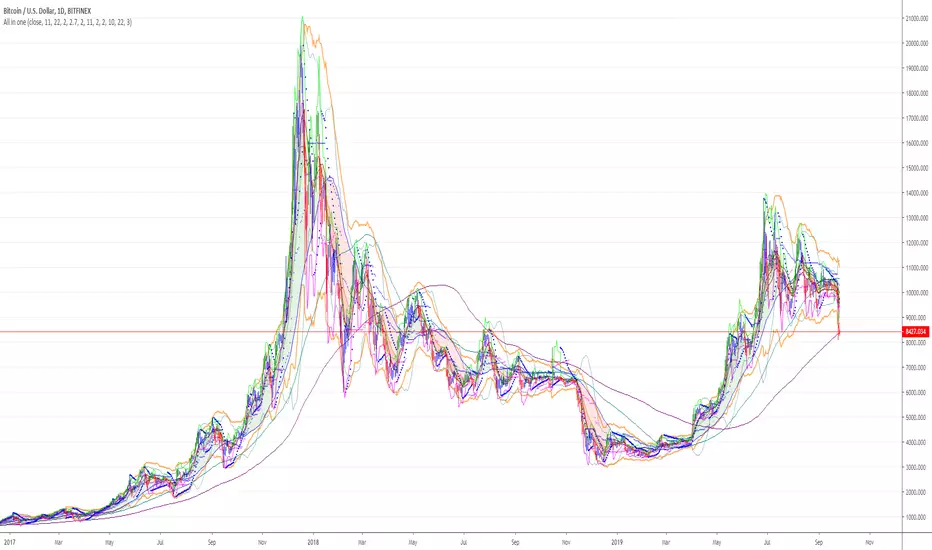
ENVELOPE BOLLINGER KELTN IMPULSE EMA SMA SAFEZONE SAR CHANDELIERALL THIS ALL IN ONE!
there are many options to check or uncheck to show only the tool that you need at that particular moment.
ENJOY!
ENVELOPE BOLLINGER KELTNER IMPULSE EMA SMA SAFEZONE SAR CHANDELIER
Bands-Trailing Stop UtilityIntroduction
Bands and trailing stops are important indicators in technical analysis, while we could think that both are different they can be in fact closely related, at least in the way they are made. Bands and trailing stops can be made from a simple central tendency estimator, like a moving average, and from a volatility estimator like standard deviation, atr...etc.
This is why i propose this utility that allow you to make bands and trailing stops from any indicator in the price chart.
How To Use
All you have to do is select the indicator you want to make bands from in the settings, so just open the Bands-Trailing Stop Utility indicator settings and select your indicator in "Source". Make sure your source indicator is not in "hide" mode.
For example here i'am using a moving average as source for the indicator. Mult control how spread the bands are from each others, by default mult = 1, if we use mult = 2 we get :
Mult can be non-integer as well as lower than 1 (when lower than 1 the bands would be closer to each others)
Error/Volatility Estimators
You can choose from a wide variety of volatility estimators, select the estimator from the "Method" scrolling parameter in settings, by default the indicator will use the running mean absolute error (MAE) which don't use length. Other estimators use length, making length = to the period of the source indicator can help get better results.
The root moving averaged squared error (RMASE) is just the square root of the simple moving average of the squared difference between the closing price and the source indicator. length control the period of the moving average of RMASE.
You can also use the average true range with period length. It might work better with low lagging moving averages.
The range is simply the difference between the highest and lowest over length periods of the source indicator.
Stdev is simply the price running standard deviation.
Trailing Stop
When the trailing stop mode is checked the bands will be replaced by a trailing stop, the trailing stop will still depend on every settings of the indicator like mult/volatility estimator...etc.
Conclusion
You might find an use to this tool if you want to make bands/trailing stops from pretty much everything. The indicator used as source for the examples is a smooth exponential averager that i could share if i see interest from peoples.
Thanks for reading !

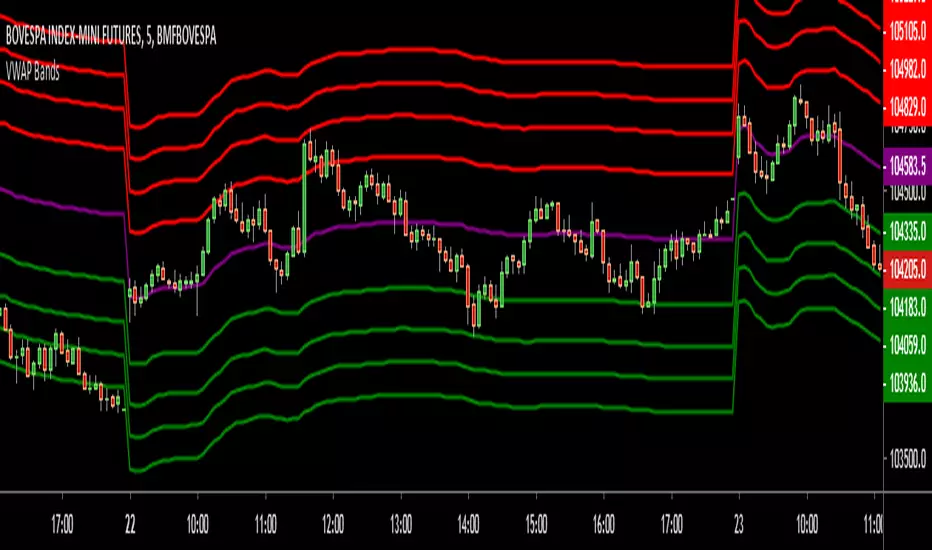
VWAP BandsThis indicator plots distant VWAP lines that serve as support and resistance. You can add more lines from the script.
Good trades!

Volume Adaptive BandsIntroduction
I have been asked by @Coppermine and @Verbena to make bands that use volume to provide adaptive results. My first approach was to use exponential averaging, in order to do so i needed to quantify volume movement using rescaling with the objective to make the bands go away from each others when there is low volume, this approach is efficient and can work on any time frame, however i decided at the end to use another method which rely on recursive weighting, cleaner but more parametric. Those bands aim to highlight great breakouts point to go with the trend.
The Indicator
length control the period of the moving averages used in the script, however low length's don't necessarily provide indications for shorter terms breakouts as shown here :
As i said the bands are close to each others when there is high volume and away when there is low volumes.
Low volume period, bands will avoid to cross price
High volume, bands will be close to generate signals.
Correction Factor
Higher time frames will lower the distance between each band, this is because volume is higher during higher time frames, remember that the indicator bands are close to each others when volume is high.
1h chart eurusd.
This is why i added a correction factor, this factor can help you control the distance between each bands, when the correction factor is greater than 1 the bands will be closer to each others, this is useful for low time frames where the average volume is lower. When the time frame is high, use values between 0 and 1 to increase distance between each bands.
Correction factor = 0.2
Conclusion
I presented a new adaptive band indicator that adapt to trading volume by using recursive weighting, volume can be replaced by other indicators but you can have results going nuts, at the end its about experimentation. I hope you will find an use to it, thanks to @Coppermine and @Verbena for the request :)
Thanks for reading !


Elder AutoEnvelopeReference: Transcription of script taken from TC2000 - forums.worden.com
Please let me know if you want me to change the script in anyway, or add new features

clouded pastSearch indicators for "clouded" to find this one, and add to your chart.
Takes lowest(min) and highest(max) of several bars,
averages that over several bars,
shifts by half of the middle of those two bar numbers,
and colors the inbetween by candle color.
You can choose 3 parameters.
Please give feedback, or donation.
Thanks.


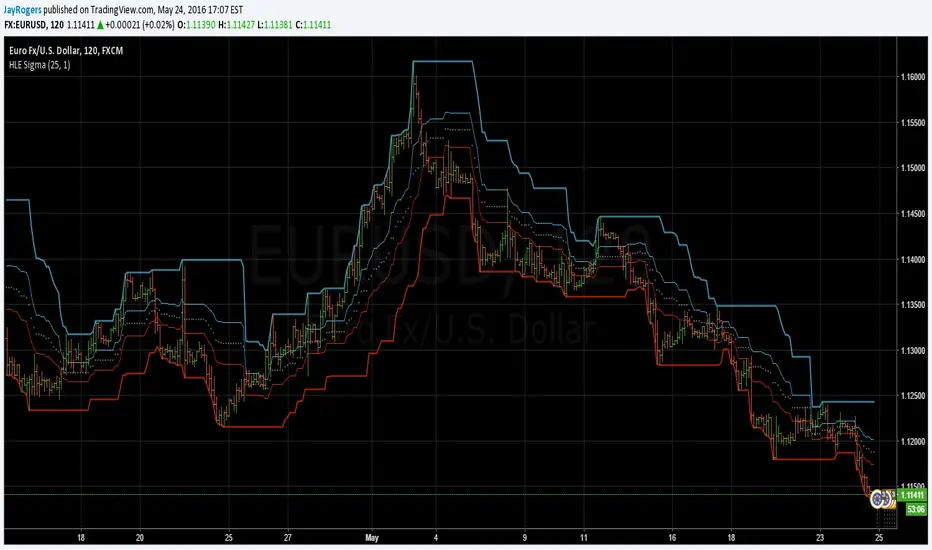
High Low Envelope SigmaDescription:
High and Low Envelope channel with median line and 'sigma' offsets to try and encapsulate price flow and quickly locate likely areas of support and resistance on the fly.
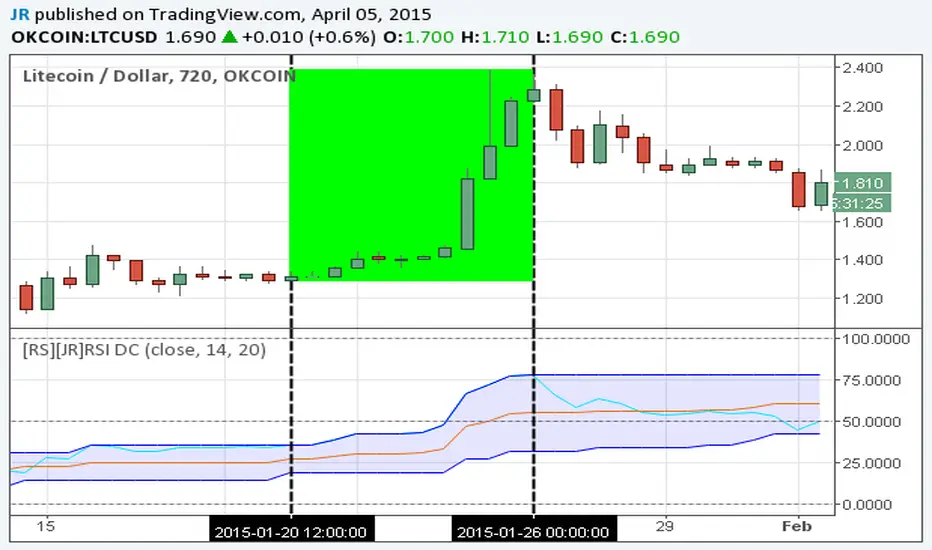
[RS][JR]RSI Donchian ChannelsRSI Donchian Channels
Built by Ricardo and JR
Here is a great indicator to use for strong trends. Donchian Channels react immediately to changes in the highest high and lowest low. For strong trends you want to trade when RSI is set along the upper or lower DC-RSI envelope. When the RSI releases from the DC-RSI envelope, you can take the trade off.
DEnvelope [Better Bollinger Bands]*** ***
Bollinger Bands (BB) usually expand quickly after a volatility increase but contract more slowly as volatility declines. This extended time it takes for BB to contract after a volatility drop can make trading some instruments using BB alone difficult or less profitable.
In the October 1998 issue of "Futures" there is an article written by Dennis McNicholl called "Better Bollinger Bands", in which the author recommends improving BB by modifying:
- the center line formula &
- different equations for calculating the bands.
These bands, called "DEnvelope", follow price more closely and respond faster to changes in volatility with these modifications.
Fore more indicators, check out my "Master Index of indicators" (Also check my published charts page for new ones I haven't added to that list):
More scripts related to DEnvelope:
------------------------------------------------
- DEnvelope Bandwidth: pastebin.com
- DEnvelope %B : pastebin.com
Sample chart with above indicators: www.tradingview.com
