Overlay Indicators (EMAs, SMAs, Ichimoku & Bollinger Bands)This is a combination of popular overlay indicators that are used for dynamic support and resistance, trade targets and trend strength.
Included are:
-> 6 Exponential Moving Averages
-> 6 Simple Moving Averages
-> Ichimoku Cloud
-> Bollinger Bands
-> There is also a weekend background marker ideal for cryptocurrency trading
Using all these indicators in conjunction with each other provide great confluence and confidence in trades and price targets.
An explanation of each indicator is listed below.
What Is an Exponential Moving Average (EMA)?
"An exponential moving average (EMA) is a type of moving average (MA) that places a greater weight and significance on the most recent data points. The exponential moving average is also referred to as the exponentially weighted moving average. An exponentially weighted moving average reacts more significantly to recent price changes than a simple moving average (SMA), which applies an equal weight to all observations in the period.
What Does the Exponential Moving Average Tell You?
The 12- and 26-day exponential moving averages (EMAs) are often the most quoted and analyzed short-term averages. The 12- and 26-day are used to create indicators like the moving average convergence divergence (MACD) and the percentage price oscillator (PPO). In general, the 50- and 200-day EMAs are used as indicators for long-term trends. When a stock price crosses its 200-day moving average, it is a technical signal that a reversal has occurred.
Traders who employ technical analysis find moving averages very useful and insightful when applied correctly. However, they also realize that these signals can create havoc when used improperly or misinterpreted. All the moving averages commonly used in technical analysis are, by their very nature, lagging indicators."
Source: www.investopedia.com
Popular EMA lookback periods include fibonacci numbers and round numbers such as the 100 or 200. The default values of the EMAs in this indicator are the most widely used, specifically for cryptocurrency but they also work very well with traditional.
EMAs are normally used in conjunction with Simple Moving Averages.
" What Is Simple Moving Average (SMA)?
A simple moving average (SMA) calculates the average of a selected range of prices, usually closing prices, by the number of periods in that range.
Simple Moving Average vs. Exponential Moving Average
The major difference between an exponential moving average (EMA) and a simple moving average is the sensitivity each one shows to changes in the data used in its calculation. More specifically, the EMA gives a higher weighting to recent prices, while the SMA assigns an equal weighting to all values."
Source: www.investopedia.com
In this indicator, I've included 6 popular moving averages that are commonly used. Most traders will find specific settings for their own personal trading style.
Along with the EMA and SMA, another indicator that is good for finding confluence between these two is the Ichimoku Cloud.
" What is the Ichimoku Cloud?
The Ichimoku Cloud is a collection of technical indicators that show support and resistance levels, as well as momentum and trend direction. It does this by taking multiple averages and plotting them on the chart. It also uses these figures to compute a "cloud" which attempts to forecast where the price may find support or resistance in the future.
The Ichimoku cloud was developed by Goichi Hosoda, a Japanese journalist, and published in the late 1960s.1 It provides more data points than the standard candlestick chart. While it seems complicated at first glance, those familiar with how to read the charts often find it easy to understand with well-defined trading signals."
More info can be seen here: www.investopedia.com
I have changed the default settings on the Ichimoku to suit cryptocurrency trading (as cryptocurrency is usually fast and thus require slightly longer lookbacks) to 20 60 120 30.
Along with the Ichimoku, I like to use Bollinger Bands to not only find confluence for support and resistance but for price discovery targets and trend strength.
" What Is a Bollinger Band®?
A Bollinger Band® is a technical analysis tool defined by a set of trendlines plotted two standard deviations (positively and negatively) away from a simple moving average (SMA) of a security's price, but which can be adjusted to user preferences.
Bollinger Bands® were developed and copyrighted by famous technical trader John Bollinger, designed to discover opportunities that give investors a higher probability of properly identifying when an asset is oversold or overbought."
This article goes into great detail of the complexities of using the Bollinger band and how to use it.
=======
This indicator combines all these powerful indicators into one so that it is easier to input different settings, turn specific tools on or off and can be easily customised.
Exponential

Multi_TF_EMAMultiple TimeFrame EMA
In a single indicator, up to 6 EMAs can be displayed in 6 different time frames.
En un solo indicador se puede visualizar hasta 6 EMAs en diferentes TImeFrames.
Rainbow Trend IndicatorThis is an indicator based on the MA rainbow concept. It is possible to choose between 15 or 20 MA's and if all 15 MA's is picked, the calculation will be calculated on 15 MA's and if 20 is picked the calculation is calculated on 20 MA's. The indicator will then be a line which is assigned a value from the calculation based on the MA's. If the line is above the dashed zero line, meaning the line's last value is a positive value, the price is in a uptrend and if the line is below the dashed zero line, meaning the line's last value is a negative value, the price is in a downtrend.
In short
If the line is green, the price is in a uptrend. If the line is red, the price is in a downtrend.

Exponential Deviation Bands Width [ChuckBanger]This indicator is a compliment to Exponential Deviation Bands . It is the difference between the upper and the lower bands divided by the middle band. It is an easy way to visualize consolidation before price movements or periods of higher volatility.
How it works
During a period of high volatility, the distance between the two bands will widen and Exponential Deviation Bands width will increase. And the opposite occurs during a period of low volatility, the distance between the two bands will contract and Exponential Deviation Bands width will decrease. Meaning there is a tendency for bands to alternate between expansion and contraction.
When the bands are relatively far apart, that is often is a sign that the current trend is ending. When the distance between the two bands is relatively narrow that often is a sign that the market is about to initiate a bigger move in either direction.


Daily Moving Averages on Intraday ChartsPrints exponential 8, 21, 50, 100 and 200-day moving averages on intraday charts. For example, if you are on a 5 minute chart, you will see a magenta "X" making the current value of the 8-day EMA with an "8" label above it.
This is NOT a Strat script and it follows more closely the way Scott Redler from T3Live looks at charts. If you acknowledge that the vast majority of the time, price does have some sort of reaction to these daily EMAs (whether just a short relative pause or the beginning of a reversal), this script may be helpful.
The Strat and Rob Smith DO NOT support the use of moving averages. This adds more data to your chart which you may or may not find extraneous.

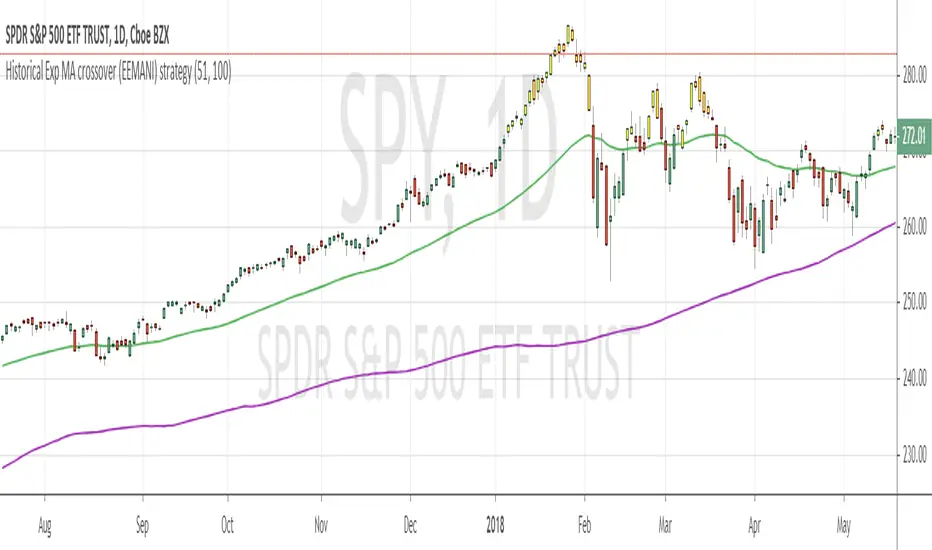
Historical Exp MA crossover (EEMANI) strategyThis strategy is based on exponential moving average.
I was doing some research on when price extended too far from moving averages / exponential moving averages , ended up with this idea.
LONG RULE
when Exponential MA cross over the historical Exponential MA
EXIT RULE
when Exponential MA cross down the historical Exponential MA
Take Profit
if you check take profit parameter , strategy marks the bars in yellow color when it reaches 30% profit
Example:
I have tested this strategy with SPY , which showed best results with Exp MA = 51 and Historical Exp MA = 100
which has 71% win ratio and High profit factor low max draw down . especially Max Loss on any taken trade is less than 5%
Though price movement looks ugly on the chart , ultimately trade closes with decent profit / minimal loss
Note : past performance is not necessarily indicative of future results, please do your research and back test
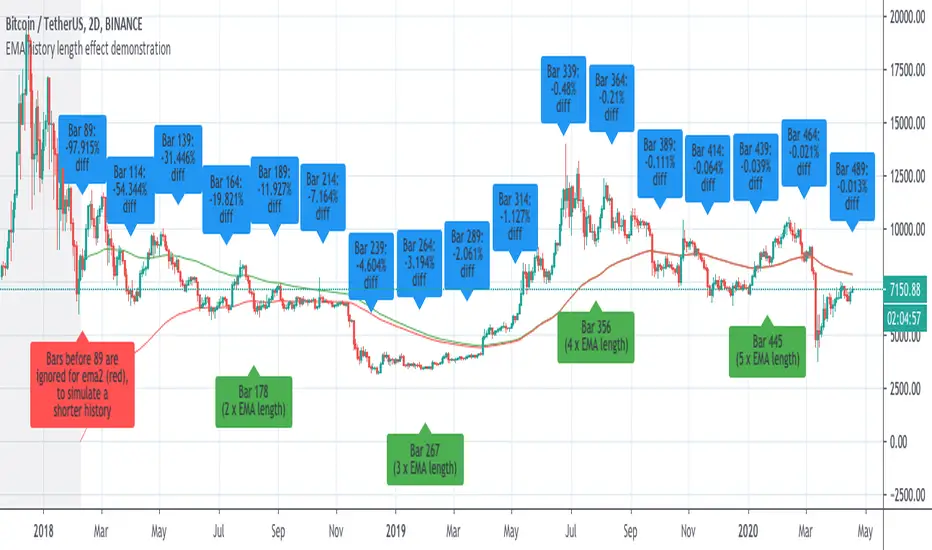
Demonstration of how history length affects all EMA valuesI saw some discussion of this so I whipped up an example to prove the that effect of history length on EMA values is pronounced, even for bars much further than the EMA length from the first candle of the chart.
This chart has two 89-bar EMAs of the close: a green one and a red one. However, for the red one, the first 89 bars of the graph are considered to have a close of "0", which is exactly whatTradingView's EMA calculation uses for bars before the start of the graph.
This is because unlike other moving averages, which reference the price of previous bars, the EMA references the EMA of previous bars. Therefore, bars closer to the beginning of the chart, where TradingView can't calculate an EMA because there is no previous EMA and therefore uses 0, will return substantially different values for the EMA() function that the same cart would with more history.
The further a bar is back in history, the less influence it has. However, every single historical bar has some influence on the EMA of every later bar.
To allow you to see this for yourself, this script contains the following inputs which you can change to see the effect:
-EMA period (default 89)
-Number of bars to ignore for EMA2 (default 89)
-decimal precision to show differences in. By making this a large number you can see that, although the effects diminish, history length affects all EMA values for the char.
-label spacing (increase this if you have a long history and run into TV's 50-label limit)
6 Moving Averages with MTF v1.0This indicator is a collection of 6 different period Moving Averages. It has support for different time-frame resolution for all of them individually.
Also, it has 11 different type of Moving Average calculation functions:
1. Simple Moving Average (SMA)
2. Exponential Moving Average (EMA)
3. Weighted Moving Average (WMA)
4. Volume Weighted Moving Average (VWMA)
5. Smoothed Moving Average (SMMA)
6. Double Exponential Moving Average (DEMA)
7. Triple Exponential Moving Average (TEMA)
8. Hull WMA Moving Average (HullMA)
9. Triangular Moving Average (TMA)
10. Super Smoother Moving Average (SSMA)
11. Zero Lag Exponential Moving Average (ZEMA)
Note: The Moving Average calculation function is adapted from @JustUncleL
Happy trading 😉
Thank you.

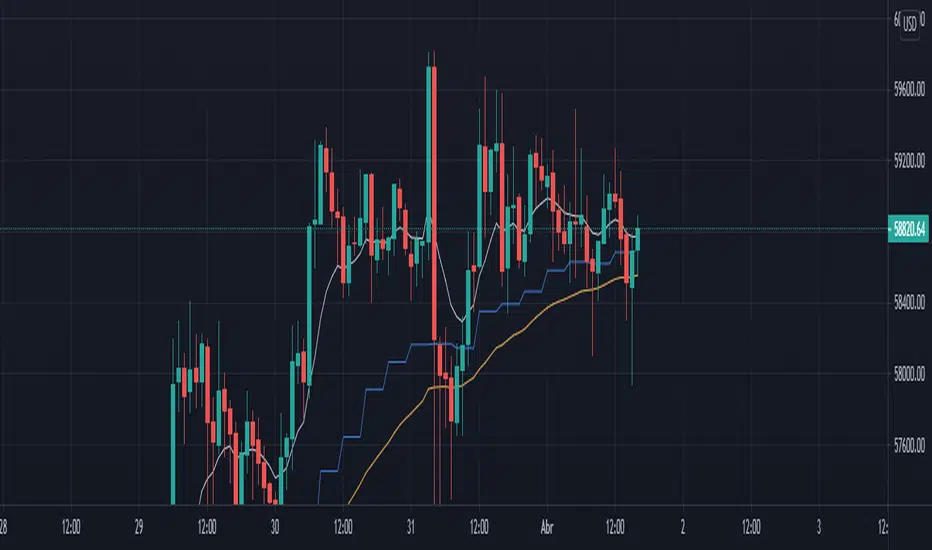
Bollinger Bands Ema 50,200,800EMAs converted to Bollinger Bands The bands are 50, 200 and 800 period, forming a strategy and having clear trends and stronger supports and resistances (when the lines converge the area is stronger).
RSI background by AvesTradingHello,
This is RSI indicator that shows background color, when proper levels reached, instead of line in another pane. Customizable options are available:
- source
- length
- overbought level
- oversold level
I have added as well RMA of RSI for extra confirmation if needed. I hope you enjoy and will leave me some feedback! Don't forget to follow me for new releases.
Cheers
Aves
Please remember that the indicators provided by me are for educational purposes only.

Bitcoin Power Law CorridorOpen-source live tracker of Harold Burger's Bitcoin "Power Law Corridor".
Added optional chart fill and labels to show the percentage delta to the regression center-line, support and resistance.

EMA High-Low ChannelThe channel is of High and low using EMA, so it is easily to track and see higher high when prices is breaking above channel. same is vice-versa when price is breaking below channel.


Alpha-Decreasing Exponential Moving AverageThe alpha parameter of this moving average decreases with every new bar on the chart, so it will become more slowly and slowly in course of time. Can act like additional support/resistance line but works in an acceptable way on weekly and monthly timeframes only.

EMA 21,13,8 - scalping3 EMAs will help identify and predict uptrends and downtrends
-If EMAs are all above the candles it a sign to sell & if the EMAs are below its a sign to buy
- If the Green-8 EMA crosses or touches red candle then flips under the other EMAs & candles then it's time to sell
-If the Green-8 EMA crosses or touches green candle then flips above the other EMAs & candles then it's time to buy
- how far is the EMAs from the candle it'll show how strong the trend. combine this strategy with the stochastic oscillator & RSI to get the maximum benefit


4 Fibonacci EMAsAdd 4 Fibonacci EMAs to your charts with one indicator.
Configureable by value, so they don't necessarily have to use Fibonacci numbers, and by colors.

AntiRekt RibbonThis script is a fork of the Madrid Ribbon, the only difference is that you can color your bars depending on the trend.

Volume (Incremental) Weighted VOLATILITY BANDSDISCLAIMER:
The Following indicator/code IS NOT intended to be a formal investment advice or recommendation by the author, nor should be construed as such. Users will be fully responsible by their use regarding their own trading vehicles/assets.
The following indicator was made for NON LUCRATIVE ACTIVITIES and must remain as is following TradingView's regulations. Use of indicator and their code are published by Invitation Only for work and knowledge sharing. All access granted over it, their use, copy or re-use should mention authorship(s) and origin(s).
WARNING NOTICE!
THE INCLUDED FUNCTION MUST BE CONSIDERED AS TESTING. The models included in the indicator have been taken from openly sources on the web, problems could occur at diverse data sceneries.
WHAT'S THIS...?
Work derived by previous own research for study:
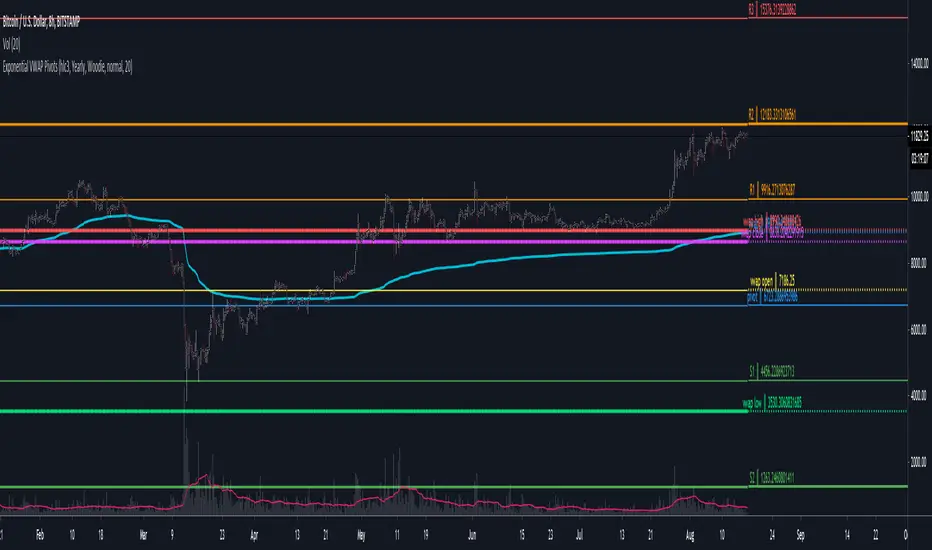
The given indicator is another VWAP analysis tool that contains openly procedures for rolling out time sessions as in other TradingView scripts .
Some novelties are introduced in this version:
INCREMENTAL WEIGHTED STANDARD DEVIATION BANDS: The calculation on this script are strictly based in regard of University of Cambridge Computing Service, February 2009 paper by Tony Finch publicly found at people.ds.cam.ac.uk .
From the Abstract, he explain how to derive formulae for numerically stable calculation of the mean and standard deviation, which are also suitable for incremental on-line calculation. Then he generalize these formulae to weighted means and standard deviations. He unpick the difficulties that arise when generalizing further to normalized weights. Finally he shown that the exponentially weighted moving average is a special case of the incremental normalized weighted mean formula, and derive a formula for the exponentially weighted moving standard deviation.
VOLUME WEIGHTED VOLATILITY ADAPTIVE MOVING AVERAGE & BANDS: Taking the INCREMENTAL WEIGHTED STANDARD DEVIATION already described and taking a specified anchor or Rolling procedure for a VWAP, I derive the variance against the price to use it as VOLATILITY PROXY for a normalization lambda to plot a First Order Impulse Response Filter or Adaptive Average . This idea have it's roots derived from Chaiyuth Padungsaksawasdi & Robert T. Daigler paper entitled "Volume weighted volatility: empirical evidence for a new realised volatility measure".
NOTES:
This version DO NOT INCLUDE ALERTS.
This version DO NOT INCLUDE STRATEGY: Feedback are welcome.
DERIVED WORK:
Incremental calculation of weighted mean and variance by Tony Finch (fanf2@cam.ac.uk) (dot@dotat.at), 2009.
Volume weighted volatility: empirical evidence for a new realised volatility measure by Chaiyuth Padungsaksawasdi & Robert T. Daigler, 2018.
Multi-Timeframe VWAP by TradingView user @mortdiggidi
CHEERS!
@XeL_Arjona 2019.

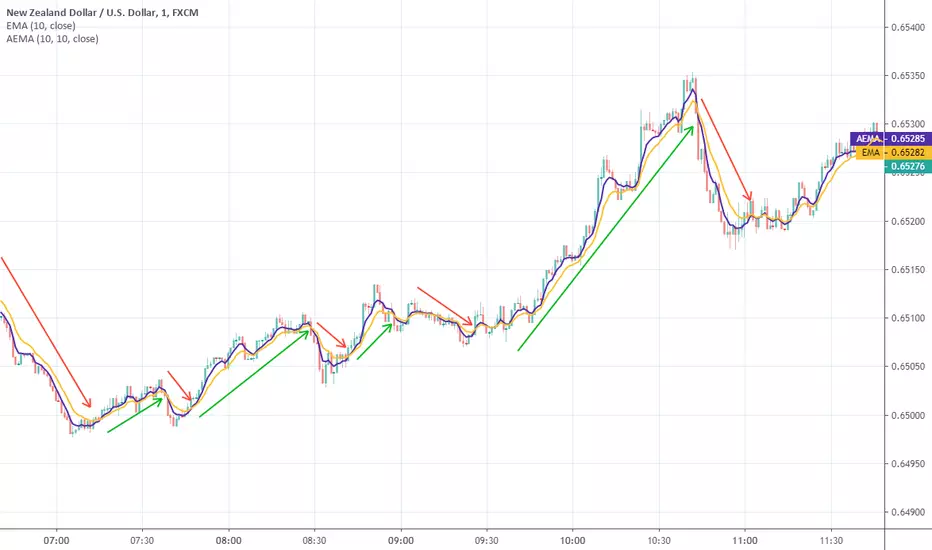
Adaptive Exponential Moving AverageThis indicator was originally developed by Vitali Apirine (Stocks & Commodities V. 37:5 (April, 2019): Adaptive Exponential Moving Average ).
This is his second modification of Kaufman Moving Average. In essence, the idea remains the same as in the previous ( ): the smoothing constant is calculated as a special ratio between the current price and highest/lowest prices for a given period.
In combination with EMA you can obtain a trading system based on double crossovers:
Long , when AEMA crosses up EMA
Short , when AEMA crosses down EMA
Source code on request