Multiple EMAs [CryptoFuturo]Enjoy viewing multiple Exponential Moving Averages (EMA) on your chart? Want to use only one indicator to display up to 5 EMAs? Then you've come to the right place!
FEATURES:
Configure and use up to 5 Exponential Moving Averages (EMA) using a single indicator.
Default lengths for the 5 EMAs are 10, 20, 50, 100, 200.
Length values, plot line colors and source data are all configurable.
Exponential

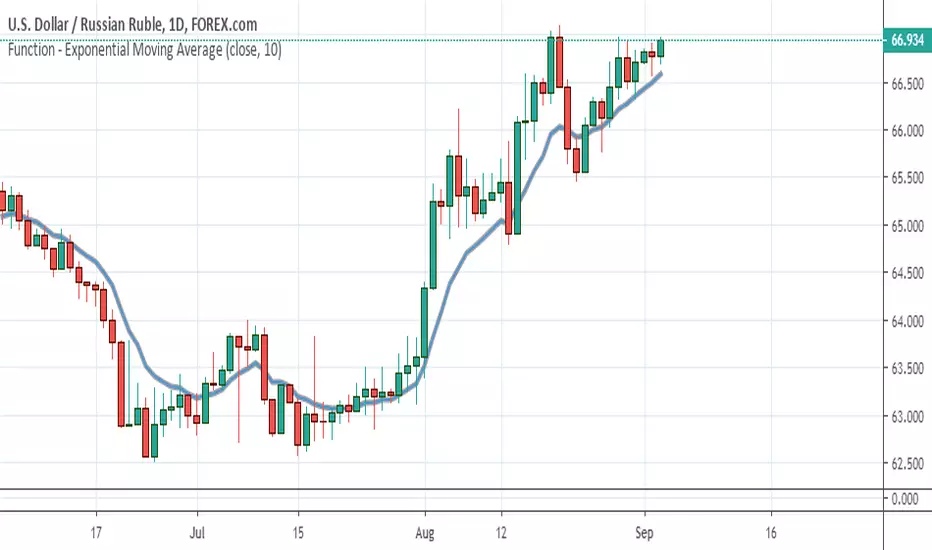
XPloRR MA-Buy ATR-Trailing-Stop Long Term Strategy Beating B&HXPloRR MA-Buy ATR-MA-Trailing-Stop Strategy
Long term MA Trailing Stop strategy to beat Buy&Hold strategy
None of the strategies that I tested can beat the long term Buy&Hold strategy. That's the reason why I wrote this strategy.
Purpose: beat Buy&Hold strategy with around 10 trades. 100% capitalize sold trade into new trade.
My buy strategy is triggered by the EMA(blue) crossing over the SMA curve(orange).
My sell strategy is triggered by another EMA(lime) of the close value crossing the trailing stop(green) value.
The trailing stop value(green) is set to a multiple of the ATR(15) value.
ATR(15) is the SMA(15) value of the difference between high and low values.
Every stock has it's own "DNA", so first thing to do is find the right parameters to get the best strategy values voor EMA, SMA and Trailing Stop.
Then keep using these parameter for future buy/sell signals only for that particular stock.
Do the same for other stocks.
Here are the parameters:
Exponential MA: buy trigger when crossing over the SMA value (use values between 11-50)
Simple MA: buy trigger when EMA crosses over the SMA value (use values between 20 and 200)
Stop EMA: sell trigger when Stop EMA of close value crosses under the trailing stop value (use values between 8 and 16)
Trailing Stop #ATR: defines the trailing stop value as a multiple of the ATR(15) value
Example parameters for different stocks (Start capital: 1000, Order=100% of equity, Period 1/1/2005 to now):
BAR(Barco): EMA=11, SMA=82, StopEMA=12, Stop#ATR=9
Buy&HoldProfit: 45.82%, NetProfit: 294.7%, #Trades:8, %Profit:62.5%, ProfitFactor: 12.539
AAPL(Apple): EMA=12, SMA=45, StopEMA=12, Stop#ATR=6
Buy&HoldProfit: 2925.86%, NetProfit: 4035.92%, #Trades:10, %Profit:60%, ProfitFactor: 6.36
BEKB(Bekaert): EMA=12, SMA=42, StopEMA=12, Stop#ATR=7
Buy&HoldProfit: 81.11%, NetProfit: 521.37%, #Trades:10, %Profit:60%, ProfitFactor: 2.617
SOLB(Solvay): EMA=12, SMA=63, StopEMA=11, Stop#ATR=8
Buy&HoldProfit: 43.61%, NetProfit: 151.4%, #Trades:8, %Profit:75%, ProfitFactor: 3.794
PHIA(Philips): EMA=11, SMA=80, StopEMA=8, Stop#ATR=10
Buy&HoldProfit: 56.79%, NetProfit: 198.46%, #Trades:6, %Profit:83.33%, ProfitFactor: 23.07
I am very curious to see the parameters for your stocks and please make suggestions to improve this strategy.

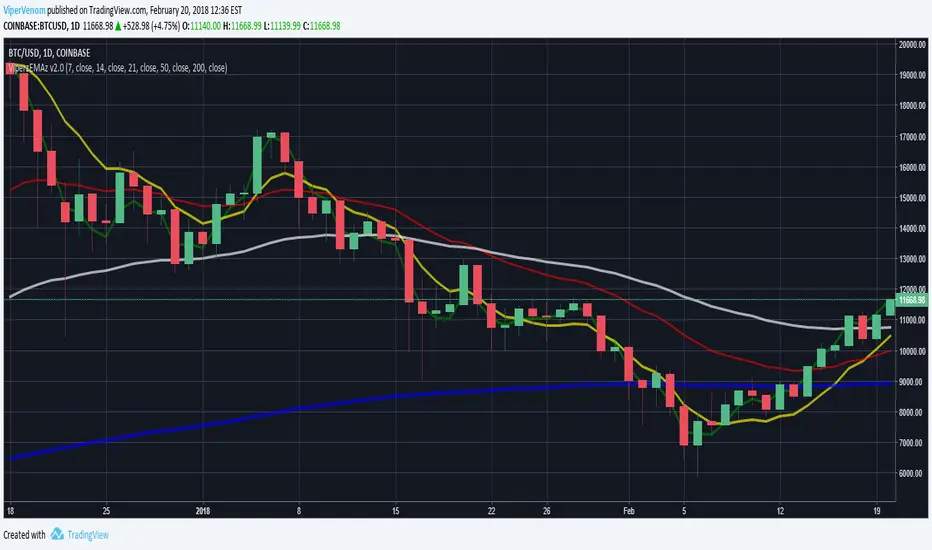
Viperz Super EMA Mix v2.0Hello friends,
Welcome to Viperz Super EMA Mix v2.0!!!
v2.0: Added TEMA source as an input, so the default value can be changed. I also Added a full description of Viperz Super EMA Mix below.
I have created a multi-layered Exponential Moving Average chart indicator, called Viperz Super EMA Mix. This is used to measure momentum of market trends. I had Bitcoin/Crypto trading in mind while creating it. Here is a breakdown of the different moving averages included, their default values and the reasoning behind why they were chosen.
First, we have the most reactive EMA, which is a Triple EMA, or TEMA. The TEMA smooths price fluctuations and filters out more volatility than a traditional EMA. Therefore, I have chosen that as the green line which will be nearest to the current price. I used TEMA here, so it will help filter out some of the noise on the most reactive EMA on this indicator. I have chosen 7 as the default for length, since that is a week. I chose the color green because I am using a stop light theme to make it easy for myself, and hopefully, for others to remember. All you have to remember for color order is Green > Yellow > Red. If the green is above yellow and yellow is above red lines, then current trend is bullish.
Secondly, we have the next most reactive EMA, which is a Double EMA, or DEMA. The DEMA is a fast-acting moving average that is more responsive to market changes than a traditional moving average. The TEMA and DEMA will react with each other the most on the charts, since their default values are nearest each other and use smaller lengths. I chose them to be the first 2 EMAs, in a "reverse order", so that the noise filtering is done slightly more on the shorter EMAs with more volatility. I chose 14 as default on the DEMA, since that is 2 weeks. I choose the color yellow to stick with my stop light theme (green better then yellow better than red).
Third, we have a less reactive regular EMA, set at length 21. This represents 3 weeks and uses the color red. If green and yellow are below the red lines, then the trend is bearish.
Lastly, I included the 50 day and 200 day EMAs, because they very commonly used for Bitcoin trading. I could try to explain it, but they do a better job of explaining why 50 and 200 day EMAs are used if you check this article here: cointelegraph.com
The color chosen for the 50 day was white and 200 day was blue. This is also so it's easy for me to remember (America, red, white and blue). Here is the full color scheme order: Green, Yellow, Red, White, Blue.
*** Just remember traffic lights first on smaller time frames (1 - 4 Hour time frames) and American flag for larger time frames (Daily to Weekly time frames) and you'll be recognizing the color scheme easily at a glance in no time!
If you don't agree on any of the default values I have chosen, then I have made it so you can change the length or source input values to anything you want for each moving average. You can also adjust the coloring and size of the EMA's bands.
If you find different default values that you like and you want me to make a special version for you, please send me a personal message. I appreciate the likes and follows. :)
TLDR: This should be used as a momentum indicator while market trading. The easiest way to remember how to recognize the market trend using my color scheme is to think of a stop light. Green, yellow, then red. The last are red, white and blue, like the American flag. If the order of the colors is green, yellow, red, white, blue, then the market is strongly trending bullish. It is opposite for bearish trend. Traffic lights (green/yellow/red) work the best on smaller time frames (Hourlys) and American flag (red/white/blue) for larger time frames (daily-weekly). All default input values and sources can be changed for each EMA.
Thank you, enjoy!
Simple and Exponential MAAllow moving averages to be displayed without needing to use up multiple charting indicators individually (20, 50, 100, 200, 300 lengths for both EMA and SMA)
Exponential Bollinger Bands [Updated Feb 2018]The same as my previous Exponential Bollinger Bands script, but now you can set a desired offset for the indicator. I have published this as a new script that way those who prefer the old script can continue to use it without seeing any changes.


MultipleEMAA simple indicator used to display several exponential moving average at the same time.
❤ ETH : 0xa3169d9Ed8aC123d2e32D8160492FA8900F7D01D

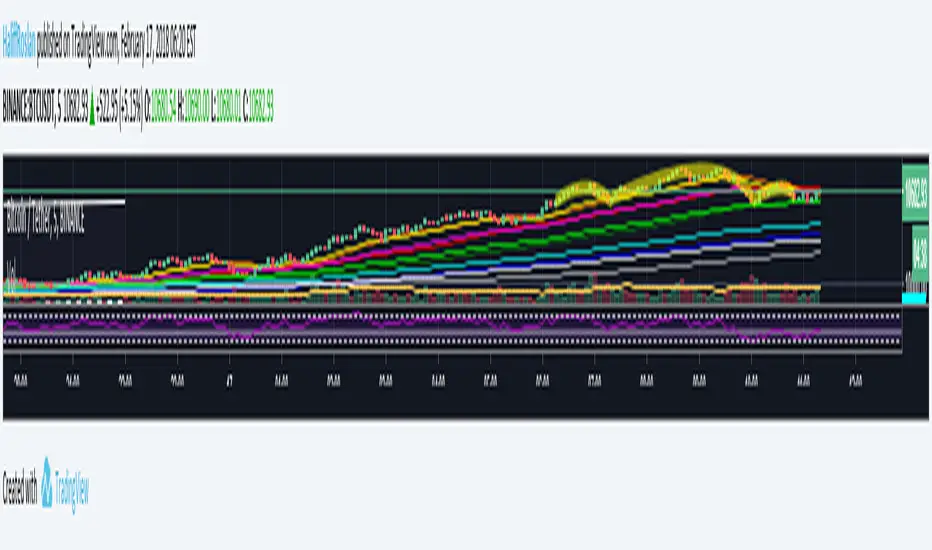
6 Simple Blue & 5 Exponential Yellow Moving Averages6 simple and 5 exponential Moving Averages in one indicator.
I made this because its not always easy to tell what average the price might be bouncing off from when you only have a couple at a time.
For some reason, the defaults aren't working.
To fix this, just open the configuration for the indicator after the first time that you load it.
Then check/uncheck the box and set the time period.
If anyone knows how I can fix this in the code, please let me know.
Blue indicators are simple and the Yellow are exponential.
Thinner more transparent lines are shorter term averages and Thicker lines are longer term averages.
I modeled it after the source of several other scripts which had less averages
4 EMA's in oneAnother useful script I've been experimenting with. 4 EMA's in one!
Red = 200
Orange = 100
Yellow = 50
Blue = 25
Color coded in order of their respective frequencies.
Right now it's as plain and simple as you can get. Only inputs you can change are the average values.
Will update upon request and popularity.
Happy new year and God bless!

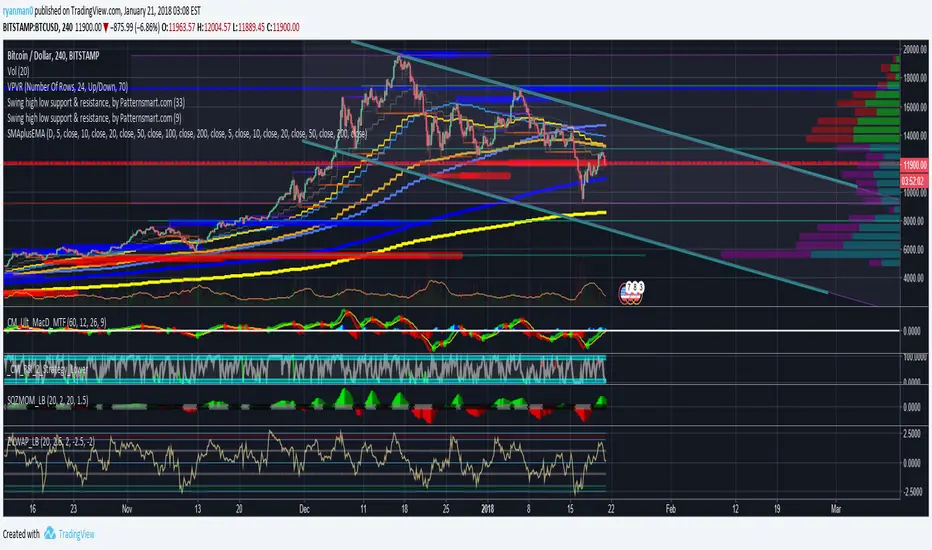
Combo Indicator V2This is an updated version of the Combo Indicator I previously published. It combines Bollinger Bands, 3 moving averages and 1 exponential moving average all into one chart. I use this indicators on most of my charts so wanted an easy way of combining them all.
SPECIAL BONUS
This indicator also includes a common Bollinger Band trading strategy built in. It was developed with options trading in mind for members over at OptionsPlayers.com. It tries to detect when the BB tunnel tightens, and then triggers an entry position when it detects the breakout. No strategy is 100% accurate, and there are some false positives, but it seems to work fairly well. However, do your own due diligence and use at your own risk.
The strategy can be turned on using a checkbox in the properties.


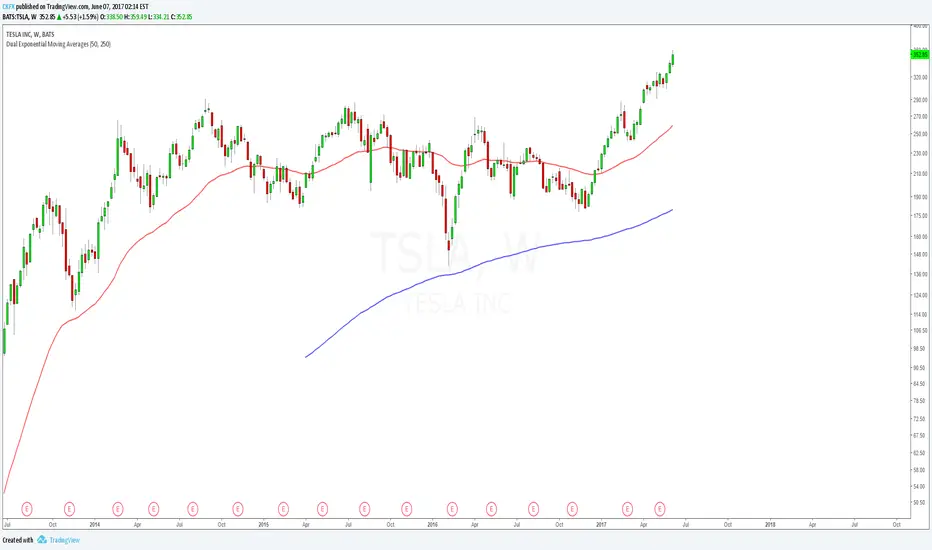
Dual Exponential Moving AveragesJust like the regular "Moving Average Exponential" indicator except this allows you to show 2 with custom time intervals, saving non-subscribers to Trading View an indicator slot. Enjoy.
Goldies Wave Revision- Exponential Movin Average
- Tilson's T3 Moving Average
- 0.618 Golden ratio
- Fibonacci Retrenchment


2/20 Exponential Moving Average Backtest Strategy
This indicator plots 2/20 exponential moving average. For the Mov
Avg X 2/20 Indicator, the EMA bar will be painted when the Alert criteria is met.
You can use in the xPrice any series: Open, High, Low, Close, HL2, HLC3, OHLC4 and ect...
You can change long to short in the Input Settings
Please, use it only for learning or paper trading. Do not for real trading.

EMA Time-FrameThis EMA allows you to specify a time-frame for the price used to calculate the moving average. For example, you can create 1 hour EMAs on your 5 minute chart.
NOTE: This indicator only works on intraday charts. The time-frame specified for the indicator must be greater than or equal to the time-frame of the chart.


Fractal Dimension Adaptive Moving Average (D-AMA)etfhq.com
Overall the D-AMA produced results that were near identical to that of the FRAMA but the D-AMA is a slightly faster average.
It is very difficult to pick between the FRAMA and the D-AMA but becuase the FRAMA offers a slightly longer trade duration it the best Moving Average we have tested so far.

Fractal Adaptive Moving AverageSettings:
FRAMA: blue line, SC = 252, FC = 40, length = 252
EMA: orange line, length = 50
FRAMA seems to be the evolution of the current and much-used EMA. The basic strategy is simple: long if the price crosses up the line, short or exit if vice versa.
The main difference between EMA and FRAMA is that the first one seems to lag much more than the first one, as we can see from the chart below (crude oil daily chart)
FYI
etfhq.com
quantstrattrader.wordpress.com

EMA bullish/bearish dashboard - MTFThis is a good reminder for which way you should be placing orders.
It's best to not ignore these signals!!!
lime = full bull - 100ema above 200ema and price is above 200ema
green = hallf bull - price now below 200ema but 100ema is still above the 200
maroon = full bear - opposite of full bull
red = half bear - opposite of half bull
Also with multi timeframe option - so I guess you could stack several of these on a single framed chart if you wanted.