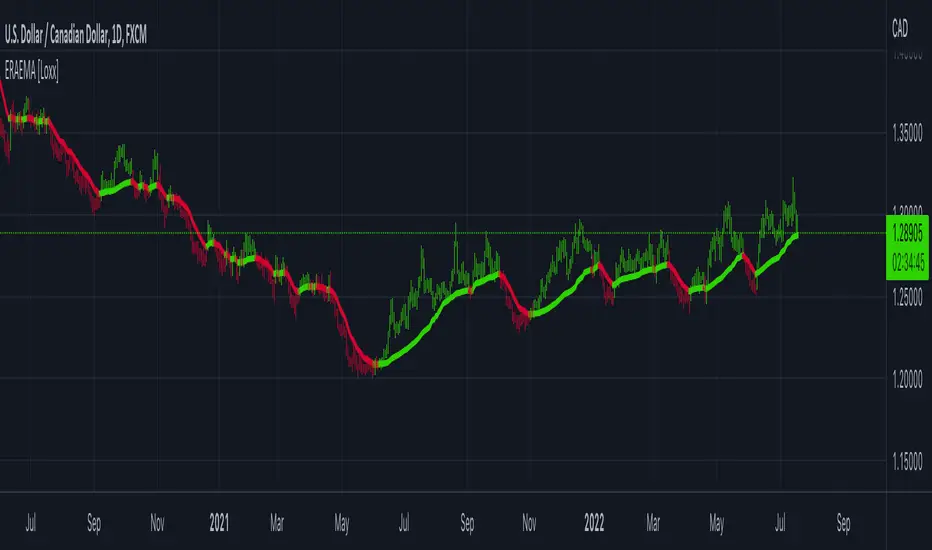
Efficiency-Ratio-Adaptive EMA [Loxx]Efficiency ratio was invented by Perry Kaufman as a measure of volatility and as a way of making some calculations adaptive. In his adaptive moving average he uses 3 periods for calculation which makes it a bit "cryptic" and, by all means, not so simple to use. This version is simplifying the whole thing without an intention to clone the KAMA indicator--but with the intention to use the efficiency ratio for adapting the average calculations and to use only two parameters for that:
period
price
Included:
Bar coloring
Exponentialmovingaverage
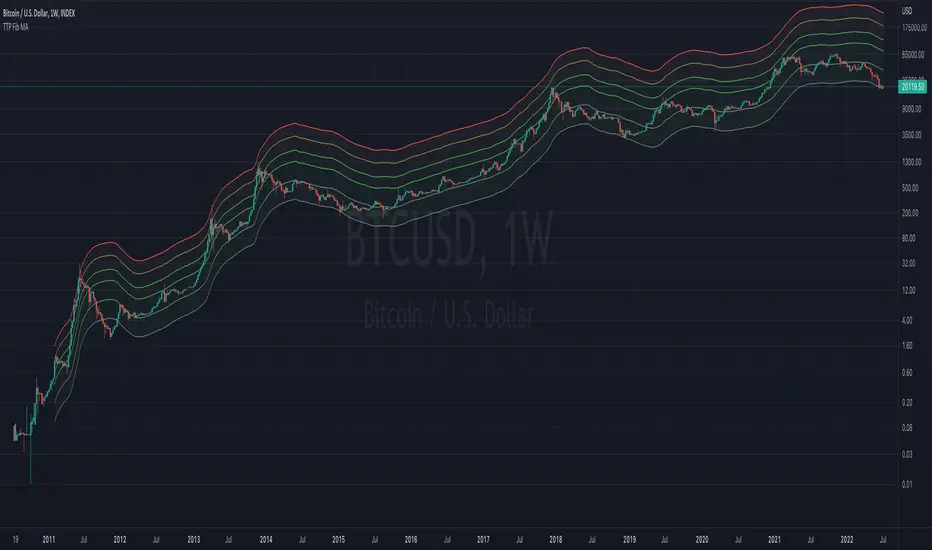
TTP Fibonacci MAThis indicator offers a fibonacci rainbow of moving averages.
Recommended instructions:
- timeframe: daily or weekly
- logarithmic scale
- default MA length for smoother curve
- fib levels used are 0.5,1,2,3,5 and 8, but you can also try with 1,2,3,5,8,13 or 0.33,05,1,2,3 depending on which range you want to cover
- you can render in weekly timeframe and still set the indicator settings timeframe to daily to get more reactive levels
Short Swing Bearish MACD Cross (By Coinrule)This strategy is oriented towards shorting during downside moves, whilst ensuring the asset is trading in a higher timeframe downtrend, and exiting after further downside.
This script can work well on coins you are planning to hodl for long-term and works especially well whilst using an automated bot that can execute your trades for you. It allows you to hedge your investment by allocating a % of your coins to trade with, whilst not risking your entire holding. This mitigates unrealised losses from hodling as it provides additional cash from the profits made. You can then choose to hodl this cash, or use it to reinvest when the market reaches attractive buying levels. Alternatively, you can use this when trading contracts on futures markets where there is no need to already own the underlying asset prior to shorting it.
ENTRY
This script utilises the MACD indicator accompanied by the Exponential Moving Average (EMA) 450 to enter trades. The MACD is a trend following momentum indicator and provides identification of short-term trend direction. In this variation it utilises the 11-period as the fast and 26-period as the slow length EMAs, with signal smoothing set at 9.
The EMA 450 is used as additional confirmation to prevent the script from shorting when price is above this long-term moving average. Once price is above the EMA 450 the script will not open any shorts - preventing the rule from attempting to short uptrends. Due to this, this strategy is ideal for setting and forgetting.
The script will enter trades based on two conditions:
1) When the MACD signals a bearish cross. This occurs when the EMA 11 crosses below the EMA 26 within the MACD signalling the start of a potential downtrend.
2) Price has closed below the EMA 450. Price closing below this long-term EMA signals that the asset is in a sustained downtrend. Price breaking above this could indicate a bullish strength in which shorting would not be profitable.
EXIT
This script utilises a set take-profit and stop-loss from the entry of the trade. The take profit is set at 8% and the stop loss of 4%, providing a risk reward ratio of 2. This indicates the script will be profitable if it has a win ratio greater than 33%.
Take-Profit Exit: -8% price decrease from entry price.
OR
Stop-Loss Exit: +4% price increase from entry price.
Based on backtesting results across a selection of assets, the 45-minute and 1-hour timeframes are the best for this strategy.
The strategy assumes each order is using 30% of the available coins to make the results more realistic and to simulate you only ran this strategy on 30% of your holdings. A trading fee of 0.1% is also taken into account and is aligned to the base fee applied on Binance.
The backtesting data was recorded from December 1st 2021, just as the market was beginning its downtrend. We therefore recommend analysing the market conditions prior to utilising this strategy as it operates best on weak coins during downtrends and bearish conditions, however the EMA 450 condition should mitigate entries during bullish market conditions.

Multi-timeframe EMAThe Multi-timeframe exponential moving average (EMA) indicator visualizes EMAs from 1 minute to 1 quarter on a single chart using the request.security function. Standard and Fibonacci timeframes are available as well as the ability to hide high-timeframe EMAs to keep the chart clean. Cross-overs and arrangement of the EMAs indicate sentiment.
Much love to DumpCap! The script is presented sans secret sauce.
Tracert Trend[s3]Variable Moving Average(VMA) with a view of the trend based on the VMA on multiple timeframes. The Variable Moving Average (VMA) is a study that uses an Exponential Moving Average being able to automatically adjust its smoothing factor according to the market volatility . The timeframes of the indicator must be set to a higher timeframe than whatever timeframe your chart is set to to work properly. Example(default): Trading on the 15m timeframe so have the timeframes set to: 1) Chart 2) 30m 3) 45m 4) 60m
Green line of VMA = uptrend in price action
Red line of VMA = downtrend in price action
White line of VMA = indecision in price action
Green candles = uptrend and above VMA
Red candles = downtrend and below VMA
White candles = indecision or chop in price action
Green symbol below candle = all six timeframes are above the VMA
Red symbol above candle = all six timeframes are above the VMA
No symbol above or below candle = indecision amongst the six timeframes

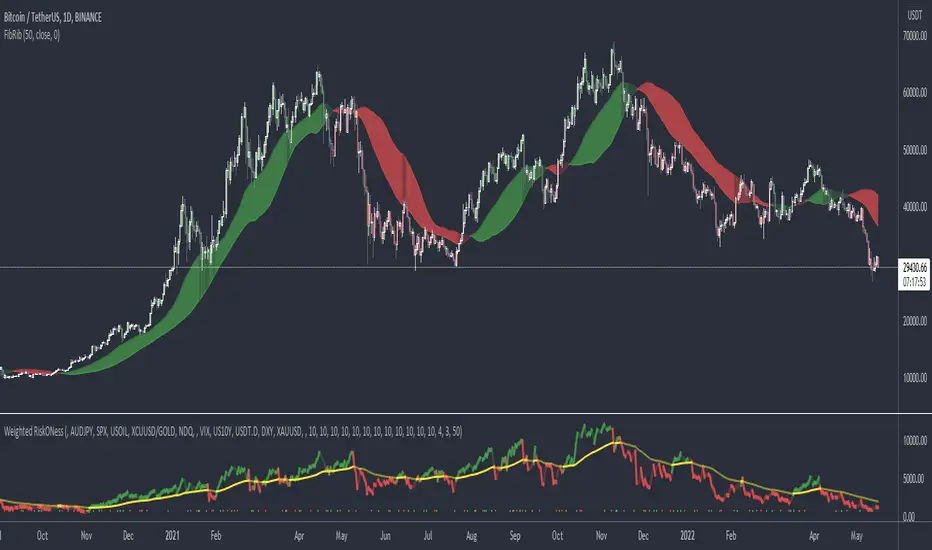
Fibonacci RibbonThe Fibonacci Ribbon (FibRib) creates two Fibonacci moving averages: essentially a Fibonacci WMA and a Fibonacci EMA.
The ribbon colors based on which is higher and where PA is relative to the ribbon.
Optional colored candles shades candles the same color as the ribbon.
EMA ExtendedThe general idea behind the indicator is that when price is extended away from an EMA (usually the 50 EMA for the Market Maker strategy), it usually comes back to it. When monitoring many assets or cryptocurrencies, this indicator (with Alerts) provides ease of mind to spot such opportunities across the board.
This indicator uses an EMA and the current price (candle's High and Low) to signal 'Long' or 'Short' when price is extended away from the EMA with a specific ratio. The signal is in the form of an arrow that appears above the candle to be Shorted, or below the candle to be Longed. Those signals are also exported to the Alerts system so you can choose to trigger alerts (preferably "Once Per Bar").
All features are configurable from the indicator's settings.
Example: 'Long' signal if price is extended 0.78% below the 50 EMA , or 'Short' signal if price is extended 5.2% above the 50 EMA .
I plan to expand on this indicator to support MAs, as well as the potential to include multi-conditions (AND/OR) of two different EMAs/MAs (eg. 'Short' signal if price is 8% above 50 EMA and 20% above 200 MA).
If you have suggestions or questions, you can message me or leave a comment.

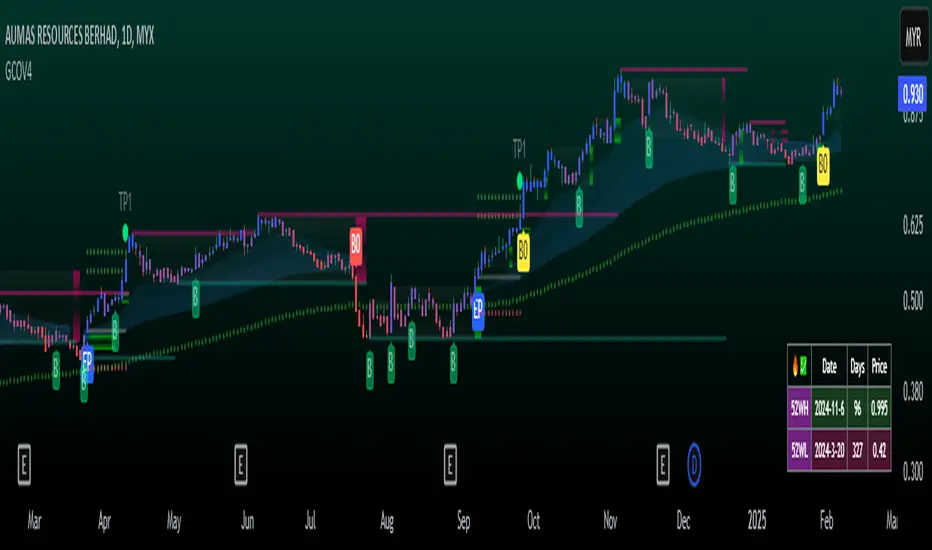
GCOV4 PROTECH GCOV4 PROTECH SYSTEM
This indicator is built specifically for SWING, PULLBACK and BREAKOUT strategy trading in the stocks/equity market. It uses an indicator instrument consisting of ATR TRAILING STOP (ATR), EXPONENTIAL MOVING AVERAGE(EMA), PIVOT POINT and VOLUME ANALYSIS.
The parameters that have been upgraded are to meet the needs of trading strategies whether short or long term trading. In addition, it is built to reduce the risk of trading activities and help traders to adhere to the best trading plan.
This transformation involves 3 trading strategy modes namely SWING PRO, PULL & BOUND and BREAKOUT STRATEGY.
Rebuild of Instrument & Parameter
This indicator is also an upgraded instrument that is sourced from the previous indicator, the GOLDENCO AIE2 INDICATOR.
This R&D of course to make trading activities more effective, dynamic and to increase the confidence of traders in current trading activities. The indicator has been upgraded in terms of parameters as well as additional instruments. Among them are;
1. ATR Trailing Stop
2. Exponential Moving Average – fastMA/slowMA Length
3. Label@Entry Price/Stoploss/Takeprofit line;
>The take profit and stop loss rates are based on percentages. However
traders can change the percentage rate according to their respective
trading plans.
>existing percentage rates have been set(build-in) for standard rate.
So you have to reset based on the type of stock/market cap either penny
stock or blue chip stock.
>The candle/bars have been colored to make it easier for traders to see price
trends whether in bullish or bearish conditions.
Hopefully with the upgrading of these indicators will make traders more successful in trading activities, especially in the equity markets.
DISCLAIMER;
ALL NOTES AND INDICATING TOOLS ARE FOR EDUCATIONAL ONLY AND AS A FACILITATOR AND PREPARATION IN TRADING ACTIVITIES. ADMIN IS NOT RESPONSIBLE FOR ANY RISKS IN YOUR TRADING ACTIVITIES. TAKE AT YOUR OWN RISK.
FunTrader/Aieyee @2022
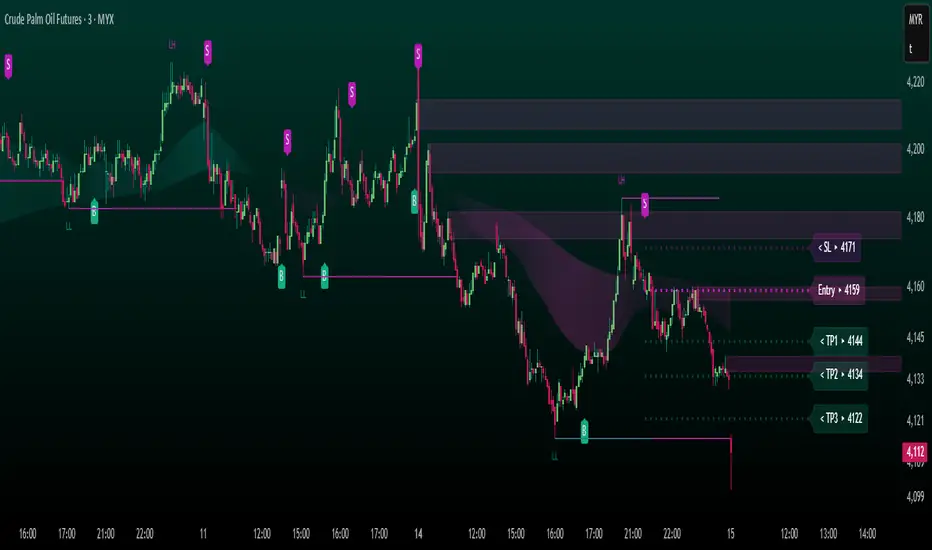
FUTURES ScalpV2 PROTECHFUTURES ScalpV2 PROTECH system
This indicator is built specifically for fast trading i.e. scalping/intraday in the commodity market or futures market. It uses an indicator instrument consisting of ATR TRAILING STOP (ATR), EXPONENTIAL MOVING AVERAGE, PIVOT POINT, and FIBONACCI.
Rebuild of Instrument & Parameter
This indicator is also an upgraded instrument that is sourced from the previous indicator, the COMPLETELY FCPO INDICATOR.
This R&D of course to make trading activities more effective, dynamic and to increase the confidence of traders in current trading activities. The indicator has been upgraded in terms of parameters as well as additional instruments. Among them are;
1. ATR Trailing Stop
2. Exponential Moving Average – fastMA/slowMA Length
3. Label@Entry Price/Stoploss/Takeprofit line
>The best timeframe is 3 minutes
>The take profit and stop loss rates are based on percentages. However
traders can change the percentage rate according to their respective
trading plans.
>existing percentage rates have been set(build-in) specifically for the FCPO
market. So you have to reset for other markets.
>The candle/bars have been colored to make it easier for traders to see price
trends whether in bullish or bearish conditions.
The original instrument has been retained but changed in terms of display & facelift features.
The original indicator (COMPLETELY FCPO INDICATOR) still remains in use and can used together. Hopefully with the combination of these indicators will make traders more successful in trading activities, especially in the futures market.
DISCLAIMER;
ALL NOTES AND INDICATING TOOLS ARE FOR EDUCATIONAL ONLY AND AS A FACILITATOR AND PREPARATION IN TRADING ACTIVITIES. ADMIN IS NOT RESPONSIBLE FOR ANY RISKS IN YOUR TRADING ACTIVITIES. TAKE AT YOUR OWN RISK.
FunTrader/Aieyee @2022
Relative Strength Volume Adjusted Exponential Moving Avg [CC]The Relative Strength Volume Adjusted Exponential Moving Average was created by Vitali Apirine (Stocks and Commodities Feb 2022 pgs 14-18) and this is very similar of course to the last Relative Strength Exponential Moving Average . It works under the same concept with using overbought and oversold methods to adjust the moving average and with this particular version you will notice that sudden drops or increases won't follow super closely so this can be useful along with the other as a good complementary indicator to use with each other to determine the short and medium term trend and to give good entry and exit points. I have strong buy and sell signals in addition to normal ones so darker colors are strong and lighter colors are normal. Buy when the indicator line turns green and sell when it turns red.
Let me know if there are any other indicators or scripts you would like to see me publish!
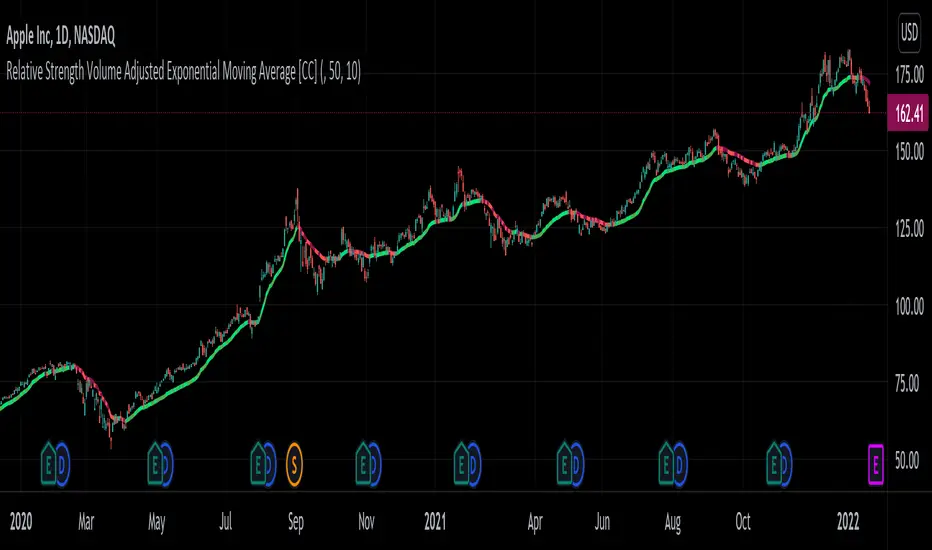
Relative Strength Exponential Moving Average [CC]The Relative Strength Exponential Moving Average was created by Vitali Apirine (Stocks and Commodities Jan 2022 pgs 22-25) and this is a handy moving average that combines a typical overbought/oversold mechanic with an overall trend indicator. Even though the typical length is so large it reacts extremely quickly when the stock becomes overbought or oversold. Because of this the indicator by itself doesn't work as well during choppy periods so Vitali recommends using a moving average crossover system during choppy so do one indicator with the default length of 50 and use a different length of 10 so when the shorter length crosses over the longer length then buy and vice versa you would sell. Generally speaking buy when the line turns green and sell when it turns red. I have used strong buy and sell signals in addition to normal signals so strong signals are darker in color and normal signals are lighter in color.
Let me know if there are any other scripts or indicators you would like me to publish!

5min Williams Fractals scalping (3commas)Another strategy I'm learning Pine Script on. It is inspired by a MoneyZG youtube strategy called "Easy 5 Minute Scalping Strategy (Simple to Follow Scalping Trading Strategy)".
Again this is a one order per trade strategy compatible with the 3commas bot (works also with the free 3commas subscription). This strategy is based on the signals from Williams Fractals, taking the signals in reverse - red triangle indicates a bottom and hence we go long. The green triangle indicates a top so we go short. By default these signals are only accepted if they occur between the two Emas. However, you can also turn this off and when a WF signal comes in, only the current price has to be between the Emas. Stop loss is set to the current Ema slow and the take profit is a multiple of the distance to the slow ema.
Like previously I have added different filters as well as the ability to view essential things like the WF signal and Emas. I hope the script will help you to be more successful and if so it would be great if you could share here your setups, or tips on what would be good to refine to make it an even a more profitable strategy. Kind of a community approach so that we help each other out :).
Instructions for the 3commas connector:
1. First, you need to prepare 3commas Long/Short bots that will only listen to custom TV signals.
2. Inputs for the 3commas bot can be found at the end of the user inputs.
3. Once you have entered the required details into the inputs, turn on 3commas comments. They should appear on the chart (looks messy).
4. Now you can add the alert where you should paste the 3commas Webhook URL: 3commas.io
5. For the alert message text insert the placeholder {{strategy.order.comment}} and delete the rest.
6. Once the alert is saved, you can turn off those 3commas comments to have a clearer chart.
7. With a new alert, the bot and trade should launch.
In the near future I would like to publish more scripts that will carry similar elements as the first two, incl. compatibility with 3commas (I don't have access to another bot system). I will choose some strategies myself, but I will also be glad for some tips on what strategy would be good to do and is still missing here on Tradingview (short youtube videos or brief strategy manuals would be great).
Thanks and keep it up
PS: My screen values starting at Long Target Profit and ending at Pullback NOT greater than: 1.5; 1.5; 0; ON; 1; 2; OFF; 17; 36; ON; 0.05; ON; Chart; 14; 46; 50; 48.5; 51; OFF; 1; ON; 4; 2.

EMA Index Cross by Hassonya
While the indicator is working on any stock chart, it shows the two ema average breakdown/breakup of the index or any other stock with an arrow. In this way, you will be able to follow the ema intersections of the index chart while working on a normal stock chart.
I will add other moving average options if you like it.
I hope you will be satisfied using it.
TURKISH
------------
Gösterge, herhangi bir hisse senedi grafiği üzerinde çalışırken, endeksin veya başka bir hisse senedinin iki ema ortalama dağılımını/dökülmesini bir okla gösterir.
Bu sayede normal bir hisse senedi grafiği üzerinde çalışırken endeks grafiğinin ema kesişimlerini takip edebileceksiniz.
Eğer beğenirseniz başka ortalama seçenekleri de ekleyeceğim.
Güle güle kullanın.

TridentI call this strategy "Trident", as it uses three different, modified, customizable indicators:
50 Exponential Moving Average (Trend)
Relative Strength Index (Momentum)
Average Directional Index (Volatility)
Strategy will be improved with future updates. You alone decide when to enter and when to exit a trade. PRICE ACTION IS KING and the TREND IS YOUR FRIEND
What do these three indicators tell us
Exponential Moving Average:
Trend
Price < EMA = downtrend
Price > EMA = uptrend
trend direction and reducing noise
Average Directional Index:
Volatility
direction of market movement when there is a sharp increase in volatility
Relative Strength Index:
Momentum
Strength
Possible shift in momentum
How this strategy works
As I mentioned above, this strategy uses uses three different, modified, customizable indicators:
Exponential Moving Average (50) (Trend): When price closes above or below the 50 period EMA, then the first condition is met. I know some people use multiple EMAs as dynamic support and resistance levels. Therefore, I also added a 21 and a 200 period EMA, but this strategy uses specifically the 50 period EMA as one of three conditions. All EMAs can be adjusted, turned on and off.
Relative Strength Index (80, 20, 3) (Momentum): In his video, TSM uses a 3 period RSI and 80 and 20 bands. If price is above 80, it`s overbought and if it`s below 20, then it`s oversold. Two out of three conditions are met.
Average Directional Index (5, 5) (Volatility): TSM uses the ADX to measure the volatility. Both ADX Smoothing and DI Length are set to 5. If this indicator moves above 30, then the third contidion is met.
Rules to enter the trade
Long Entry:
50 EMA < Price
RSI < 20
ADX > 30
Enter trade at breakout of high of the green candle, which is the candle that pulls the RSI from oversold conditions back inside.
Short Entry:
50 EMA > Price
RSI > 80
ADX > 30
Enter trade at breakout of low of the red candle, which is the candle that pulls the RSI from overbought conditions back inside.
Risk:Reward and Timeframe
Use a 1:1 to 1:1.5
Set your S/L below key levels (-> 2nd point @ Tips), or twice the length of the signal candle
Preferably 5 Minute Time Frame, but at the end you decide
Tips
Avoid periods of consolidation
Trade from support/resistance-levels, supply/demand-levels, pivot points-levels, Fibonacci-levels, swing high/low-levels
Trade during market hours, for example London and New York Session
Trade narrow spreads, if you scalp
Use Price Action
Trade with the trade, not against
The further away the price moves from the EMA the stronger the trend
The long the price doesn't touch the EMA the stronger the trend
RSI + ADX: Confirm when the market is turning and pick a good entry point
ADX + 50 EMA: Filters trades when there is not much activity in the market
I mentioned above that the code of this strategy is still under development. You can not only rely on this strategy alone as it might give you false signals. I coded this, because it makes it easier to visualize were all three conditions are met.
Use your brain, use price action, use these tips, use this strategy.
Frequently Asked Questions
Does it only work for scalping? - No, but try it out yourself
Does it only work for Forex? - No, but try it out yourself
Does only work on the 5 Minute Timeframe? - No, but try it out yourself
Good Luck!

Simple Ema_ATR Strategy HulkTradingSimple EMA strategy, based on ema55+ema21 and ATR(Average True Range) and it enters a deal from ema55 when the other entry conditions are met
Basically long and short conditions
If long:
1) close must be less than open (because we are searching for a pullback)
2) emaFast(21) must be bigger than emaSlow(55) - for a trend detection
3) Difference between emaFast and emaSlow must be greater than ATR(14) - for excluding flat
For short conditions are opposite
Stop levels and take profits, based on ATR multiplier.
You can change it in input field.
I recommended values between 1 and 4, not more.
This strategy was tested on pairs BTCUSDT and ETHUSDT and have a nice results.

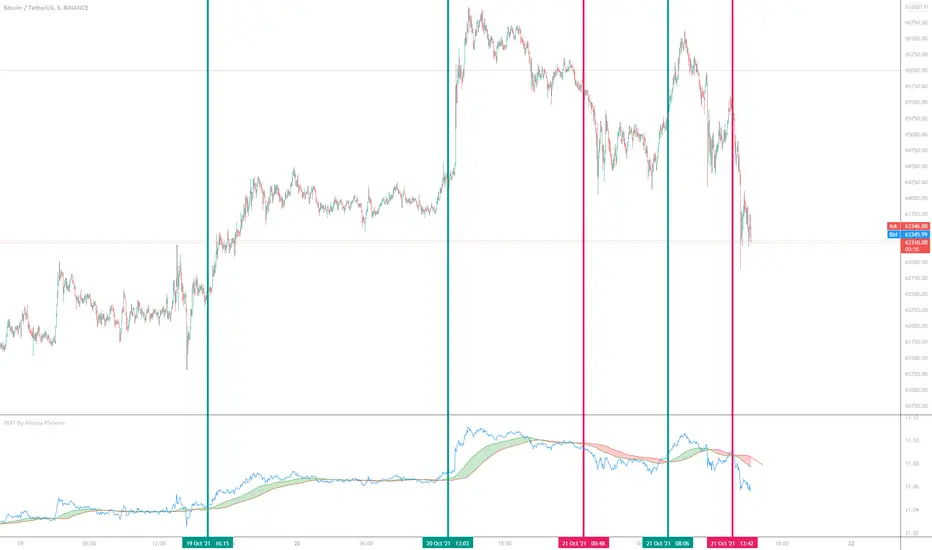
Price Movement Trend By Alireza Phoenix (Logarithmic)hi Traders
This logarithmic indicator shows the price movement trend, which is designed based on logarithmic functions and moving averages.
The Price Movement Trend Display Composed By :
A leading line consisting of the natural logarithm of Running Moving Average with length 60 and Offset 20 , and is displayed in red line.
A signal line consisting of a natural logarithm of an exponential moving average of length 90 , and is displayed in green line.
A price line consisting of the natural logarithm of a simple moving average along 1 whose source is price close , and is displayed in blue line.
A hidden price line consisting of the natural logarithm of a simple moving average along 1 and its source being the highest and lowest average prices , and is displayed in maroon line.
Learning how to get a signal from the price Movement trend indicator:
Moving the signal line and breaking the leading line upwards to form a green cloud is a buy signal.
Moving the signal line and breaking the leading line downwards that forms a red cloud is a sell signal.
Moving the price line and breaking the trend cloud upward , is a buy signal
Moving the price line and breaking the trend cloud downwards , is a sell signal
My instagram id : @pnxf6
ترجمه فارسی :
سلام تریدرها
این اندیکاتور لگاریتمی ، نمایش دهنده روند حرکتی قیمت است ، که بر اساس توابع لگاریتمی و میانگین های متحرک قیمت طراحی شده است
این اندیکاتور تشکیل شده از :
یک خط پیشرو متشکل از لگاریتم طبیعی متحرک وزنی نمایی مورد استفاده درآر اس آی به طول 60 و انحراف 20 است
یک خط سیگنال متشکل از لگاریتم طبیعی میانگین متحرک نمایی با طول 90
یک خط قیمت که متشکل از لگاریتم طبیعی میانگین متحرک ساده در طول 1 که منبع آن بسته شدن قیمت است.
یک خط قیمت مخفی که متشکل از لگاریتم طبیعی میانگین متحرک ساده در طول 1 و منبع آن میانگین بالاترین و پایین ترین قیمت است
یک فضای ابری مابین خط پیشرو و خط سیگنال که که با "نمایش روند حرکت قیمت" مشخص شده و در رنگ های سبز و قرمز قابل مشاهده میباشد.
آموزش گرفتن سیگنال ازاندیکاتور نمایش روند قیمت :
حرکت خط سیگنال و شکستن خط پیشرو رو به بالا که تشکیل ابر سبز رنگ میدهد یک سیگنال خرید میباشد .
حرکت خط سیگنال و شکستن خط پیشرو رو به پایین که تشکیل ابر قرمز رنگ میدهد یک سیگنال فروش میباشد .
حرکت خط قیمت و شکستن ابر روند حرکت قیمت رو به بالا سیگنال خرید میباشد
حرکت خط قیمت و شکستن ابر روند حرکت قیمت رو به پایین سیگنال فروش میباشد.
Fundamental Analysis - Multiple RSI EMAAs the number of crypto currencies is expanding, we need to find the one which will boom in the next months, weeks or even days.
Therefore, I present to you a Fundamental Analysis tool based on RSI built in order to compare the RSI between the diverse cryptocurrencies.
When cryptocurrencies start to trend, become active, minable and especially "buyable", people are investing their money into them.
As a result,the Daily RSI rises and the price of the crypto in question increases steadily.
With "Fundamental Analysis - Multiple RSI EMA" you can :
Follow up to 20 RSI from different exchanges at the same time.
Find easily Increasing/Decreasing RSI as the lines get transparent if their RSI decrease.
You can also select market with high potential of booming as :
Booming Market : 60 < Daily RSI <= 100 (Strong green background)
Potent Market : 55 < Daily RSI <= 60 (Light green background)
Sleepy Market : 50 < Daily RSI <= 55 (Light red background)
Dying Market : 0 < Daily RSI <= 50 (Strong red background)
Futur booming crypto will go from the Potent Market to the Booming Market
Can be used with the following time frames depending on the necessity:
4H
Daily (Preferred)
Weekly
Monthly
Good trades !
Disclaimer (As it should always be one to any script)
***
This script is intended for and only to be used for personal purposes only. No such information provided by it constitutes advice or a recommendation for any investment or trading strategy for any specific person. There is no guarantee presented or implied as to the accuracy of specific forecasts, projections, or predictive statements offered by the script. Users of the script agree that its original developer does not take responsibility for any of your investment decisions. Please seek professional advice before trading.
***

Indicator: SMA/EMA (Multi timeframes)This moving average indicator will plot the SMA or EMA sourced from a different timeframe on the current chart.
Applications:
Say you are viewing an hourly chart but you also want to know the ema20 sourced from a higher timeframe (i.e daily) of the same security. The problem with using most built-in indicators is that the MA values are usually calculated from the current chart, so to do that, you will have to toggle between 1h/1D. This script will eliminate this hassle by plotting out the desired alternative timeframe on the same chart.
Dynamic settings
By default the alternative timeframe is 1D, but this can be customized further:
- 1 week chart -> plots out 1 month MA
- 1 day chart -> plots out 1 week MA
- 1 hour chart -> plots out 1 day MA

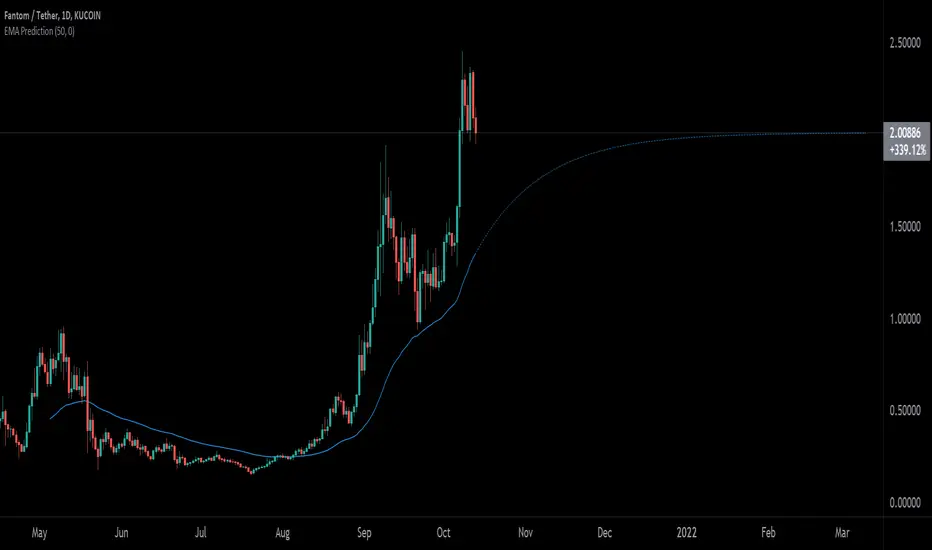
EMA PredictionThis script predicts future EMA values assuming that the price remains as configured (-50% to +50%).
VolumatrixVolumatrix is an enhanced volume weighted price indicator with advanced features
Created by CryptoJew & CryptoTiger on 04-06-2021
👋 Definition
Volumatrix turns current and historical price data into enhanced volume weighted price plots that allow you to visually grasp the momentum of any given market.
It’s easy to use and provides an accurate reading about an ongoing trend. This indicator is optimized to catch trend movements as soon as possible and to maximize certainty.
🙌 Overview
The Volumatrix indicator is based on an enhanced VWAP calculation, which serves as a present and upcoming price movement indication.
The further away the VWAP Wave is from the Zero Line, the more powerful the momentum is in that direction.
Conversely, the closer the VWAP Wave is to the Zero Line, the less momentum it has.
⭐️ Features
Volumatrix consists of the following features:
VWAP Waves: Visualizes the market's momentum in an easy-to-understand way by drawing colored waves.
VWAP Average: Acts as a calibration line for current wave movements.
Bearish & Bullish Dots: Indicates and confirms immediate trend changes by printing dual-colored dots.
E MA Backgrounds: Shows the general direction of the market, based on the exponential moving average (EMA).
In-depth alerts: Help traders discover potential trades with less time.
☝️ Basics
The Volume Weighted Average Price plays an essential role, as the Volumatrix indicator uses an enhanced VWAP calculation.
The volume weighted average price (VWAP) is a great technical trading indicator used by traders as it accounts for both price and volume.
VWAP signals the ratio of the cumulative share price to the cumulative volume traded over a given time.
It is essential because it provides traders with advanced insight into the trend and value of an asset.
Unlike moving averages, VWAP assigns more weight to price points with high volume.
This allows one to understand price points of interest, gauge relative strength, and identify prime entries/exits.
VWAP works with any interval: seconds, minutes, hours, days, weeks, months, years, etc...
However, keep in mind that VWAP can also experience some lag, much like a moving average.
Lag is inherent in the indicator because it's a calculation of an average using past data.
🧮 Calculation
Volume Weighted Average Price (VWAP) is constructed with two parameters, namely, price and volume, in 5 steps:
1. Calculate the Typical Price for the period.
((High + Low + Close)/3)
2. Multiply the Typical Price by the period Volume
(Typical Price x Volume)
3. Create a Cumulative Total of Typical Price
Cumulative(Typical Price x Volume)
4. Create a Cumulative Total of Volume
Cumulative(Volume)
5. Divide the Cumulative Totals
VWAP = Cumulative(Typical Price x Volume) / Cumulative(Volume)
🔍 Trend Identification - What to look for
VWAP is an excellent way to identify the trend of a market.
When using Volumatrix, you are looking for multiple confirmations that take place simultaneously.
The more confirmations that occur at the same time; the more certain the indicator will be.
You can identify the direction of a market by looking out for a few critical confirming signals.
📈 Bullish Trend Confirmations:
VWAP Wave overcrossing Zero Line :
When the VWAP Wave is crossing over the Zero Line, it indicates an immediate bullish trend.
This is one of the most certain moves that one can detect in Volumatrix.
This means that the price is about to change direction.
This is the case for any timeframe: seconds, minutes, hours, days, week, month, year, etc.
VWAP Wave color turning bullish:
When a bullish trend is about to happen, the VWAP Wave will change its color to yellow and finally to green.
That way, one can preemptively detect an upcoming bullish move.
In general, the VWAP Wave can change to 3 different colors.
Green means bullish.
Bullish Dots:
From time to time, bullish green dots will appear.
When combined with other indications, the Bullish Dots can be handy in confirming an upcoming or present uptrend.
That said, one should never solely rely on dots when deciding whether the trend is bullish or not.
Instead, if a trader sees a green dot, it should be taken as a hint to look for further bullish indications.
EMA Background:
One can identify the general trend of a market by looking at the background color of the indicator.
When the background is green, one can assume that a bullish trend is present.
The background color changes based on the exponential moving average (EMA).
By default, the 200 EMA is set. Change this value based on your timeframe preferences.
VWAP Average:
When the white VWAP Average line crosses above the Zero Line, it acts as an additional trend confirmation when combined with the VWAP waves.
As the VWAP average does not weigh in the short-term movements too heavily, it is less affected by immediate volatility.
Therefore, traders usually use the VWAP Average as a calibration tool to interpret the VWAP Waves more precisely.
📉 Bearish Trend Confirmations:
VWAP Wave under crossing Zero Line:
When the VWAP Wave is crossing under the Zero Line, it indicates an immediate bearish trend.
This is one of the most certain moves that one can detect in Volumatrix. This means that the price is about to change direction.
This is the case for any timeframe: seconds, minutes, hours, days, week, month, year, etc.
VWAP Wave turning bearish:
When a bearish trend is about to happen, the VWAP Wave will change its color to yellow and then finally to red.
That way, one can preemptively detect an upcoming bearish move. In general, the VWAP Wave can change to 3 different colors.
Red means bearish.
Bearish Dots:
From time to time, bearish red dots will appear.
When combined with other indications, the bearish dots can be handy in confirming an upcoming or present downtrend.
That said, one should never solely rely on dots when deciding whether the trend is bearish or not.
Instead, if a trader sees a red dot, it should be taken as a hint to look for further bearish indications.
EMA Background:
One can identify the general trend of a market by looking at the background color of the indicator.
When the background is red, one can assume that a bearish trend is present.
The background color changes based on the exponential moving average (EMA).
By default, the 200 EMA is set. Change this value based on your timeframe preferences.
VWAP Average:
When the white VWAP Average line crosses below the Zero Line, it acts as an additional trend confirmation if combined with the VWAP waves.
As the VWAP average does not weigh in the short-term movements too heavily, it is less affected by immediate volatility.
Therefore, traders usually use the VWAP Average as a calibration tool to interpret the VWAP Waves more precisely.
💤 Sideways Trend Confirmations:
VWAP Average:
When the VWAP Average is parallel and hovering around the Zero Line, either above or below it, that will indicate a sideways trend.
🚦 Usage - How and where to use it
The Volumatrix indicator is a universal indicator that works with any market capable of calculating a VWAP.
It’s currently being used in the following markets: cryptocurrency market, stock market, gold market and oil (just to name a few).
❗️ Requirements:
This indicator does not require any additional indicators as traders usually do in price action trading.
Basically, one just needs to follow the crossings, dots, and colors to get maximum certainty.
As a bonus, we recommend traders take advantage of TradingView’s multi-chart to catch more simultaneous confirmations.
🗣 Example Strategy: The 4 Timeframe Strategy
One can use the Volumatrix indicator along with the 4 timeframe strategy.
For example, open the 4 hour, 1 hour, 30 minute, and 5minute intervals simultaneously from left to right in a multi-chart layout.
Then lookout for the following conditions to meet:
OPEN LONG TRADE IF: On the 1-hour interval + 30-minute interval, Bullish Dots appear simultaneously
AND: On the 4-hour interval, the VWAP Wave is above the Zero Line
AND: On the 5-minute interval VWAP Wave is about to cross over the Zero Line or has already minimally crossed up.
OPEN SHORT TRADE IF: On the 1-hour interval + 30-minute interval, Bearish Dots appear simultaneously
AND: On the 4-hour interval VWAP Wave is below the Zero Line
AND: On the 5-minute interval VWAP Wave is about to cross under the Zero Line or has already minimally crossed down.
💡 Tips
Use TradingView’s 4-multi-chart layout to catch potential trades faster.
Use the indicator on a computer for optimal performance.
Set your computer screen to higher resolutions to get a better overview.
🔔 Alerts
With Volumatrix, you can use in-depth alerts like:
Bullish Dot
When a green dot at the bottom of the indicator appears
Bearish Dot
When a red dot at the bottom of the indicator appears
VWAP Wave Crossing Over Zero Line
When the VWAP Wave crosses over the Zero Line
VWAP Wave Crossing Under Zero Line
When the VWAP Wave crosses under the Zero Line
VWAP Wave Crossing Over Zero Line + Bullish Dot
When the VWAP Wave crosses over the Zero Line and a Bullish Dot appears
VWAP Wave Crossing Under Zero Line + Bearish Dot
When the VWAP Wave crosses over the Zero Line and a Bearish Dot appears
VWAP Average Crossing Over Zero Line
When the VWAP Average crosses over the Zero Line
VWAP Average Crossing Under Zero Line
When the VWAP Average crosses under the Zero Line
🔧 Settings
🔢 Inputs
These settings will change the behavior and outcome of the indicator.
EMA
Determines the number of previous candles that should be taken into calculation for the EMA background.
The value of the EMA can be changed to one's preferred value in accordance with the chosen interval.
The default value is 200.
🎨 Style
These settings will change the appearance of the indicator
VWAP Waves
Determines the color, opacity, thickness, and shape for the VWAP Waves.
The default shape is area.
The default colors are red, yellow & green.
VWAP Average
Determines the color, opacity, thickness, and shape for the VWAP Average.
The default shape is line.
The default color is white.
Zero Line
Determines the color, opacity, thickness, and shape for the Zero Line.
The default shape is a line.
The default color is white.
EMA Background
Determines the color & opacity for the Dynamic Background.
The default colors are black, red & green.
Bullish Dot
Determines the color, shape, opacity & location for the bullish dot.
The default shape is a circle.
The default color is green.
Bearish Dot
Determines the color, shape, opacity & location for the bearish dot.
The default shape is a circle.
The default color is red.
✅ Summary
Volumatrix is a unique indicator because, unlike many other VWAP tools, it's suited for simple as well as advanced analysis.
It’s a solid tool for immediately identifying the underlying trend of an asset.
Of course, this is true for any indicator based on the VWAP, which calculates an average using past data.
Still, Volumatrix is superior in this realm as it enhances the VWAP in its calculation and its visualization, while it comes with many advanced features.
❓ Questions
If you have any questions, just ask them here or in the Volumatrix community.
📚 Terminology
Bearish Dots: Red dots appearing at the bottom of the Volumatrix indicator.
Bullish Dots: Green dots appearing at the bottom of the Volumatrix indicator.
EMA: Exponential Moving Average - Tracks the price of an asset over time while giving more importance to recent price data.
Volume: A measure of how much of a given asset has traded in a period.
VWAP: Volume Weighted Average Price - The ratio of the value traded to total volume traded over time.
VWAP Average: Represents the average of the VWAP waves in the Volumatrix indicator.
VWAP Wave: The colorful waves representing the enhanced VWAP in the Volumatrix indicator.
Zero Line: It’s the indicator’s baseline and determines the beginning and end of a certain trend.
🙏 Acknowledgments
First, we would like to thank TradingView & PineCoders for this fantastic platform and technology.
We are also very grateful to our loyal trading community for constantly supporting our efforts.
We are looking forward to continuously improving this indicator for you.

RSI Cross [xaurr]This is simple but profitable rsi cross strategy, to find optimal values you can change rsi and ema periods.
Good Luck!

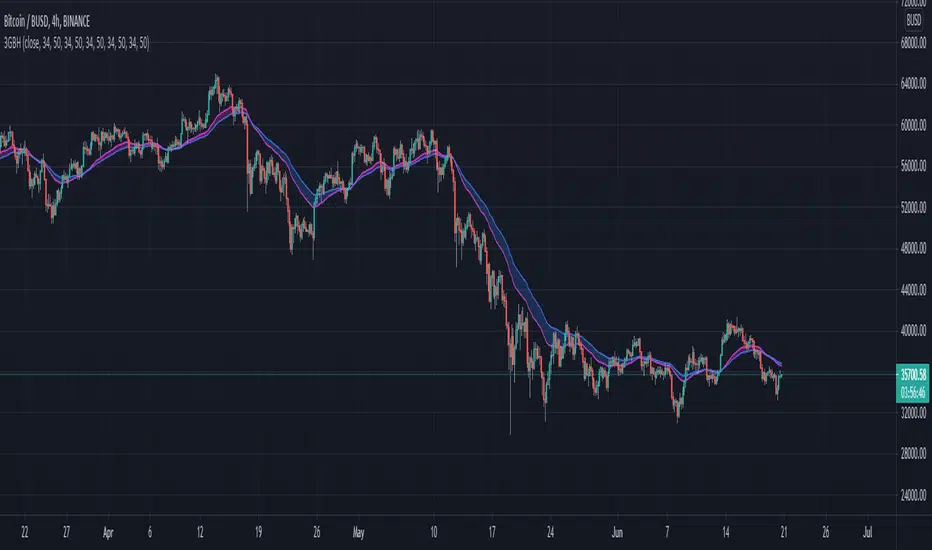
3GBH - Multiple MA'sIncluded in this indicator:
- Fast/Slow EMA's
- Fast/Slow SMA's
- Fast/Slow WMA's
- Fast/Slow HMA's
- Fast/Slow RMA's
-----
Use of of the type of Moving Averages.
Or use them all.
-----
User-friendly.
You can change all the inputs, they are labelled for ease-of-use.
You can toggle On/Off any or all of the options.
Know Sure Thing and EMA Strategy by JLXThis is a simple strategy based in Know Sure Thing indicator and an Exponential moving average,
Rules are as follow:
- You can go long when the KST cross signal bellow 0 and price closes above the target EMA
- You can go short when the KST cross signal above 0 and price closes bellow the target EMA
I include a trailing stop loss, default its 0.5%
Hope you enjoy it
