Fibonacci
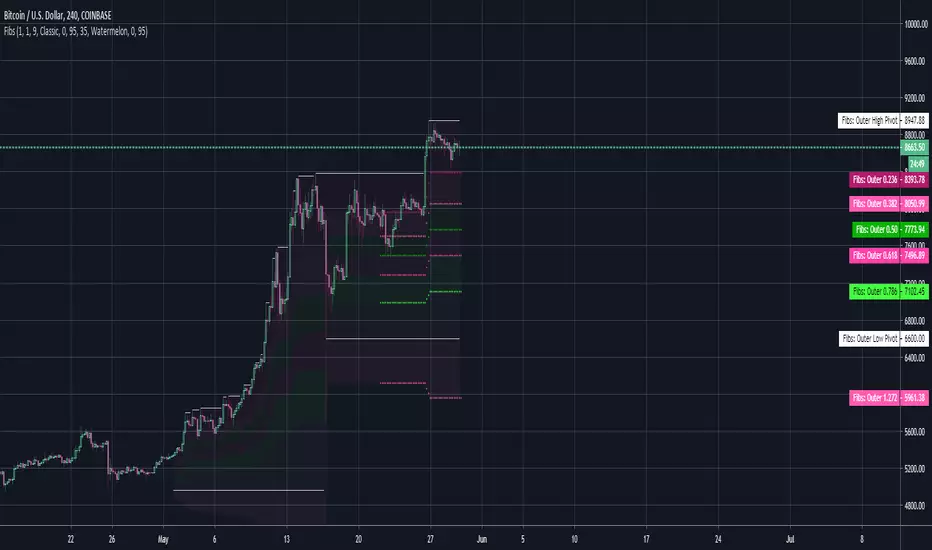
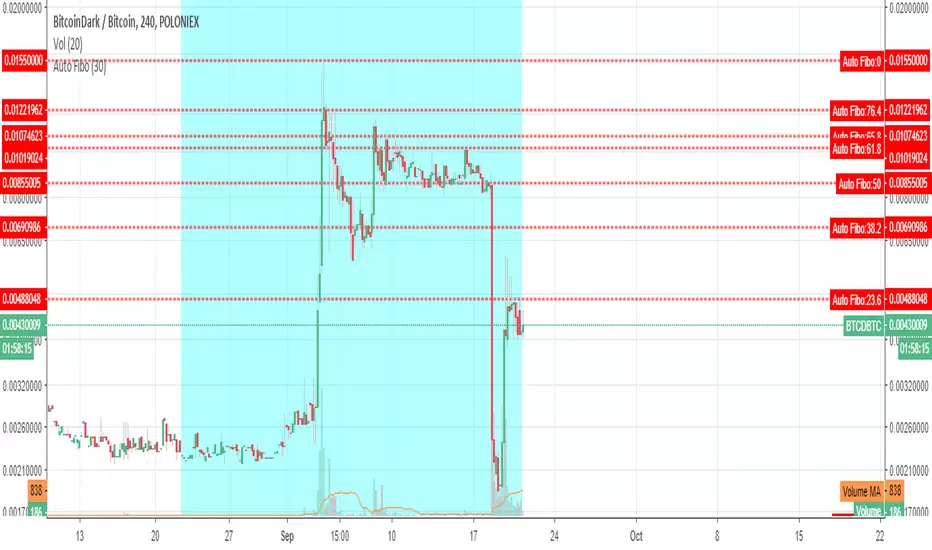
DrungleOG's Auto Fibs PVI got tired of manually using the Fib retracement tool on pivots. This little guy automates it for me. Does not have all levels in this version, mostly just the ones I use. Can add all later if there's interest.
23.6%
38.2%
50%
61.8%
78.6%
127.20%
You can have two sets of Fibs, Inner and Outer. Use the outer for the larger runs and the inner for smaller. The Fib lines have a look back view window of 48 bars and the base/resistance lines have 168 (a week's worth of time on the 1h). The lookback window is based on the view (show_last param) not the pivot calculations.
-DrungleOG
Fibonacci Oscillator PrototypePrototype Fibonacci stochastic oscillator for use on 1D, 4H, 1H, 30m, and 15m intervals.
Optional JMA (Jurik Moving Average) smoothing available in addition to SMA, EMA, RMA, WMA.
Parameters to auto-sync the the Security() request for the Fibonacci calculation is currently not functioning as intended; I would recommend using a Resolution/Timeframe Request of 1 day (the default) until I am able to address this issue.
Acknowledgments :
Heavily based upon "Daily Auto Fibonacci Tool" by @NeoButane ().
Credit to @Everget for his implementation of the JMA ().

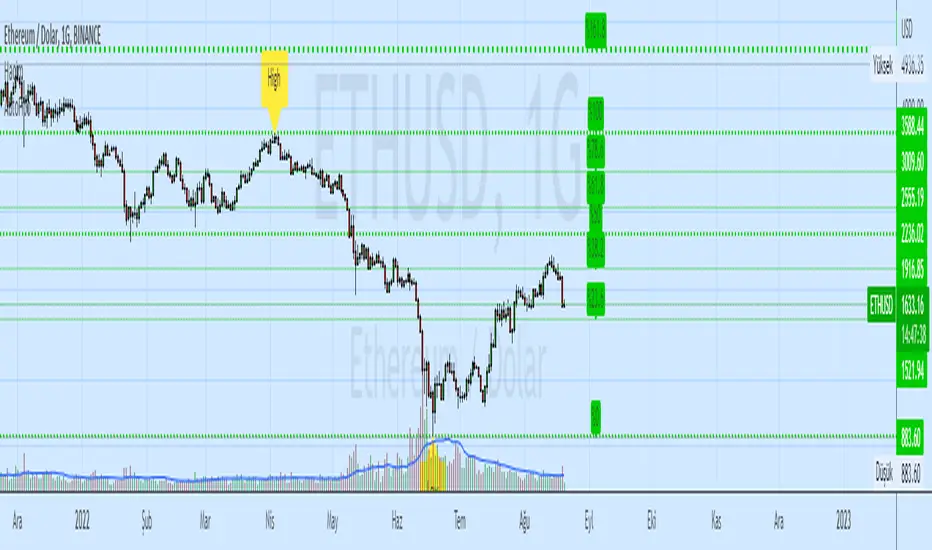
Fib Signals | -- MoonLaunchr --Script that can display signals against key Fibonacci levels based on highs and lows within a given time-frame
Set the number of days back in time that you would like the indicator to look for the high and low for calculating fibs.
Bear Market options include sub-level fibs within the 12.3% range - 38.2 and 61.8% 3 levels deep.
Signals when crossing over and under key fibs.
Set ALERTS for each key fib piercing.
Set ALERTS when new highs or lows are made.
All levels and signals can be displayed or hidden and customised within the indicator options.
Next candle price projection.
Bull Market key fib sub-levels will be added in the next update (top 12.8% sub-levels 1,2 & 3).
Happy trading!

MoonLaunchr Key Fibonacci Levels// Script that will display the Key Fibonacci levels.
// There are 2 use cases:
// 1. The highest and lowest prices within view are used by default (pinned to left).
//
// 2. Affix the indicator to the same axis as the price instrument in order to view the long-term state of play (previous 20,000 candles).
//----Set different candle period lengths in order to increase or reduce the amount of time that the indicator will reference back to.

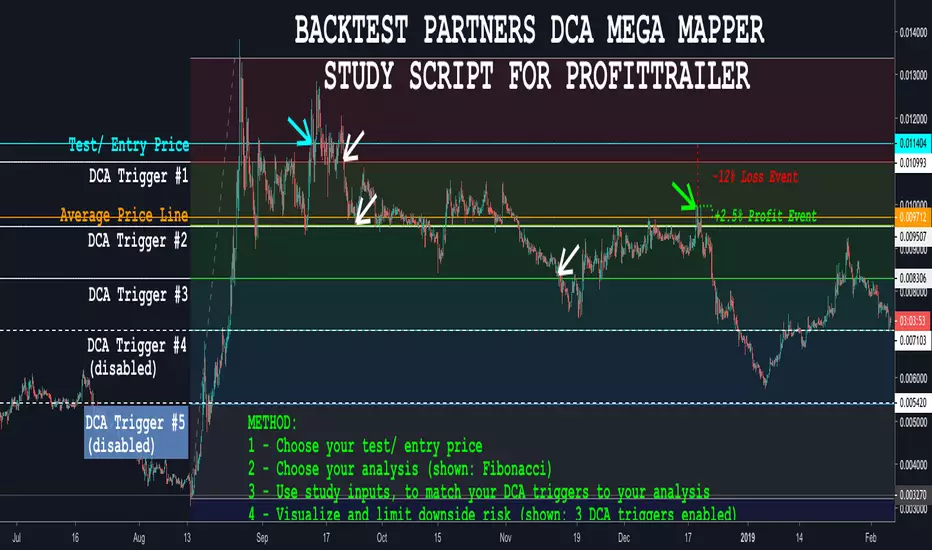
BACKTEST PARTNERS DCA MEGA MAPPER STUDY SCRIPT FOR PROFITTRAILERBacktest Partners Mega Mapper (BPMM) is an advanced DCA analysis script, allowing cryptocurrency traders to sync their ProfitTrailer trading bot buy levels, triggers and order sizes with their technical analysis charting results in TradingView.
For a complete functional demo, and to learn more about subscribing to this invite-only script, please visit us at backtest.partners
FibbyTenths I've been working on a new way to use Fibonacci number derived ratios. In a nutshell, after calculating line 1.000 (top secret info right there, haha) in the chart above, I multiplied by 2.618 which gives us the upper purple line. Next step is to find the difference in price between lines 1.000 and 2.618. Difference is then multiplied by tenths (i.e. 0.1, 0.2, 0.3, etc) and the results are subtracted from line 2.618 to create the rainbow. I'll release a more functional version of this script within a few days. Higher and lower levels will be added plus a surprise feature. In the mean time, I'd love to hear y'all's opinions on this here chart.

🤥 FibsDontLie Automatic Fibonacci by Cryptorhythms🤥 FibsDontLie Automatic Fibonacci by Cryptorhythms
Had a few requests for an auto fibonacci indicator. Nothing too ground breaking here, self explanatory options. Background color highlights when price close crosses a fib line. User can define the lookback range.
👍 Enjoying this indicator or find it useful? Please give me a like and follow! I post crypto analysis, price action strategies and free indicators regularly.
💬 Questions? Comments? Want to get access to an entire suite of proven trading indicators? Come visit us on telegram and chat, or just soak up some knowledge. We make timely posts about the market, news, and strategy everyday. Our community isn't open only to subscribers - everyone is welcome to join. t.me

Auto Fibonacci Bands for HarmonicAuto Fibonacci Bands for Harmonic
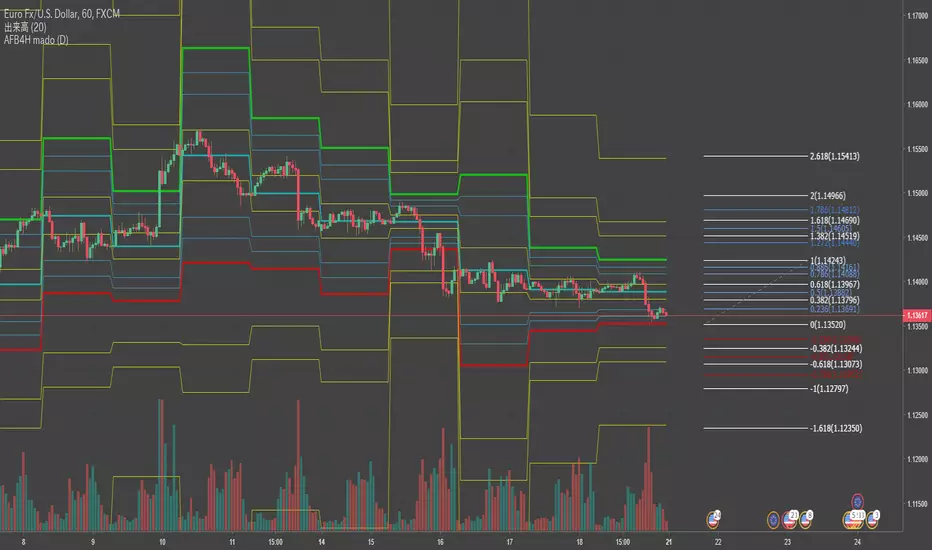
Previous day's High-Low based Fibonnacci Retracement(today's open=0.5 line)
follow series -1.618/-0.618/-0.382/0/0.118/0.286/0.386/0.5/0.682/0.786/0.886/1/1.382/1.618/2.618
it's for Harmonic:)
Chaos Fibonacci Bollinger Bands by ZekisBollinger Bands calculated with a Simple Moving Average and offsets with Fibonacci Retracement values (0.236; 0.382; 0.5; 0.618; 0.784 and 1) for a better support and resistance view, moves and a lot of TA (support and resistance, pivot points, reverse, breakouts...etc)
I colored each part of Fib. to see them clearly
Standard deviation and lenght of BB can be adjusted
Enjoy!
@Zekis

Auto Fibonacci S/R @robinraszkaThis script automatically plots Fibonacci Retracement levels between high and low of a period of your choosing. I usually trade H1/H4 charts, and it seems to line up really well in those timeframes.
Enjoy.
Auto Fibonacci S/R @robinraszkaThis script automatically plots Fibonacci Retracement levels between high and low of a period of your choosing. I usually trade H1/H4 charts, and it seems to line up really well in those timeframes.
Enjoy.

Fibonacci Pivot RangeThis is based on Fibonacci Pivot Points. I forked "CristianD CD_PivotR" code for this. Thanks
"Fibonacci Pivot Points start just the same as Standard Pivot Points. From the base Pivot Point, Fibonacci multiples of the high-low differential are added to form resistance levels and subtracted to form support levels."
Pivot Point (P) = (High + Low + Close)/3
Support 1 (S1) = P - {.382 * (High - Low)}
Support 2 (S2) = P - {.618 * (High - Low)}
Resistance 1 (R1) = P + {.382 * (High - Low)}
Resistance 2 (R2) = P + {.618 * (High - Low)}
Adding more support or resistance levels should be really easy.

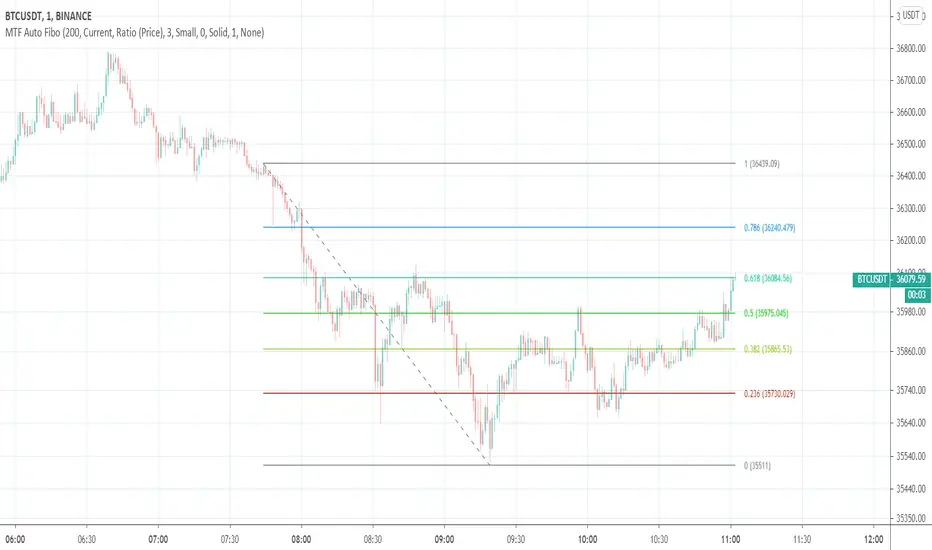
MTF Auto Fibonacci LevelsDear traders,
It is time to diversify and to "fibonaccify" my developer experience.
On the preview you can see the daily chart with fibo levels from 3h timeframe.
Features
24 Fibonacci levels
24 timeframes
Ability to customize levels
Ability to specify a preferred timeframe
Supported levels
0
0.236
0.382
0.5
0.618
0.786
1
1.272
1.414
1.618
2
2.272
2.414
2.618
3
3.272
3.414
3.618
4
4.236
4.272
4.414
4.618
4.764
Supported resolutions
"1"
"3"
"5"
"10"
"15"
"30"
"45"
"60"
"120"
"180"
"240"
"300"
"360"
"420"
"480"
"540"
"600"
"660"
"720"
"D"
"2D"
"3D"
"W"
"M"
LC Negative ImpulsesIndicator that shows positive impulses based on Fibonacci retracements. It is price action indicator that give you information about the magnitude of the current and past positive impulses any security.
It has a minimum magnitude line to help you to visualize the impulses over that magnitude.
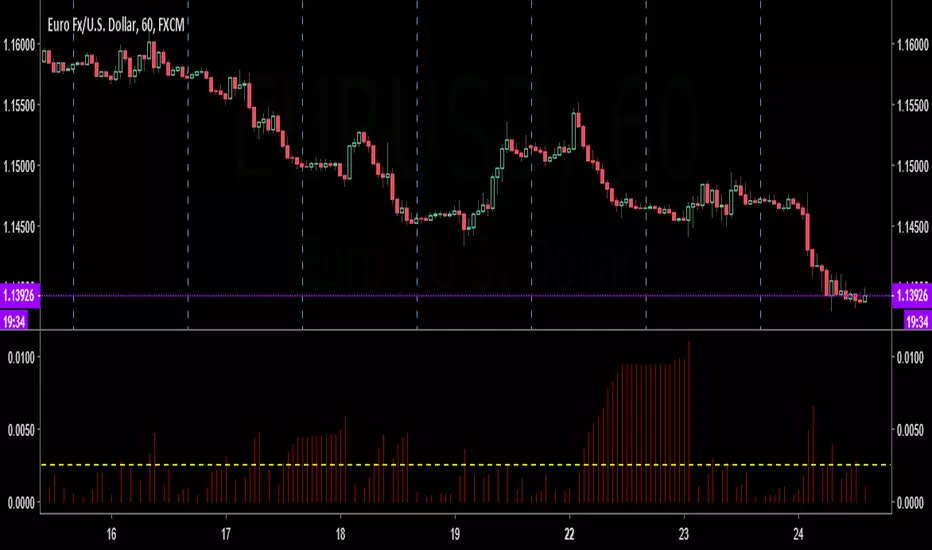
LC Positive ImpulsesIndicator that shows positive impulses based on Fibonacci retracements. It is price action indicator that give you information about the magnitude of the current and past positive impulses any security.
It has a minimum magnitude line to help you to visualize the impulses over that magnitude.

Librehash Moving Fibonacci IndicatorThe Zero_n0ncense Moving Fibs Indicator was designed to provide an “instant” application of the Fibonacci indicator overlay on a chart at any point in time, on any time frame in order to make it easier to see resistance and support points on the chart.
Support and Resistance Points
As you can see, the price has bounced against various points of the marked Fibonacci levels.
Rather than being based on the manual settings that can be drawn by users on TradingView, they are instead created by looking back at a certain number of periods and drawing the static (dynamic at the same time) levels from top to bottom.
This is different than prior applications of this indicator, which have essentially amounted to a slightly modified Donchian Channel.
How to Obtain This Indicator
If you’re interested in obtaining this indicator, just reach out to me via a private message and we can discuss further details on everything.

📊 Advanced Charts Suite v2.1 by 🇨🇷🇾🇵🇹🇴🇷🇹🇭🇾🇭🇲🇸📊With the advanced charts suite you get multiple indicators you can overlay on your charts, while only using one indicator slot.
🎁We made this after requests from our members, to assist those who use a free TV account. Its not advised to use them all at once, use them in combinations and see what works for you!
🕥 It can take a minute or more to load... be patient! I wanted to include more indicators, but hit some of the limits imposed by pine script. All options are off by default.
📊 Indicators Included are:
✅Ichimoku Cloud
✅Support Resistance Fractal
✅Trailing Long/Short Stoploss
✅Bull Bear Squares
✅Triple Hull Moving Average
✅Standard Hull Moving Average
✅Fibonacci Daily
✅Advance Decline Lines
👍If you enjoy the Charts Suite, please like the indicator, and follow me on TradingView!
💬Come chat with us in telegram (link in signature) if you have any questions or would like a trial of a premium indicators (linked below).

MTF MTF Fibonacci H LinesA Multi-Time-Frame and Core Trading Indicator for my next Fibonacci bitBull Bitcoin Bot. It Automatically draws Support and Resistance from the Golden Ratios found in the Fibonacci sequence. Also plots a Zig-Zag from the Highs and Lows of the selected Time-frames. xbtusd bitmex futures


Auto Fibonacci Retracement levels by BDmy english is not good for explanation, you can try and understand
automatic start finding by given length. draw automatic fibo. from lowest to highest. or from highest to lowest.

Auto Fibonacci Retracament Levels by evhar002This indicator/tool (Auto Fibo) draws Fibonacci Retracement Levels automatically on chart.
The algorithm of the Indicator Plots the extreme points and puts the retracement levels in order by itself with 100% sensitivity.
The key point is that to arrange the length of the "Days Back" to arrange the correct extreme points.
Like the other auto plotting tools, the levels can change when the time frame of the chart changes, in contrast with manually drawn Fibo levels.
In technical analysis , a Fibonacci retracement is created by taking two extreme points (usually a major peak and trough) on a stock chart and dividing the vertical distance by the key Fibonacci ratios of 23.6%, 38.2%, 50%, 61.8% and 100%.
Description copied from tr.tradingview.com and updated according to this script content.
Here's the link to a complete list of all my published indicators:
www.tradingview.com
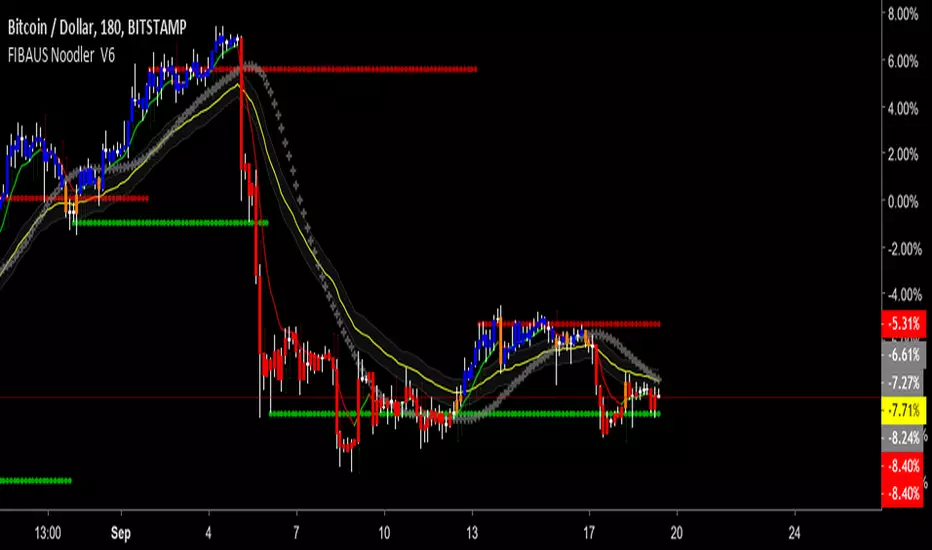
FIBAUS Noodler V6Named by my daughter, because of its early look like a bowl of noodles,the noodle analysis does a Harmonic and Fibonacci Analysis on price as it moves through time.
FEATURES
1.RESISTANCE AND SUPPORT - Finds Hidden and Fibonacci based R&S Levels, to assist with buying and selling targets.
2.SENTIMENT INDICATOR-A measure of human confidence and fear as it relates to price.
3.BANKERS GOLDEN NOODLE - A very specific institutional (banks, investment firms etc) calculation.
4.COLORED BARS - To show uptrend, uncertainty and downtrend.
Blue - Up-Trend/Breakout -(BUY/LONG)
Orange - Potential Trend reversal
Red - Downtrend (SELL/SHORT)
5.ALL markets anytime timeframe-(stocks, crypto, forex, futures ) application
FOR TRIAL ACCESS - 1. Follow me, 2. Like the script 3. Message me the words “I WANT IN NOW”.
BUY SIGNALS - 1.When Rapid Price Direction line crosses up the Sentiment Indicator
2.When Rapid Price Direction line crosses up the Bankers Golden Noodle
3. Candles Turn From Orange to Blue
SELL SIGNALS - 1.When Rapid Price Direction line crosses down the Sentiment Indicator
2.When Rapid Price Direction line crosses down the Bankers Golden
Noodle.
3. Candles Turn From Orange to RED
PRO Tips: 1. Remove candle borders for better visual of colored candles.
2. Make the Sentiment Line Transparent for less color on the chart
(Step 1:Double click on the script after applied to chart)
(Step 2:Click Inputs at the top of the menu and check the Color box)
3. Two more PRO BUY and SELL Techniques for free private chat members only.
FOR TRIAL ACCESS - 1. Follow me, 2. Like the script 3. Message me the words “I WANT IN NOW”
Happy Trading,
FIBAUS