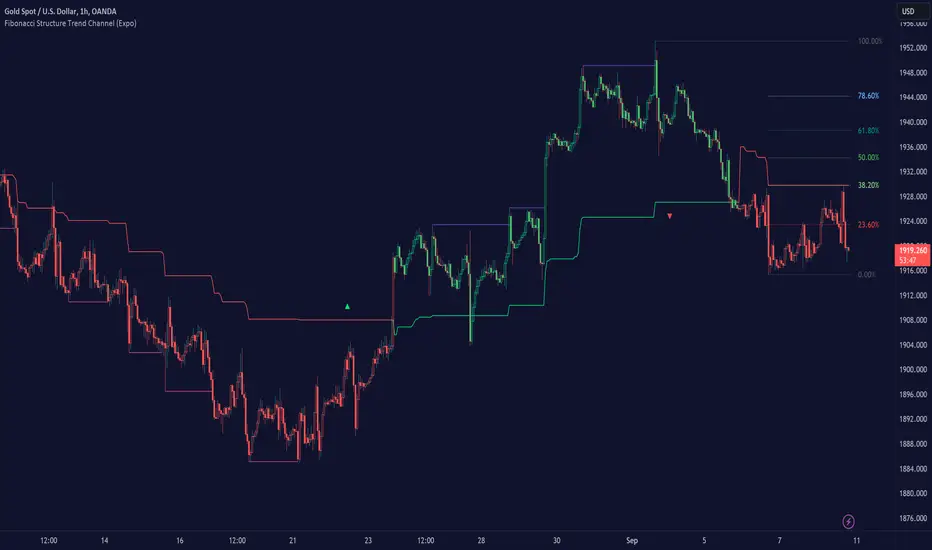
Fibonacci Structure & Trend Channel (Expo)█ Overview
The Fibonacci Structure & Trend Channel (Expo) is designed to identify trend direction and potential reversal levels and offer insights into price structure based on Fibonacci ratios. The algorithm plots a Fibonacci channel, making it easier for traders to identify potential retracement points. Additionally, the Fibonacci market structure is plotted to enhance traders' understanding of the underlying order flow.
█ How to Use
Identify Trends
Use the plotted Fibonacci Trend Line to identify the direction of the market trend. A green line typically signifies a bullish trend, while a red line signifies a bearish trend.
Retracement Levels
The plotted Fibonacci levels can act as potential support or resistance levels. Look for price action signs at these levels for entry or exit points.
Channel Trading
If you enable the Fibonacci channel, the upper and lower bounds can act as overbought or oversold levels.
Market Structure
The plotted Fibonacci market structure serves as a valuable tool for dissecting the underlying order flow and gauging the strength or weakness of a trend. By analyzing these structures, traders can identify key levels where supply and demand intersect, which often act as pivotal points for trend reversals or accelerations. This visual representation simplifies complex market dynamics. Whether you're looking to catch a new trend early or seeking confirmation for a potential reversal, understanding the market structure plotted by the Fibonacci ratios can provide actionable insights for various trading strategies.
Use the Table
The information table can provide quick insights into the current trend and when it started.
█ Settings
The Fibonacci settings allow traders to specify the Fibonacci retracement levels that will be used to calculate the trend and its channel.
The Fibonacci Structure Trend Channel structure settings enable traders to fine-tune how the indicator identifies and plots the underlying price structure.
-----------------
Disclaimer
The information contained in my Scripts/Indicators/Ideas/Algos/Systems does not constitute financial advice or a solicitation to buy or sell any securities of any type. I will not accept liability for any loss or damage, including without limitation any loss of profit, which may arise directly or indirectly from the use of or reliance on such information.
All investments involve risk, and the past performance of a security, industry, sector, market, financial product, trading strategy, backtest, or individual's trading does not guarantee future results or returns. Investors are fully responsible for any investment decisions they make. Such decisions should be based solely on an evaluation of their financial circumstances, investment objectives, risk tolerance, and liquidity needs.
My Scripts/Indicators/Ideas/Algos/Systems are only for educational purposes!
Fibonacci
Fibonacci LevelsDescription
It is used to create Fibonacci levels based on the backward 120/240/360 bar and to detect the bottoms and peaks in that range. The feature can be used by traders who trade at support and resistance. Showing 3 different levels retrospectively in the same time period allows support and resistance levels to be easily seen.
Gray Levels: Gives Fibonacci levels based on the 120 bar time frame.
Blue Levels: Gives Fibonacci levels based on the 240 bar time frame.
White Levels: Gives Fibonacci levels according to the 360 bar time frame.
Top Red Levels: Gives peak levels of 21/28/60/90...300/330/360 bars.
Bottom Blue Levels: Gives bottom levels of 21/28/60/90...300/330/360 bars.
Usage
Where the lines are concentrated can serve as good support and resistance. In this case, it would be quite logical to try a position.
For trend corrections, 38.2%/50%/61.8% Fibonacci levels can be followed as strong support.
Different
Seeing the levels of certain retrospective periods together makes it easier to understand where the trend will turn or correct. It also provides simplicity in use with different indicators by being outside of the timeframe.
Works Well Together
Using it together with the "Bollinger Levels" indicator is very useful for taking better positions.
Version
v1.0

High/Low Fibs using Bullish Anchors I do Love me some fibs!!
i used a lot of 30 min Opening Range Fibs for interday trading, but have found that using more bars back can make for stronger levels just like when we use higher time frame to see support & resistant levels.
You can just find high and lows for making an easy auto draw fib retracment, I think you will find these to be fairly accurate or at least just entertaining .
Here are some basics on how to use FIb Retracments
Fibonacci retracement is a popular technical analysis tool used by traders to identify potential levels of support and resistance in financial markets, including stocks. It is based on the Fibonacci sequence, a series of numbers where each number is the sum of the two preceding ones (e.g., 0, 1, 1, 2, 3, 5, 8, 13, 21, ...). The key Fibonacci retracement levels are 23.6%, 38.2%, 50%, 61.8%, and 78.6%. These levels are used to identify potential reversal points or areas of price consolidation. Here's how to use Fibonacci retracement in stock trading:
1. Identify a Significant Price Move:
Start by identifying a significant price move in the stock you are analyzing. This move can be either an uptrend or a downtrend. For uptrends, you'll be measuring from the low point to the high point, and for downtrends, you'll measure from the high point to the low point.
2. Draw Fibonacci Levels: *With this indicator We do this for you
Once you have identified the price move, use a Fibonacci retracement tool available on most trading platforms to draw the retracement levels. Typically, you will draw lines from the low point to the high point for uptrends and vice versa for downtrends.
3. Analyze Key Levels:
Pay attention to the key Fibonacci retracement levels, especially the most commonly used ones, which are 38.2%, 50%, and 61.8%. These levels are considered significant in determining potential support and resistance areas. The 23.6% and 78.6% levels are also used but are considered secondary.
4. Look for Confluence:
Consider other technical analysis tools and indicators to look for confluence at these Fibonacci retracement levels. For example, if a 50% retracement level coincides with a moving average or a trendline, it may strengthen the level's significance.
5. Monitor Price Action:
Watch how the stock's price reacts when it approaches these Fibonacci retracement levels. If the price stalls, reverses direction, or shows signs of consolidation around a particular level, it may act as support or resistance.
6. Set Entry and Exit Points:
Based on your analysis, you can set entry and exit points for your trades. Traders often look for buying opportunities near Fibonacci support levels and selling opportunities near resistance levels. Stop-loss orders can be placed just below support or above resistance levels to manage risk.
7. Practice Risk Management:
Always use proper risk management techniques in your trading. This includes setting stop-loss orders, determining your position size, and not risking more than you can afford to lose on a single trade.
8. Monitor Market Conditions:
Be aware that Fibonacci retracement levels are not foolproof and should be used in conjunction with other analysis methods and market conditions. Market sentiment, news events, and economic factors can also influence stock prices.
9. Continuously Learn and Adapt:
As with any trading strategy, it's essential to continuously learn and adapt. Test the effectiveness of Fibonacci retracement levels on different time frames and with different stocks to refine your trading strategy.
** Special Thanks to @KioseffTrading for doing most all of the HEAVY LIFTING on the code here... he is beyond a Top G!!
FVG w/ Fibs [QuantVue]The "FVG w/ Fibs" indicator is a trading tool designed to identify and visualize Fair Value Gaps (FVGs) while overlaying two Fibonacci retracement levels.
• Bullish FVG: Occurs when the low of the current bar is higher than the high of two bars ago, and the previous close is higher than the high of two bars ago.
• Bearish FVG: Occurs when the high of the current bar is lower than the low of two bars ago, and the previous close is lower than the low of two bars ago.
The indicator filters these gaps based on user-defined criteria such as the minimum percentage size of the gap.
Once identified, these FVGs are highlighted on the chart using customizable boxes and the 50% and 61.8% (default settings) Fibonacci retracement levels are calculated and drawn based on the size of the identified FVG.
• Dynamically updates and extends the boxes as the price evolves.
• Alerts / visual changes for FVGs that get filled.
• User option for fills by Wicks or Close
• User-customizable settings for box colors, styles, and Fibonacci level appearances
Give this indicator a BOOST and COMMENT your thoughts!
We hope you enjoy.
Cheers!

Auto Fibonacci Levels [MisterMoTA]Using Auto Fibonacci Levels indicator users can find automatically Fibonacci Extension points where price can go after a period of consolidation (sideways or can find points for support/resistance on retracement levels that can be displayed for any defined range.
The script is different from others by letting users to define a consolidation range, user can input the time when range ends and the number of candles for looking back from the defined time, default value is 16 candles.
Users have total control over range definitions, fibonacci numbers, colors and option to show or hide the lines.
The user can choose to display Fibomacci Bullish Expansion levels and also Fibonacci Bearish Expansion level.
After a move hit a resistance or support can be choosed a range to find retracement levels, Bullish or Bearish retracement levels can be displayed checking the options from the indicator pannel.
Here are few examples of usage:
1. Bullish expansion (extension)
2. Bearish expansion (extension)
3. Bullish Retracement
4. Bearish Retracement
The indicator can be used on any timeframe for any pairs, stocks, crypto, forex.

CC Trend strategy 2- Downtrend ShortTrend Strategy #2
Indicators:
1. EMA(s)
2. Fibonacci retracement with a mutable lookback period
Strategy:
1. Short Only
2. No preset Stop Loss/Take Profit
3. 0.01% commission
4. When in a profit and a closure above the 200ema, the position takes a profit.
5. The position is stopped When a closure over the (0.764) Fibonacci ratio occurs.
* NO IMMEDIATE RE-ENTRIES EVER!*
How to use it and what makes it unique:
This strategy will enter often and stop quickly. The goal with this strategy is to take losses often but catch the big move to the downside when it occurs through the Silvercross/Fibonacci combination. This is a unique strategy because it uses a programmed Fibonacci ratio that can be used within the strategy and on any program. You can manipulate the stats by changing the lookback period of the Fibonacci retracement and looking at different assets/timeframes.
This description tells the indicators combined to create a new strategy, with commissions and take profit/stop loss conditions included, and the process of strategy execution with a description of how to use it. If you have any questions feel free to PM me and boost if you found it helpful. Thank you, pineUSERS!
CHEATCODE1

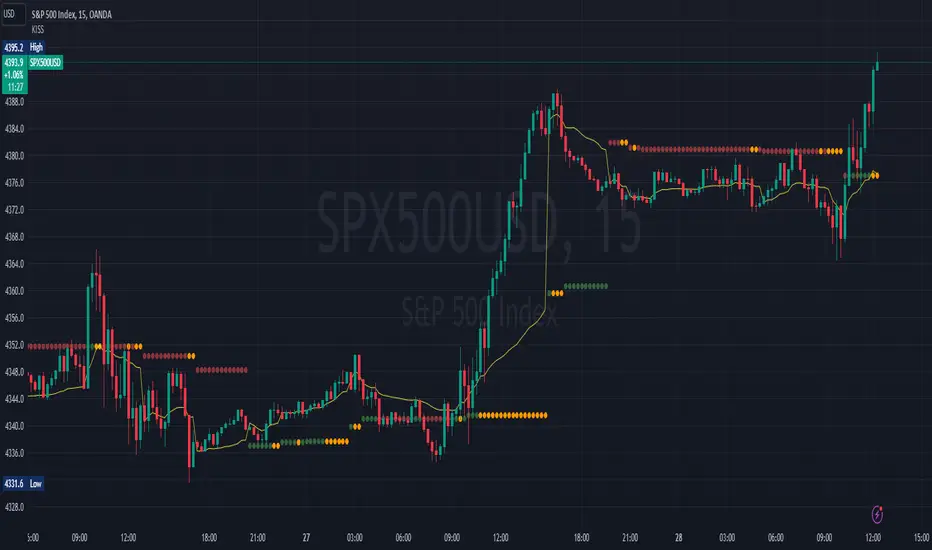
Price Action Box RetracementsThe Price Action Box Retracements Indicator offers a fresh perspective on price analysis, departing from the conventional fixed-length lookback period commonly used in trading indicators. This indicator embraces a more flexible and adaptable approach, taking into account changes in price action behavior and avoiding overfitting. With a design philosophy rooted in the principle of "Keep it simple, stupid!" (KISS), this indicator allows users to customize just one variable: Price Box Size.
Imagine the price action as a journey within a box or channel, defined by significant pivots from the past that act as support and resistance levels. The Price Action Box Retracements Indicator visualizes the midpoints between these pivots, representing half-point retracements. By adjusting the "Price Box Size" variable, users can select the size of the price action box that the script will identify on the chart. A larger value will look for a larger box/channel, meaning the price will stay within it for a longer duration. Think of it as switching to a slower timeframe without changing the chart resolution.
The indicator plots a median line within the price action box, which changes color based on the position of the price action within the box. When the price action is trading below the median, the line is displayed in red, indicating a potential for short entries. Conversely, when the price action is above the box median, the line turns green, suggesting opportunities for long entries. An orange color is used when the price action breaks outside the box, signaling the start of a new trend or a measured move where the box size is expected to double.
Sudden changes in the median location are crucial signals that the price action has broken outside its previous box and created a new one. Usually, the price action will attempt to return back and test its old box boundaries or median (support/resistance) before continuing further. If the new box is positioned above the previous one, it indicates an upward channel (uptrend), while a box below the previous one suggests a descending channel (downtrend). A flat median line represents a ranging market, where the price action lacks a clear directional bias.
In addition to the median plot, the script also offers a pivot-anchored moving average, assisting traders in identifying smaller trends and potential entry points within a larger price action box.
Experience a new approach to price analysis with the Price Action Box Retracements Indicator and enhance your trading strategies with simplicity and flexibility.
Fibonacci Levels on Any Indicator [By MUQWISHI]▋ INTRODUCTION :
A “Fibonacci Levels on Any Indicator” can be applied to any indicator to draw Fibonacci levels based on provided conditions of two price points to produce a sequence of horizontal line levels starting from 0% to 100% in addition to extension levels. The 0% level is measured as the start of retracement, while the 100% level is the beginning of the extension levels. This tool was developed to be easy to add to any indicator, and it could be valuable to some traders in terms of managing trades by setting targets and reducing risk in the trend direction.
_______________________
▋ USAGE:
➤ NEEDS TO IDENTIFY 4 ELEMENTS:
1. Starting Point. What’re the conditions / When will the drawing of the Fibonacci levels begin?
2. Ending Point. What’re the conditions / When will the drawing of the Fibonacci levels end?
3. High Point. What is the price for a 100% Fibonacci level (0% for the downside)?
4. Low Point. What is the price for a 0% Fibonacci level (100% for the downside)?
➤ STARTING & ENDING POINTS CONDITIONS:
Need to specify the condition when the drawing of Fibonacci levels starts and ends, and the indicator shows different prepared conditions.
New Phase: Import a value (plot) from an existing indicator, where its status changes from NaN to a real number.
Crosses Above/Below: Import a value(1) (plot) from an existing indicator, where it crosses above/below value(2).
Reversal Up/Down: Import a value(1) (plot) from an existing indicator, where it rises/decreases than the previous value(1).
First/Last Bar: Useful to draw stationary Fibonacci levels.
➤ UPPER & LOWER PIVOTS (0% & 100%):
Need to specify the two price points representing 0% & 100% Fibonacci levels to expose the sequence of Fibonacci lines.
Upper Pivot. By default, the ATR Upper Band. It’s possible to import a custom value from an existing indicator.
Lower Pivot. By default, the ATR Lower Band. It’s possible to import a custom value from an existing indicator.
➤ FIBONACCI STYLING OPTIONS:
Ability to customize line & label style, color, reverse, and hide/show levels.
_______________________
▋ IMPLEMENTATION:
Here are some examples of implementing the indicator.
Note: All presented examples below are for demonstration purposes, and they're not trading suggestions.
# Example 1: (Reversal Up/Down)
We want to implement Fibonacci levels on the Hull MA by mohamed982 . Our requirements are as follows:
Fibonacci levels start when the Hull MA reverses up.
Fibonacci levels end when the Hull MA reverses down.
Upper Pivot is the ATR Upper Band.
Lower Pivot is the ATR Lower Band.
After adding the required indicator (Hull MA), here’re the implementation and results
# Example 2: (Crosses Above/Below)
We want to implement Fibonacci Level on the Squeeze Momentum by LazyBear . Our requirements are as follows:
Fibonacci levels start when the Squeeze Momentum histogram crosses above 0.
Fibonacci levels end when the Squeeze Momentum histogram crosses below 0.
Upper Pivot is the Bollinger Upper Band.
Lower Pivot is the Bollinger Lower Band.
After adding the required indicators (Squeeze Momentum & Bollinger Band), here’re the implementation and results
# Example 3: (Crosses Above/Below)
We want to implement Fibonacci Level on the Crossing Moving Averages. Our requirements are as follows:
Fibonacci levels start when the 20-EMA crosses above 100-MA.
Fibonacci levels end when the 20-EMA crosses below 100-MA.
Upper Pivot is the ATR Upper Band.
Lower Pivot is the ATR Lower Band.
After adding the required indicators (20-EMA & 100-MA), here’re the implementation and results
# Example 4: (New Phase: When the previous value is NaN, and the current value is a real number.)
We want to implement Fibonacci Level on the Supertrend. Our requirements are as follows:
Fibonacci levels start when an up-Supertrend (green) line shows up.
Fibonacci levels end when a down-Supertrend (red) line shows up.
Upper Pivot is the down-Supertrend.
Lower Pivot is the up-Supertrend.
After adding the required indicator (Supertrend), here’re the implementation and results
# Example 5: (First/Last Bar)
We want to implement Fibonacci Level between two points, 330 & 300. Our requirements are as follows:
Fibonacci levels start at first bar on the chart.
Fibonacci levels end at last bar on the chart.
Upper Pivot is 330.
Lower Pivot is 300.
Here’re the implementation and results.
To customize the number of bars back (like 50 bars)
_______________________
▋ Final Comments:
The “Fibonacci Levels on Any Indicator” is made to apply on other indicators for planning Fibonacci Levels.
It can be implemented in different ways, along with presented examples.
This indicator does not work with plots that were developed by drawing classes.
Please let me know if you have any questions.
Thank you.

MonkeyblackmailThis script consists of several sections. test it and tell me your concerns. a lot of more works will be done
Volume Accumulation : The first part of the script checks for a new 5-minute interval and accumulates the volume of the current interval. It separates the volume into buying volume and selling volume based on whether the closing price is closer to the high or low of the bar.
Volume Normalization and Pressure Calculation : The script then normalizes the volume with a 20-period EMA, and calculates buying pressure, selling pressure, and total pressure. These calculations provide insight into the underlying demand (buying pressure) and supply (selling pressure) conditions in the market.
RSI Calculation and Overbought/Oversold Conditions : The script calculates the RSI (Relative Strength Index) and checks whether it is in an overbought (RSI > 70) or oversold (RSI < 30) state. The RSI is a momentum indicator, providing insights into the speed and change of price movements.
Volume Condition Check and Wondertrend Indicator : The script checks if the volume is high for the past five bars. If it is, it applies the Wondertrend Indicator, which uses a combination of the Parabolic SAR (Stop and Reverse) and Keltner Channel to identify potential trends in the market.
Swing High/Low and Fibonacci Retracement : The script identifies swing high and swing low points using a specified pivot length. Then, it draws Fibonacci retracement levels between these swing high and swing low points.
he monkeyblackmail script works well in the 5 minutes chart and combines several elements of technical analysis, including volume analysis, momentum indicators, trend-following indicators, volatility channels, and Fibonacci retracements. It aims to provide a comprehensive view of the market condition, highlighting key levels and potential trends in an easily understandable format. Don’t be too quick to start trading with it, first study how it work and you will blackmail the market.

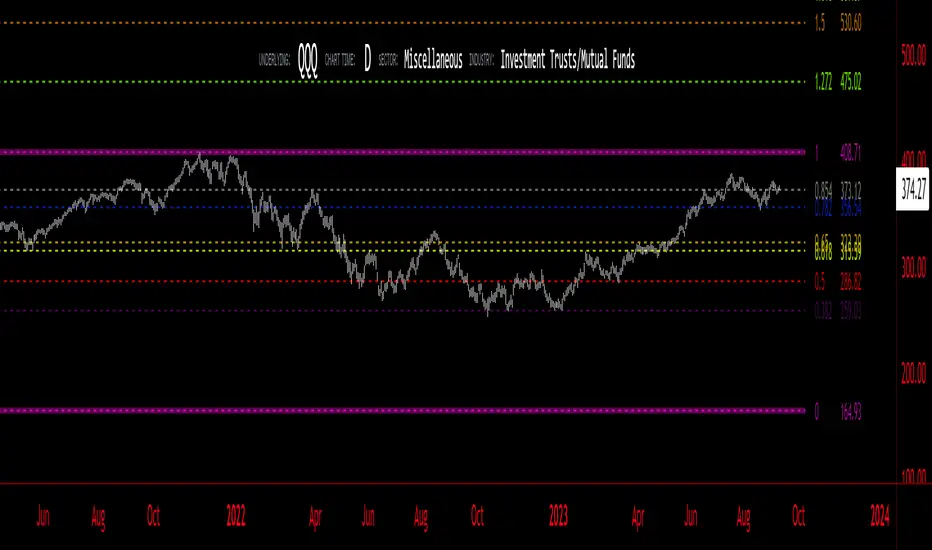
Custom Fib by Dr. MauryaThis indicator is based on purely Fibonacci levels.
How it works:
Let's first understand the Fibonacci levels.
The main Fibonacci numbers are 0, 0.236, 0.392, 0.5, 0.618, 0.764, 1 whereas 0 equal to low and 1 equal to high.
As the market is moving in any direction, new lows or new highs are developing and hence Fibonacci levels are also changing throughout the time.
Sometime market retraces from various levels like 0.5, 0.618/0.382(mirror value), 0.762/0.236 (mirror value).
Retracement : The three mid-level 0.382, 0.5 and 0.618 are act as a retracement or like pivot levels for market. These levels are filled with green and red colors to attention the buyers and sellers to take a trade either side if any candlestick pattern are observed at these levels.
one direction trend takes support of 0.236/0.786(mirror value) (blue line in chart)
Sometime buy/sell on dip levels are happen at 0.762/0.392 (mirror value).
Targets: Target could be Fibonacci extension level lowest targets (1, 1.18, 1.23,), medium targets (1.39, 1.5, 1.61) and large target (2.0, 2.5.2.61, 3.0) as depended on your study volume levels and trend strength.
Stoploss: You can choose any preceding lines for stoploss: e.g. if you enter long on 0.618 or 0.5 levels you can set SL on 0.762
Previous day three mid-point 0.382, 0.5, 0.618 (filled with red and green color) as well as high and low could also act as resistance or support levels for current day market.
Lets understand the Input section of indicator
The first input section allowed to choose where you want to start developing Fibonacci : select session for intraday then weekly, monthly and yearly options are available.
Now you can set any Fibonacci levels (as you wish) you can set upto 20 levels.
By default, total 7 Fibonacci levels are plotted (0, 0.236, 0.392, 0.618, 0.762 and 1.
Further you can set Fibonacci extension level for long side (1.18, 1.23, 1.39, 1.5, 1.61, 2 etc).
You must be careful when you enter Fibonacci extension level lower side (short side). You need to enter value -0.5 (equal to 1.5 for long). -0.618 (equal to 1.618 for long), -1(equal to 2.0 for long).
You can fill color between any two adjacent lines from style sections.
You can also select labels from input tab if you want to see Fibonacci numbers on chart as labels.
You can also shift the labels from current bar to desired offset bar by changing the value in input section.
Conclusion
This indicator is highly customisable developing Fibonacci levels because everyone and different scripts works on different fib levels.
This indicator keeps the Fibonacci levels at a particular time and it plots only new lines when new low or high established without affecting the previous Fibonacci levels. Overall, as the market moves, you will find the trending plot goes which side.

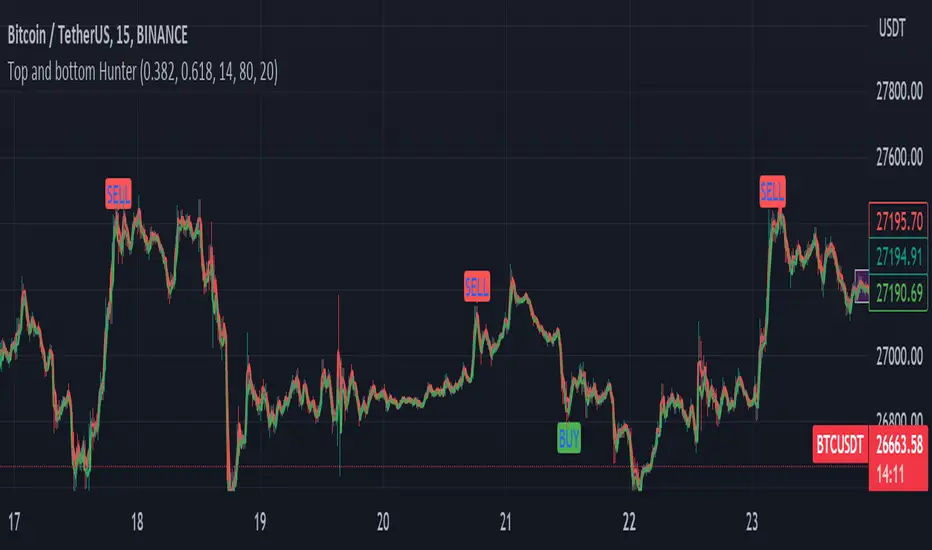
Fib top and bottom Hunter - No Repaint "Top and bottom Hunter" indicator combines two popular technical analysis tools, Fibonacci retracement levels and the Relative Strength Index (RSI), to identify potential trading opportunities in the market.
Fibonacci retracement levels are based on the Fibonacci sequence, a mathematical series where each number is the sum of the two preceding ones. In trading, Fibonacci retracement levels are used to identify potential support and resistance levels based on the recent price action. The indicator uses two Fibonacci levels, fib_0 and fib_1, which are typically set to 0.382 and 0.618, respectively. These levels represent common retracement ratios.
To calculate the Fibonacci levels, the indicator considers the highest and lowest prices within a specified range, typically the highest and lowest of the last two bars. It calculates the fib_range, which is the difference between the highest and lowest prices. Then, fib_level_0 and fib_level_1 are determined by subtracting the Fibonacci ratios from the highest price.
The RSI is a momentum oscillator that measures the speed and change of price movements. It helps identify overbought and oversold conditions in the market. The RSI parameters used in this indicator are rsi_length (length of the RSI calculation), rsi_overbought (upper threshold indicating overbought conditions), and rsi_oversold (lower threshold indicating oversold conditions). The RSI value is calculated based on the closing prices.
The indicator generates buy and sell signals based on specific conditions:
Buy Condition: A buy signal is triggered when the RSI crosses above the oversold level (rsi_oversold) and the closing price is higher than fib_level_1. This indicates a potential reversal or bounce from the Fibonacci support level.
Sell Condition: A sell signal is triggered when the RSI crosses below the overbought level (rsi_overbought) and the closing price is lower than fib_level_0. This suggests a potential reversal or pullback from the Fibonacci resistance level.
In summary, this indicator combines the power of Fibonacci retracement levels and the RSI to identify potential trading opportunities. It helps traders find confluence between the Fibonacci support or resistance levels and the RSI readings, indicating potential trend reversals or bounces. Traders can use this information to make informed decisions about entering or exiting positions in the market.
Feel free to change the settings for what works best for you and use this with other confluences. I personally use RSI overbought and oversold values as 80 and 20
The Golden Candlestick PatternThe Golden pattern is a three-candlestick configuration based on a variation of the golden ratio (2.618) from the Fibonacci sequence.
The bullish Golden pattern is composed of a normal bullish candlestick with any type of body, followed by a bigger bullish candlestick with a close price that is at least 2.618 times the size of the first candlestick (high to low). Finally, there must be an important condition that is, a third candlestick that comes back to test the open of the second candlestick from where the entry is given.
The bearish Golden pattern is composed of a normal bearish candlestick with any type of body, followed by a bigger bearish candlestick with a close price that is at least 2.618 times the size of the first candlestick (high to low). Finally, there must be an important condition that is, a third candlestick that comes back to test the open of the second candlestick from where the entry is given.

Dual Dynamic Fibonacci Retracement — Long and Short Duration
Title : "The Dual-Dynamic Fibonacci Retracement Script: An Advanced Tool for Comprehensive Market Analysis"
As the author of the "Dual-Dynamic Fibonacci Retracement Script", I am delighted to introduce you to this cutting-edge tool for technical analysis. Unlike conventional Fibonacci scripts, this advanced model incorporates multiple unique features and adjustments that make it a powerful asset for any market analyst. Whether you're dealing with forex, commodities, equities or any other market, this script is versatile enough to enhance your trading strategy.
Uniqueness & Differentiation:
The "Dual-Dynamic Fibonacci Script" stands out by offering two distinct lookback periods. This feature is what separates it from other scripts available in the market. The first lookback period is longer, focusing on capturing broader market trends. The second lookback period is shorter, allowing for a more granular analysis of near-term market fluctuations. This dual perspective provides a more comprehensive view of the market, allowing you to see both the forest and the trees at the same time.
Fibonacci Levels:
While offering the standard Fibonacci retracement levels (0.236, 0.382, 0.5, 0.618, 0.786, and 1.0), the script also gives you the ability to plot 0.114 and 0.886 levels. These additional levels offer an extra layer of depth to your analysis, and can prove crucial in high-volatility markets where they often serve as significant support and resistance points.
Customizable Line Shifts and Extends:
This script provides options for customization of the shift and extension of the plotted lines. This means you can adjust the start and end points of the Fibonacci lines according to your personal trading style and strategy. This level of personalization is not typically available in other scripts, and it allows for a more tailored visual representation.
Flexible Trading Positioning:
Depending on whether the closing price is above or below the midpoint of the pivot high and pivot low, the Fibonacci retracement levels are adjusted accordingly. This ensures the script remains relevant and useful regardless of market conditions.
Clean Visualization:
To prevent clutter and maintain focus on the most relevant price action, the script removes old Fibonacci lines and plots new ones once a new pivot high or low is identified. This clean visualization helps keep your analysis focused and sharp.
How to Use the Script:
To get started, simply adjust the lookback periods according to your trading strategy. If you're a long-term investor or prefer swing trading, a longer lookback period might be appropriate. Conversely, if you're a day trader, a shorter lookback period might be more beneficial.
The "Shift" and "Extend" inputs allow you to control the positioning of the Fibonacci lines on your chart. Positive values shift the lines to the right, while negative values shift them to the left.
You also have the choice to plot the additional Fibonacci levels (0.114 and 0.886) via the "Plot 0.114 and 0.886 levels?" input. Similarly, the "Plot second set of levels?" input lets you decide whether to display the second set of Fibonacci levels derived from the shorter lookback period.
Like any technical analysis tool, this script is most effective when used in conjunction with other indicators and methods of analysis. It is designed to work well in trending markets, where Fibonacci retracements can often indicate potential reversal levels. However, it's always recommended to use a holistic approach to market analysis to maximize the likelihood of successful trades.
Note: the two lines drawn on the chart are there to help the user identify the levels from which the two respective Fib sequences are calculated.
~~~
Input Explanations:
Long Period Pivot High/Low Lookback and Short Period Pivot High/Low Lookback : These settings determine the length of the lookback periods for the long-term and short-term pivot points, respectively. A pivot point is a technical analysis indicator used to determine the overall trend of the market over different time frames. The pivot points are then used to calculate the Fibonacci levels. A longer lookback period will identify pivot points over a broader time frame, capturing major market trends, while a shorter lookback period will identify pivot points over a narrower time frame, capturing more immediate market movements.
Long Period Fibonacci Level Shift and Short Period Fibonacci Level Shift : These inputs control the shift of the Fibonacci levels based on the long and short lookback periods, respectively. If you want to shift the Fibonacci levels to the right, increase the value. If you want to shift the Fibonacci levels to the left, decrease the value. This allows you to adjust the Fibonacci levels to better align with your analysis.
Long Period Fibonacci Level Extend and Short Period Fibonacci Level Extend : These inputs control the extension of the Fibonacci levels based on the long and short lookback periods, respectively. If you want the Fibonacci levels to extend further to the right, increase the value. If you want the Fibonacci levels to extend less to the right, decrease the value. This feature provides the flexibility to adjust the length of the Fibonacci levels according to your personal trading preferences and strategy.
Plot 0.114 and 0.886 levels? : This setting gives you the ability to plot the additional 0.114 and 0.886 Fibonacci levels. These levels provide extra depth to your analysis, particularly in highly volatile markets where they can act as significant support and resistance levels.
Plot second set of levels? : This input allows you to decide whether to plot the second set of Fibonacci levels based on the short lookback period. Displaying this second set of levels can provide a more granular view of market movements and potential reversal points, enhancing your overall analysis.

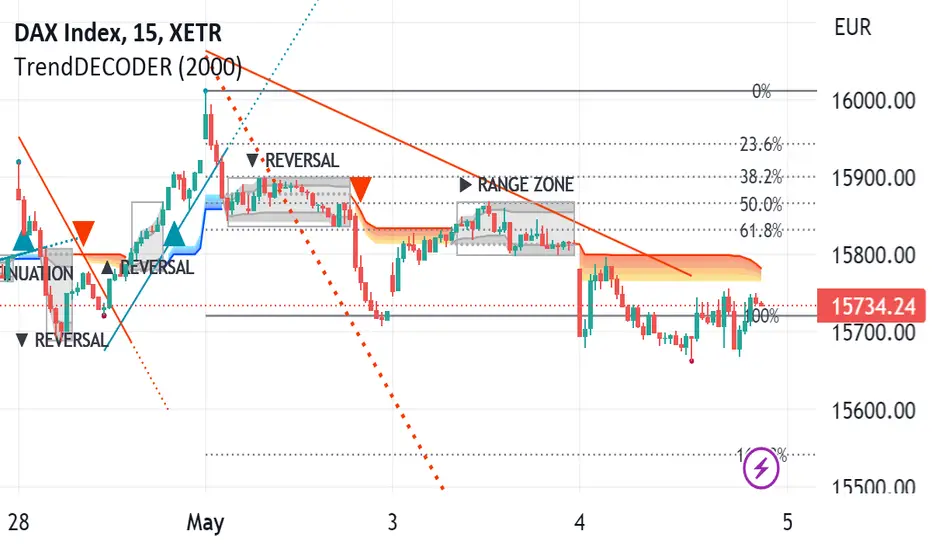
TrendDECODER by MetaSignalsProTrendDECODER
The fastest indicator to detect trends and price ranges
-------------------------------------------------------------------
✔️ Identify ranges and the next probable direction
✔️ Get the earliest signals and the strength of Trends
✔️ Get clear exits signals before reversal
✔️ Spot the Fibo levels the price will test
-------------------------------------------------------------------
📌 What is it about ?
--------------------------
TrendDECODER is a concentrate of multiple innovations to make Trend following simple and easy.
Please see in the 🛠️ Calculation & Precisions section at the end of this page to know more how they work.
👉 With the GreyBox - identify when the market gets out of the Trend with a new sequence of transition. Check if the market is in Range, Continuation or Reversal (Up or Down) and wait for the closing of the box to get the Trend signal.
👉 With the DecoderSignals & Blue/Orange Clouds - once the GreyBox has delivered its message, get the new direction of the Trend and see the probable zones of pull backs during the current direction.
👉 With the Projective TrendLine - see before it happens the direction and the possible angle of the Trend with its probable range.
👉 With the RealTime TrendLine vs the Projective TrendLine - adjust immediately if the market accelerates North or South.
👉 With the RealTime TrendLine Crossing - detect at the earliest the moment the Trend gets out of track, to get out of the train.
👉 With the FiboLevels - spot immediately which price levels the market will test.
📌 For which asset?
-----------------------
TrendDECODER is universal : it works fine on all assets and all time-frames;
☝️ always work on a multi-timeframe environment to minimize risk;
📌Why we made these innovations?
---------------------------------------------
Because the trend indicators that we know, lag a lot and do not clearly identify ranges!
We need much more powerful tools than Supertrend or a couple of moving averages crossings to get this done.
📌 How to trade with TrendDECODER?
----------------------------------------------
🔹 Strategy #1: Trend Following : DecoderSignals & Blue/Orange Clouds
----------------------------------------------------------------------------------------
The GreyBOX has given the next probable movement and the Signal of a Trend in on.
The RealTime TrendLine guides us on the pace of this movement and the Blue/ Orange/Cloud figures the support/resistance of this movement.
It will be wise not to jump immediately in the Trend as the signal appears as the price will very probably make a pullback in direction of the cloud first.
🔹 Strategy #1: Checklist
📍 Set a Multi Time Frame environment
📍 Main Time Frame and the Upper Time Frame are moving in the same direction (Up or Down)
📍 Main Time Frame: appearance of the « TrendUp Signal » or the « TrendDown Signal »
📍 Entry:
☝️ buying « at Market » immediately on a « Trend Signal » is quite risky as many times the price will pull back near the Clouds
👉 a good option is to buy 1/2 the position at market on signal
👉 and 1/2 after the first pull back
📍 First Stop Loss: place your SL under the lower border of the GreyBox for an expected TrendUp or the higher border for an expected TrendDown
📍 BreakEven: when the price reaches your Risk/Reward ratio of 1 = Distance StopLoss vs Entry = Distance Current Price vs Entry
📍 Trailing Stop: just under the lowest border of the Blue Cloud (TrendUp) or the highest border of the Orange Cloud (TrendDown)
📍 TakeProfits: in a TrendUP, place your take profits just under the FibosLevels in order not to get exited (and above in a TrendDOWN)
📍 Exits:
👉 Early option : Crossing of the RealTime TrendLine
👉 Late option : Crossing of the Blue/Orange cloud
🔹 Strategy #2: Early Trend following : RealTime TrendLine Crossing
-------------------------------------------------------------------------------------
With this simple tool, get a very early signal of a probable inversion of the current Trend, way before the Decoder Signal is shown, once confirmed by the GreyBOX.
🔹 Strategy #2: Checklist
📍 Set a Multi Time Frame environment
📍 Main Time Frame and the Upper Time Frame are moving in the same direction (Up or Down)
📍 Entry (Main Time Frame): wait for the Close crossing over the ReaTime TrendLine in an expected TrendUp (under for a TrendDown )
📍 First Stop Loss (Main Time Frame):
👉 place your SL under the lower low of the GreyBOX (for an expected TrendUp) or the higher high (for an expected TrendDown)
📍 BreakEven: move your SL to Entry price when the price reaches your Risk/Reward ratio of 1 = Distance StopLoss vs Entry = Distance Current Price vs Entry
📍 Trailing Stop: just under the lowest border of the Blue Cloud (TrendUp) or the highest border of the Orange Cloud (TrendDown)
📍 TakeProfits: in a TrendUP, place your take profits just under the FibosLevels in order not to get exited (and above in a TrendDOWN)
📍 Exits:
👉 Early option : Crossing of the RealTime TrendLine
👉 Late option : Crossing of the Blue/Orange cloud
🎛️ Configuration
---------------------
Well, basically you do not have to do anything !
But you can make TrendDECODER perfectly yours with a few switches in the configuration panel to make appear or disappear each one of the elements composing TrendDECODER.
🛠️ Calculation & Precisions
------------------------------------
🔹 Blue/Orange Clouds
The Blue/Orange Clouds are a proprietary synthesis of Price Action and Volume Exchange in real time.
🔹 Projective TrendLine
As soon as a new high or a new low has been reached during the last move, TrendDECODER traces a possible angle of the future movement based on the pace of the last one in the same direction.
The distance between the Projective TrendLine and the Last Lowest (resp. Highest) gives you a possible bottom (resp. top) of the price range.
🔹 RealTime TrendLine
As soon as the Decoder GreyBox has delivered its information i.e Range/Continuation/ReversalUp/ReversalDown and that a New High (resp. New Low) has been reached, the RealTime TrendLine starts to show the pace and the angle of the new movement based on a linear regression adanced concept.
The angles of the Projective and the RealTime TrendLine can be identical, telling you that the market moves smoothly in a global consensus. It can be a smart Trailing Stop Loss.
Or these angles can be very different and it will call your maximum attention. You might want to switch to a superior timeframe to get the bigger picture.
🔹 FiboLevels
Once a new Trend is signaled, the levels of Fibonnaci are automatically placed.
They are calculated on the last Highest and Lowest of the former movement.
Golden ZoneIntroducing the "Golden Zone" indicator, a powerful tool that simplifies the Fibonacci indicator by creating a clear Golden Zone to identify potential future price movements. The Golden Zone is a supply or demand zone that corresponds to the 61.8% and 50% Fibonacci retracement levels. These levels are important because they often mark zones where the price reacts, making it an essential area for traders to watch.
The script plots the Fibonacci levels in the background, enabling traders to identify potential support and resistance levels quickly. The Golden Zone is highlighted with a yellow filled area, making it easy to spot on the chart. Traders use this zone to identify areas where the stock price may react, either bouncing off the support level or encountering resistance at the resistance level.
For example, if a stock price is moving up and reaches the Golden Zone, a trader may look for signs of resistance and consider selling the stock if the price begins to move back down. Conversely, if a stock price is moving down and reaches the Golden Zone, a trader may look for signs of support and consider buying the stock if the price begins to move back up.
The "Golden Zone" indicator is highly versatile and can be used in all markets, whether you are a swing trader or a day trader. It can be combined with other strategies, such as an EMA crossover strategy or price action, or as an area of confluence.
In summary, the "Golden Zone" indicator is a must-have tool for traders looking to identify potential price movements and locate key support and resistance levels. Its user-friendly inputs and clear display make it a valuable addition to any trading arsenal.
So, the "Golden Zone" indicator is like a magic tool that helps people who trade in the stock market find valuable things to buy or sell. And with its ability to identify key support and resistance levels, it can help traders make better-informed decisions when buying or selling stocks.
I hope you like it!
FibonRSI / ErkOziHello,
This software is a technical analysis script written in the TradingView Pine language. The script creates a trading indicator based on Fibonacci retracement levels and the RSI indicator, providing information about price movements and asset volatility by using Bollinger Bands.
There are many different scripts in the market that draw RSI and Fibonacci retracement levels. However, this script was originally designed by me and shared publicly on TradingView.
***The indicator uses RSI (Relative Strength Index) and Bollinger Bands (BB) as the basis for the FibonRSI strategy. RSI measures the strength of a price movement, and BB measures the volatility of an asset. The FibonRSI strategy is based on the idea that the Fibonacci ratios and RSI can be used to predict a asset's price retracement levels.
***The script allows for various parameters to be adjusted. Users can specify the price source type and adjust the periods for RSI and Bollinger Bands. The standard deviation number for Bollinger Bands can also be customized.
***The script calculates the current RSI indicator position and the basic, upper, and lower levels of Bollinger Bands. It then calculates and draws the Fibonacci retracement levels. The color of the RSI line is determined by the upper and lower distribution levels of Bollinger Bands. Additionally, the color of the Fibonacci retracement levels can also be customized by the user.
***This script can be used to determine potential buy and sell signals using Fibonacci retracement levels and RSI. For example, when the RSI is oversold and the price is close to a Fibonacci retracement level, it can be interpreted as a buying opportunity. Similarly, when the RSI is overbought and the price is close to a Fibonacci retracement level, it can be interpreted as a selling opportunity.
***The script takes input parameters such as the price source used for calculation, the period for the RSI indicator, the period for the Moving Average in Bollinger Bands, and the number of standard deviations used in Bollinger Bands.
***The script's conditions include elements such as calculating the current position of the RSI indicator, calculating the upper and lower Bollinger Bands, calculating the dispersion factor, and calculating Fibonacci levels.
***The parameters in the code can be adjusted for calculation, including the price type used, the RSI period, the Moving Average period for BB, and the standard deviation count for BB. After this, the current position of the RSI, Moving Average, and standard deviation for BB are calculated. After calculating the upper and lower BB, the levels above and below the average are calculated using a specific dispersion constant.
CONDITIONS FOR THE SCRIPT
current_rsi = ta.rsi(src, for_rsi) // Current position of the RSI indicator
basis = ta.ema(current_rsi, for_ma)
dev = for_mult * ta.stdev(current_rsi, for_ma)
upper = basis + dev
lower = basis - dev
dispersion = 1
disp_up = basis + (upper - lower) * dispersion
disp_down = basis - (upper - lower) * dispersion
// Fibonacci Levels
f100 = basis + (upper - lower) * 1.0
f78 = basis + (upper - lower) * 0.78
f65 = basis + (upper - lower) * 0.65
f50 = basis
f35 = basis - (upper - lower) * 0.65
f23 = basis - (upper - lower) * 0.78
f0 = basis - (upper - lower) * 1.0
***When calculating Fibonacci levels, the distance between the average of BB and the upper and lower BB is used. These levels are 0%, 23.6%, 35%, 50%, 65%, 78.6%, and 100%. Finally, the RSI line that changes color according to a specific RSI position, Fibonacci levels, and BB are visualized. Additionally, the levels of 70, 30, and 50 are also shown.
The script then sets the color of the RSI position according to the EMA and draws Bollinger Bands, RSI, Fibonacci levels, and the 70, 30, and 50 levels.
In conclusion, this script enables traders to analyze market trends and make informed decisions. It can also be customized to suit individual trading strategies.
This script analyzes the RSI indicator using Bollinger Bands and Fibonacci levels. The default settings are 14 periods for RSI, 233 periods and 2 standard deviations for BB. The MA period inside BB is selected as the BB period and is used when calculating Fibonacci levels.
***The reason for selecting these settings is to provide enough time for BB period to confirm a possible trend. Additionally, the MA period inside BB is matched with the BB period and used when calculating Fibonacci levels.
***Fibonacci levels are calculated from the distance between the upper and lower bands of BB and show how RSI movement is related to these levels. Better results can be achieved when RSI periods are set to Fibonacci numbers such as 21, 55, and 89. Therefore, the use of Fibonacci numbers is recommended when adjusting RSI periods. Fibonacci numbers are among the technical analysis tools that can capture the reflection of naturally occurring movements in the market. Therefore, the use of Fibonacci numbers often helps to better track fluctuations in the market.
Finally, the indicator also displays the 70 and 30 levels and the middle level (50) with Fibonacci levels drawn in circles. Changing these settings can help optimize the Fibonacci levels and further improve the indicator.
Thank you in advance for your suggestions and opinions......

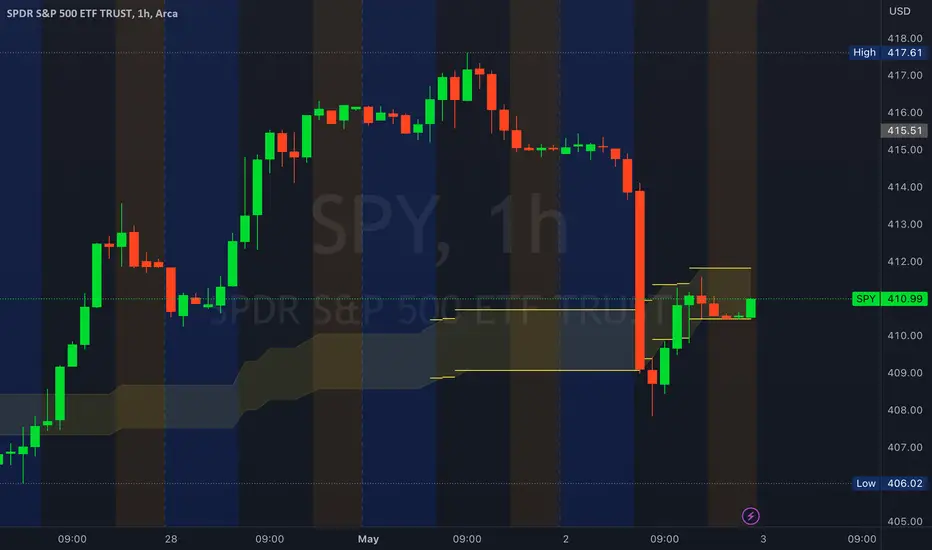
AutoLevels3.0AutoLevels is a script based on the ATR ( Average True Range ) of price action over the past 14 days. It calculates those and includes Fibonacci Extensions to create Levels that are Automatically created each morning. These are not based on past price action but are well respected and easily show patterns throughout the day.
Levels are made up of a BULL BAR , a BEAR BAR ( Go long above Bull, short below Bear Bar ) and the various extensions beyond them. Common Liquidity areas are also highlighted as tan/yellow bars. These are common reversal and contention levels should price action approach them.
Also included are 4 EMAs that have been transformed into 2 separate EMA clouds. These clouds will change color when bearish / bullish and crossing and signal up and downtrends and compress during chop. They are 100% customizable with your own EMA preference. Colors as well.
The Candles are Volume Based Candles. They default to Hollow candles when Volume is below the 24 moving average ( customizable ) and are filled solid when the volume for that time period has HIGH RELATIVE VOLUME. These are GREAT SIGNALS as price action approaches the levels that the AUTOLEVEL indicator generate. When a candle is filled and approaching a level it is likely to break through or attempting to. Low volume candles, hollow, show low conviction in price movement.
Aside from the Fibonacci Levels generated, the EMA Clouds and the Volume Candles you can also select how full or minimal your chart is. ( more levels to only a few ) Also you can extend all levels to the right for future charting or leave that selection off to only generate the static daily levels a few bars ahead.
You can also adjust the timeframe the Autolevels are generating levels for. 1 day is the current day. 1 month plots out a month of levels and is best used with the 1D timeframe.
You can look up my Twitter account for hundreds of examples of daily use.

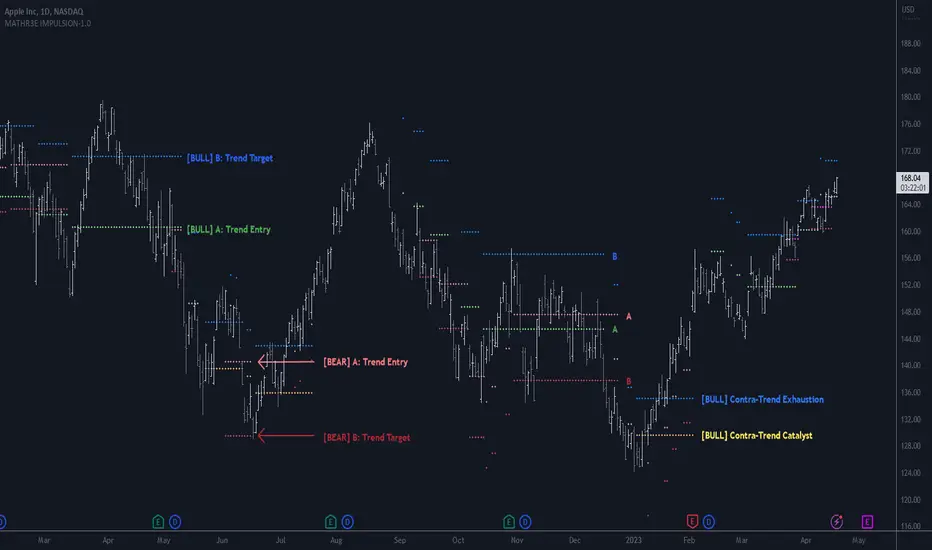
MATHR3E IMPULSION█ OVERVIEW
MATHR3E IMPULSION is a momentum-based indicator that aims to operate in the direction of the overall price trend,
relying on Fibonacci ratios to identify triggers for extended moves towards exhaustion levels.
█ CONCEPTS
Disclaimer
MATHR3E Impulsion indicator is intended for advanced traders and may fit your profile, whether you are a day trader or a long-term investor.
It was originally developed by a renowned market analyst and documented in numerous books. Among them is the author Jason Perl.
It is recommended to have read the trading techniques mentioned in the books covering this indicator beforehand.
How to use
It is designed to operate in the direction of the overall price trend.
Bullish case:
If a market rallies, pulls back, and then resumes its uptrend without having violated the origin of the advance,
the indicator will identify the inflection price level, at which time sufficient momentum or thrust has been generated to trigger the catalyst for an extension to a higher target level.
Bearish case:
If a market declines, rallies, and then resumes its downtrend without having violated the origin of the decline,
the indicator will identify the bear trigger that should provide the catalyst for an extension to a lower target level.
Definitions:
• X: Initial thrust level
• Y: Initial thrust completion level
• Z: Retracement level of at least 0.236
• A: Momentum (Entry) = 0.236 from Z
• B: Exhaustion (Target) = 0.472 from Z
MATHR3E Impulsion will automatically detect the X, Y and Z points and draw the A and B levels.
The A and B levels are calculated based on two ratios that are derivatives of the Fibonacci numbers:
— The primary level (0.236) is the Momentum which serves as a trigger for extended moves in the direction of the trend.
— The secondary level (0.472) is the likely target, known as the exhaustion level.
Counter-trend:
The indicator is also able to detect counter-trend movements. In this case, the A and B levels are also applied since the last advance/decline.
A distinct coloring will let traders distinguish the trending impulsion from the counter-trending one.
█ FEATURES & BENEFITS
Versatile
The indicator is designed to work with other indicators by the same author, including the identification of exhaustion points.
It highlights trends in progress and potential trend reversal.
Entry and profit taking levels are backed by Fibonacci levels.
This indicator can be applied to any market or time frame
Customizable
The sensitivity of the XYZ points can be configured.
Customizable Fibonacci levels for Momentum and targets levels.
Fib Retracement AlgoFib Retracement Algo
Description: This indicator has a series of steps that it takes before it finds possible retracement areas depending on the trend. The indicator itself is really simple to use.
How does it work?
This indicator uses the Hurst Exponent to verify whether or not the market is trending or not. It then determines the trend and then decides which retracement is possible.
If the hurst is below 0.5, then the retracement lines won't appear; they only appear in a trending market above 0.5 if you don't see the lines.
How Traders can use this indicator
Traders who trade bounces or retracements can use this indicator and enjoy the verification process that goes behind finding these retracements. This indicator can also be used to identify possible gaps on some occasions.
Examples of the indicator:

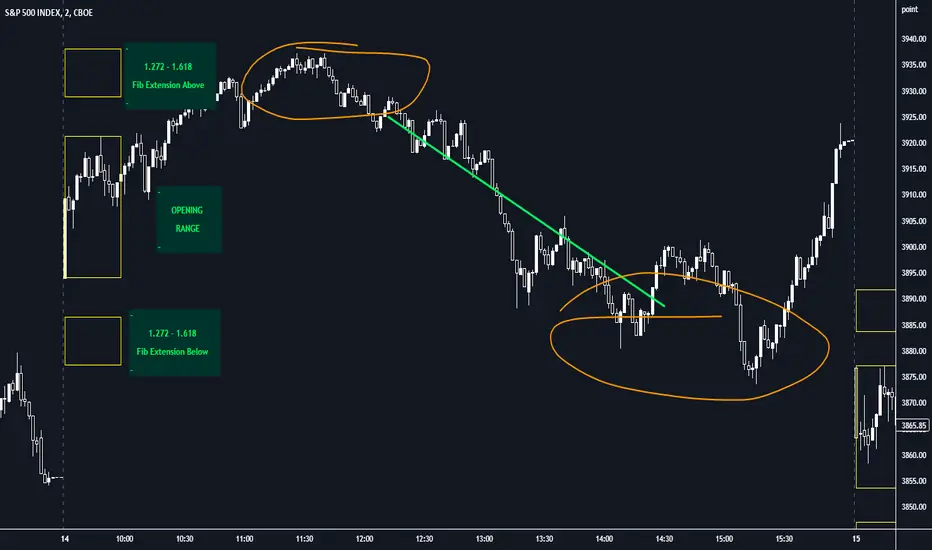
Opening Range with FibsThe indicator uses a time range and another instrument for time reference, so that it works in the time zone you care about. I have set the default to SPX500USD since it is in EST ( SPX , ES and many futures are on Chicago time and opening range gets confused). You can change the reference instrument in the settings.
You can also change the multipliers and use other values instead of 1.272 and 1.618 for Fib extensions.
TradingView has a limit as to how many objects an indicator can create so if you want to go back further for visual backtesting - use the replay tool - it will be able to draw up to the time you selected within its limits.
Let me know if you need anything else...
Happy Trading!
[JL] Supertrend Zone Pivot Point with zigzag fibThis is an open-source Pine script that generates a Supertrend Zone Pivot Point with Zigzag Fib indicator for TradingView. The indicator displays the Supertrend Zone, pivot points, and Fibonacci levels on the chart.
One of the unique features of this indicator is that it uses a Zigzag that does not repaint, ensuring accurate high and low points for the pivot points.
Another feature is that when the Supertrend is in an uptrend, only the highest points are taken as pivot points, and when it's in a downtrend, only the lowest points are taken as pivot points.
The Fibonacci levels are calculated based on the previous high and low pivot points, with labels displaying the corresponding levels on the chart.
The indicator also includes options to show/hide the Zigzag and Fibonacci levels.
Overall, this indicator is useful for identifying key pivot points and Fibonacci levels in the Supertrend Zone, providing valuable information for traders to make informed decisions.

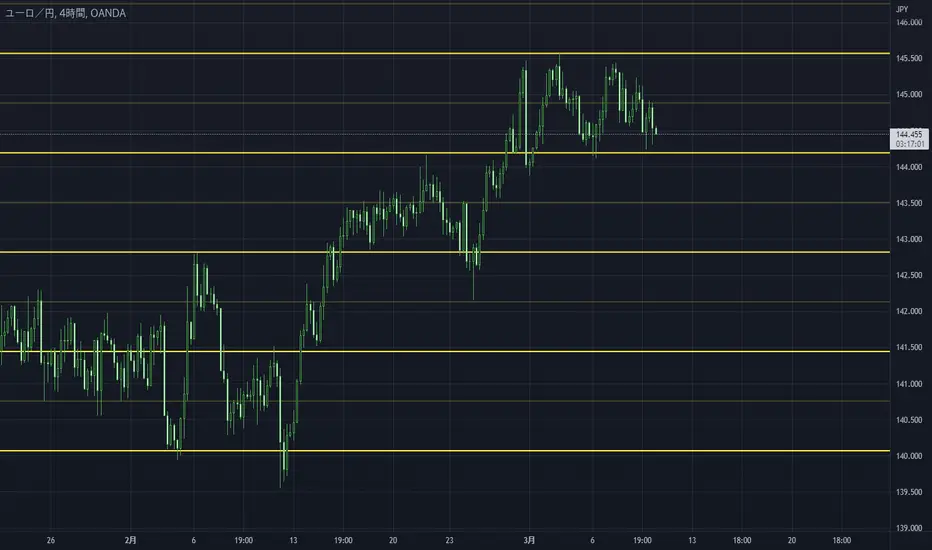
Draw Several Horizontal Lines [MsF]Japanese below / 日本語説明は英文の後にあります。
-------------------------
This indicator that automatically draws a horizontal line by copying from the input High/Low. Useful for doing horizon analysis. It's possible to display Fibonacci based on the entered High/Low. You can get the alert of each Fibonacci point.
- Parameter
Input Upper Value: Enter the High value
Input Lower Value: Enter the Low value
Band Range Count : Enter the number of horizontal lines
Fibonacci : visible or invisible
-------------------------
入力したHigh/Lowを起点に水平線を上下にコピーして自動で描画するインジケーターです。水平線分析を行うのに役立ちます。
また、入力したHigh/Lowを元にfibonacciを表示することも可能です。fibonacciについては、各ポイント毎にアラートの設定も可能です。
<パラメータ説明>
Input Upper Value:起点となるHighを入力してください
Input Lower Value:起点となるLowを入力してください
Band Range Count :水平線を上下にコピーする本数を入力してください
Fibonacci :フィボナッチが不要な場合はfalseにしてください
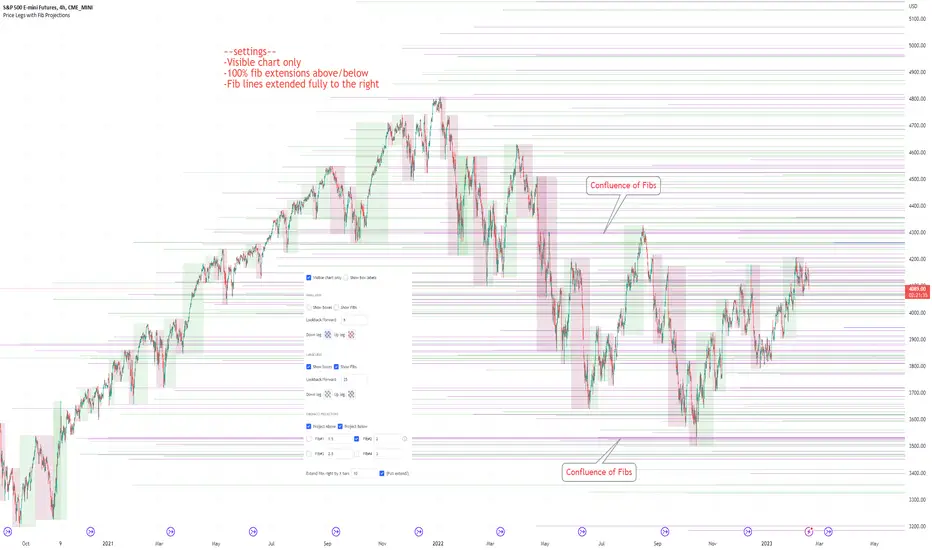
Price Legs & Fib Projections: Fibonacci Confluence-Plots price legs based on two user input lookback numbers. Smaller number for small legs, larger number for large legs.
-Plots Fib projections of these price legs, above and below; User can input four independent fib levels or standard deviation levels
## User Inputs ##
~Show visible chart only; Show price leg labels (time and price); show small legs (fibs and/or boxes); show large legs (fibs and/or boxes)
~Input 4 Fibonacci levels or measured move levels. Toggle each level on/off
~toggle on/off Fib levels ABOVE or fib levels BELOW
~extend Fib levels 'X' bars to the right, or toggle on/off 'Full Extend' to the right
## Tips & Notes ##
-use 'Full Extend' together with 'visible chart only' if searching for multiple confluence of Fib levels.
-can quickly get very cluttered, but the aim in writing this was to try to find area of confluence at a glance amongst a mess of levels, then hide the indicator and study/note that area.
-if lines don't print toward the left hand side of the chart you've likely reached the max line limit set by Tradingview.
-Fib level input of 1.0 represents zero % extension above the high or below the low of the leg; 2.0 represents 100% extension.
1hr S&P: Visible chart only; large legs only; 50%, 100%, 150%, 200% Fib extensions; Above only; lines extended fully to the right:
Usage notes; 15m S&P: Small & Large price legs; partial extend; all fib levels above/below: