pricing_tableThis script helps you evaluate the fair value of an option. It poses the question "if I bought or sold an option under these circumstances in the past, would it have expired in the money, or worthless? What would be its expected value, at expiration, if I opened a position at N standard deviations, given the volatility forecast, with M days to expiration at the close of every previous trading day?"
The default (and only) "hv" volatility forecast is based on the assumption that today's volatility will hold for the next M days.
To use this script, only one step is mandatory. You must first select days to expiration. The script will not do anything until this value is changed from the default (-1). These should be CALENDAR days. The script will convert to these to business days for forecasting and valuation, as trading in most contracts occurs over ~250 business days per year.
Adjust any other variables as desired:
model: the volatility forecasting model
window: the number of periods for a lagged model (e.g. hv)
filter: a filter to remove forecasts from the sample
filter type: "none" (do not use the filter), "less than" (keep forecasts when filter < volatility), "greater than" (keep forecasts when filter > volatility)
filter value: a whole number percentage. see example below
discount rate: to discount the expected value to present value
precision: number of decimals in output
trim outliers: omit upper N % of (generally itm) contracts
The theoretical values are based on history. For example, suppose days to expiration is 30. On every bar, the 30 days ago N deviation forecast value is compared to the present price. If the price is above the forecast value, the contract has expired in the money; otherwise, it has expired worthless. The theoretical value is the average of every such sample. The itm probabilities are calculated the same way.
The default (and only) volatility model is a 20 period EWMA derived historical (realized) volatility. Feel free to extend the script by adding your own.
The filter parameters can be used to remove some forecasts from the sample.
Example A:
filter:
filter type: none
filter value:
Default: the filter is not used; all forecasts are included in the the sample.
Example B:
filter: model
filter type: less than
filter value: 50
If the model is "hv", this will remove all forecasts when the historical volatility is greater than fifty.
Example C:
filter: rank
filter type: greater than
filter value: 75
If the model volatility is in the top 25% of the previous year's range, the forecast will be included in the sample apart from "model" there are some common volatility indexes to choose from, such as Nasdaq (VXN), crude oil (OVX), emerging markets (VXFXI), S&P; (VIX) etc.
Refer to the middle-right table to see the current forecast value, its rank among the last 252 days, and the number of business days until
expiration.
NOTE: This script is meant for the daily chart only.
Forecast

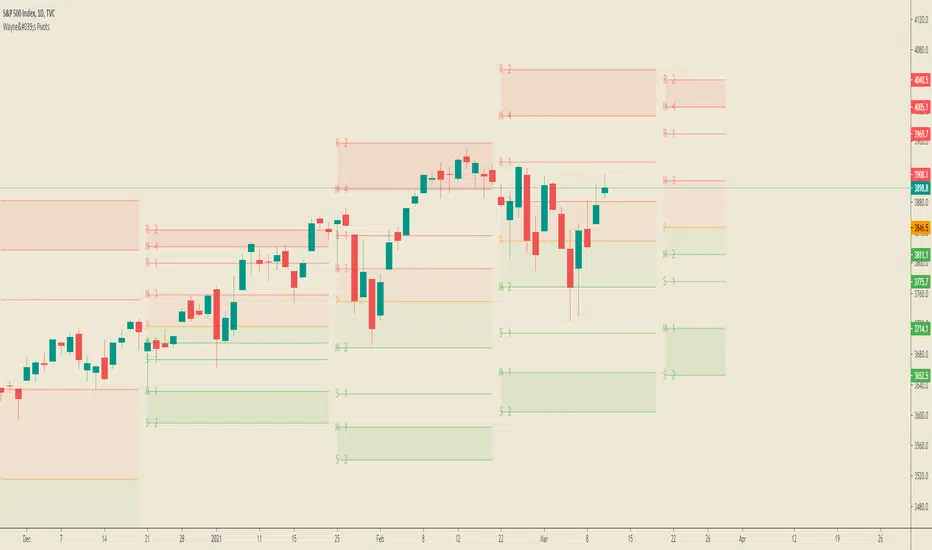
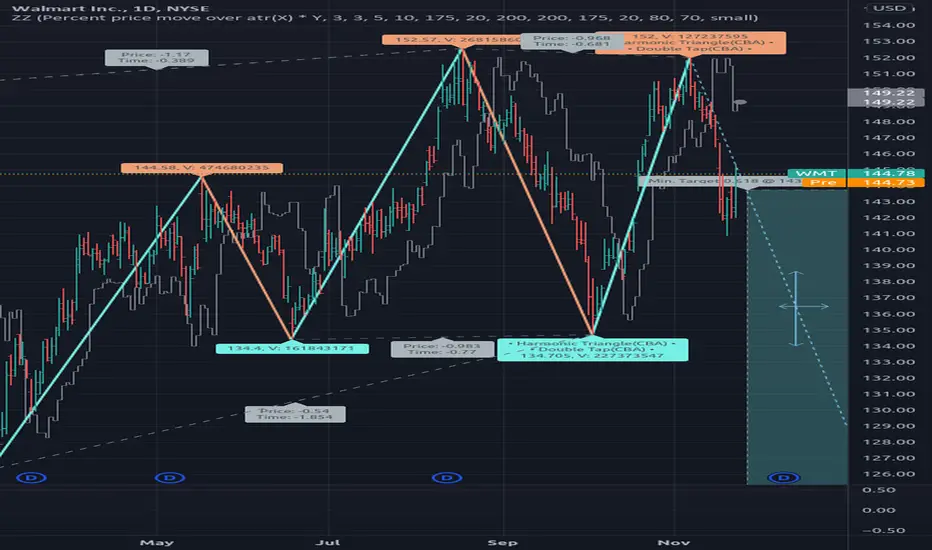
Pivot High/Low Analysis & Forecast [LuxAlgo]Returns pivot points high/low alongside the percentage change between one pivot and the previous one (Δ%) and the distance between the same type of pivots in bars (Δt). The trailing mean for each of these metrics is returned on a dashboard on the chart. The indicator also returns an estimate of the future time position of the pivot points.
This indicator by its very nature is not real-time and is meant for descriptive analysis alongside other components of the script. This is normal behavior for scripts detecting pivots as a part of a system and it is important you are aware the pivot labels are not designed to be traded in real-time themselves
🔶 USAGE
The indicator can provide information helping the user to infer the position of future pivot points. This information is directly used in the indicator to provide such forecasting. Note that each metric is calculated relative to the same type of pivot points.
It is also common for analysts to use pivot points for the construction of various figures, getting the percentage change and distance for each pivot point can allow them to eventually filter out points of non-interest.
🔹 Forecast
We use the trailing mean of the distance between respective pivots to estimate the time position of future pivot points, this can be useful to estimate the location of future tops/bottoms. The time position of the forecasted pivot is given by a vertical dashed line on the chart.
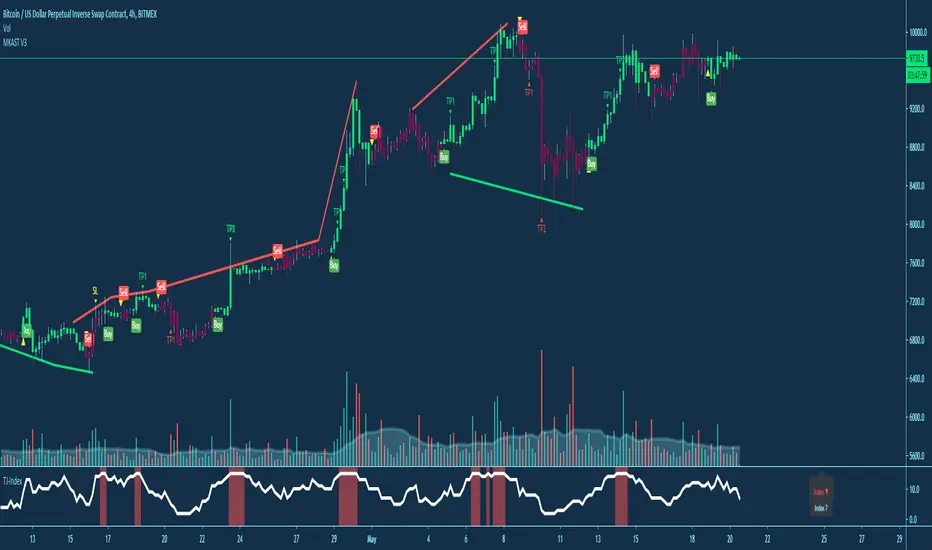
We can see a successful application of this method below:
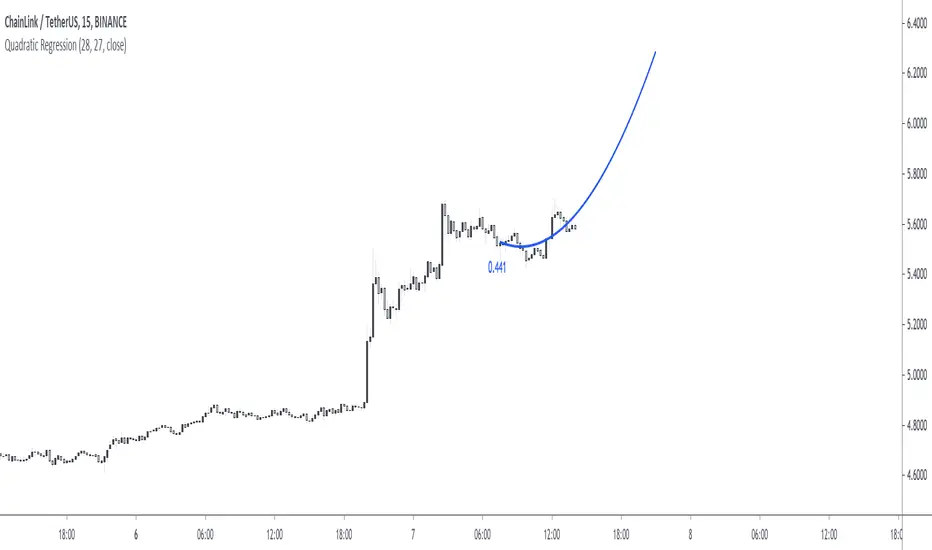
Above we see the forecasted pivots for BTCUSD15. The forecast of interest being the pivot high. We highlight the forecast position with a blue dotted line for reference.
After some time we obtain a new pivot high with a new forecast. However, we can see that the time location of this new pivot high matches perfectly with the prior forecast.
The position in time for the forecast is given by:
x1_ph + E
x1_pl + E
where x1_ph denotes the position in time of the most recent pivot high. x1_pl denotes the position in time of the most recent pivot low and E the average distance between respective pivot points.
🔶 SETTINGS
Length: Window size for the detection of pivot points.
Show Forecasted Pivots: Display forecast of future pivot points.
🔹 Dashboard
Dashboard Location: Location of the dashboard on the chart
Dashboard Size: Size of the dashboard on the chart
Text/Frame Color: Determines the color of the frame grid as well as the text color

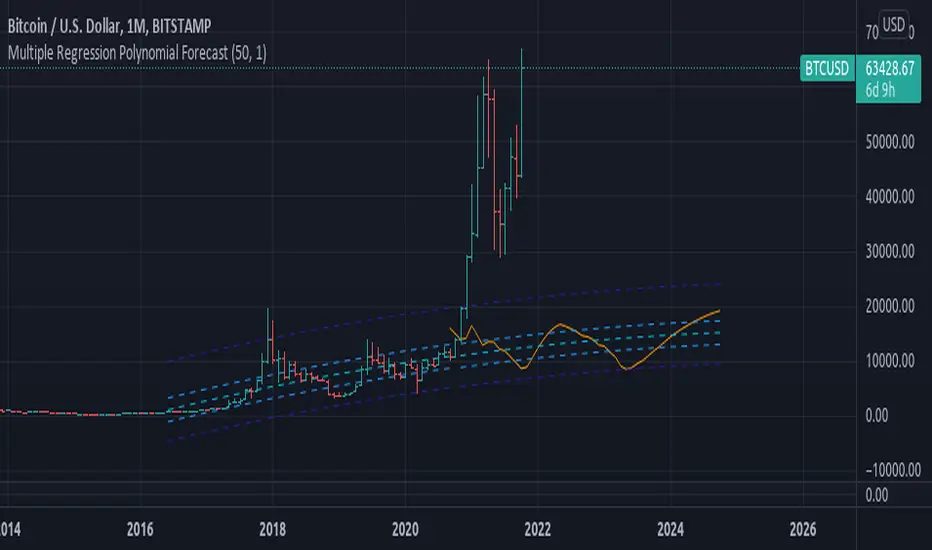
Multiple Regression Polynomial ForecastEXPERIMENTAL:
Forecasting using a polynomial regression over the estimates of multiple linear regression forecasts.
note: on low data the estimates are skewd away of initial value, i added the i_min_estimate option in to try curve this issue with limited success "o_o.
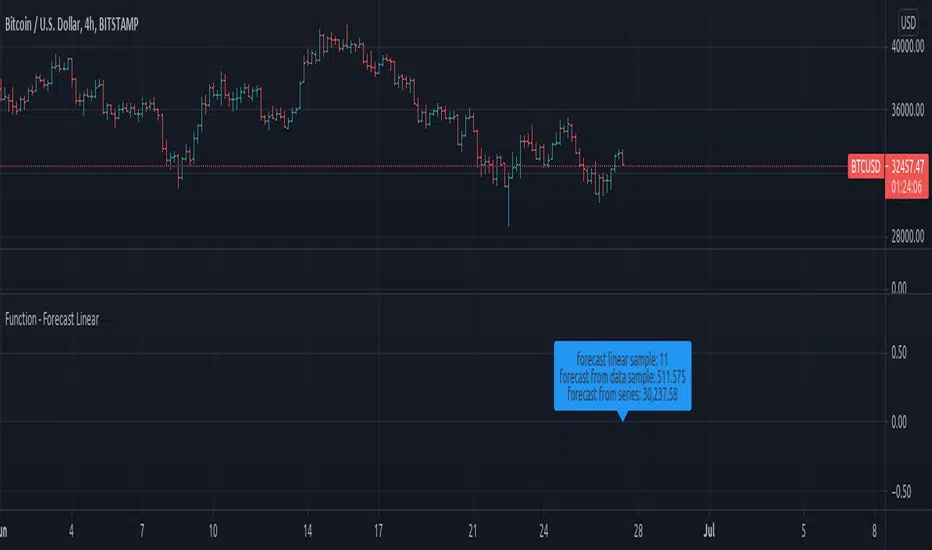
Function - Forecast LinearFunction to calculate a forecast using a linear regression approach, this is the same function used on excel and other data sheet programs.
reference:
- support.microsoft.com
- stackoverflow.com
Volatility - Sacred GeometryThis indicator is designed to pick up changes in volatility before it happens. It also shows current volatility, as price action drops the blue lines contract. The script uses the blue lines to locate spikes in volatility.
Example of dump revealing itself with plenty of notice.
Here large changes in price action are shown when the white lines spike. Traders can get a heads up on any pump or dump a few candles before it happens.
This example shows a low volatility channel vs high volatility channel. The blue lines expand as price range increases.
Trends can be discovered by studying the patterns.
* This indicator does not use sacred geometry, I just called it that because it looks like it. *
If anyone is interested in developing this indicator any further please get in contact.

Pivot ProbabilitiesThis indicator gives traders historical probabilities based on how often price closed between any two pivot points.
What are the features? (as of release)
Get the historical statistics of how often price closed between any two pivot points.
Manually set your own pivot point resolution to any higher timeframe. So get the historical statistics from any pivot point you'd like.
Why would someone use this?
Reversion: We can more clearly see between which pivots price has highest probability of mean reversion towards.
Risk Management: By adding the statistics between groups of pivots, we can have a better idea of what the normal trading range for pivot points on any given asset should be. Making it easier to identify which pivot points are more likely to have extreme price movements go past.
Could you add an option to show probabilities for "x" style of pivot points?
I plan on adding more types of pivot points in the future. Check out if there are any updates to this indicator that include the pivots you're looking for. Otherwise, tell me what you're looking for in the comments here.
Why don't I see any pivot points on my chart when I apply this indicator?
This indicator does not draw pivot points on your chart. It strictly draws probabilities. So feel free to use it in combination with your favorite one.

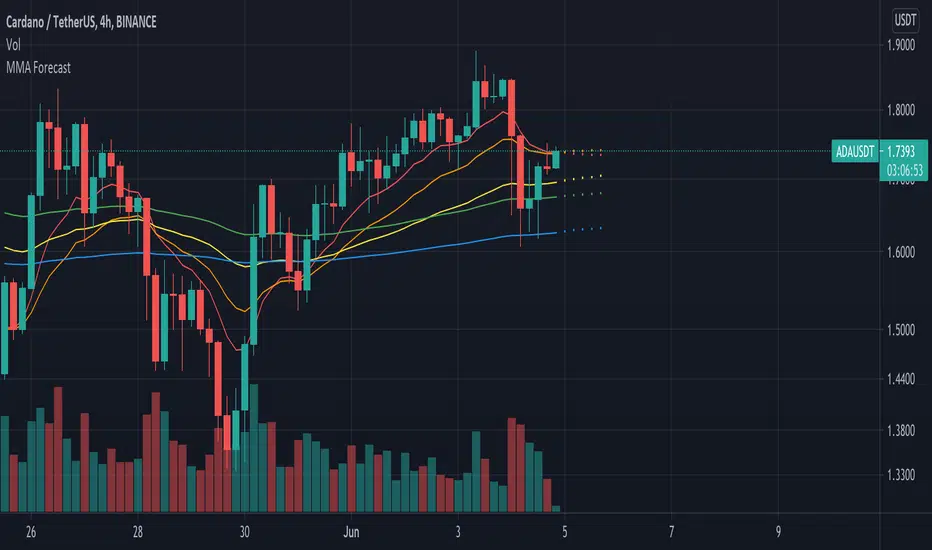
Multi Moving Average with ForecastThis script allows to use 5 different MAs with prediction of the next five periods.
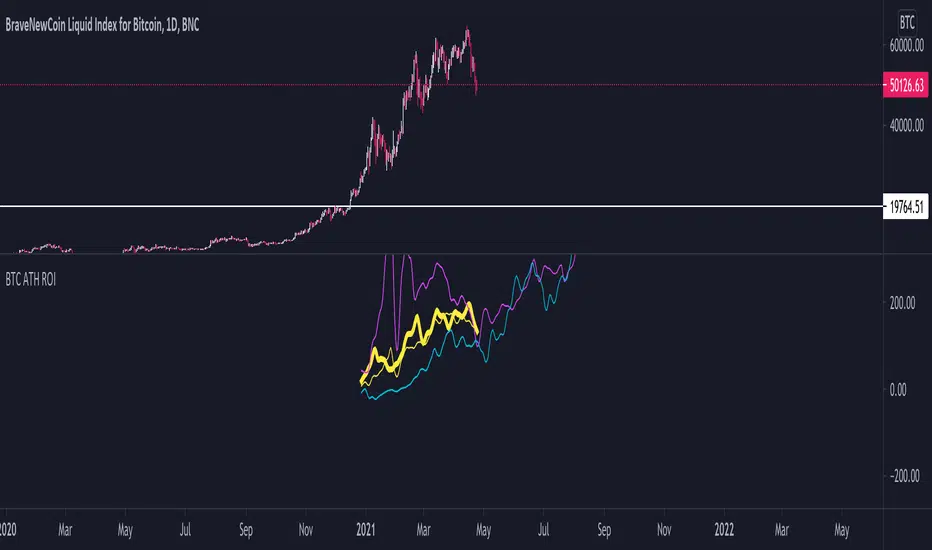
BTC ATH ROIThis indicator shows the ROI % of Bitcoin from when it passed its ATH of the previous bull cycle. I found it interesting that each time it crossed its ATH it took around 260-280 days to peak for each one. This bull run seems to follow between both of the previous bull runs including this recent dip.
There are a couple issues I want to fix but can't figure out:
1. You need to completely scroll out and move towards 2013 on the Daily chart for all 3 lines to show up. Would be nice to load all of that data at the start.
2. I can't query the value of the plots after they have been offset. This would be useful to create a prediction bias for the current plot so would could see where btc might go.
If you peeps know of a way to load all data or query plot values after offsets, please share. That would be awesome.
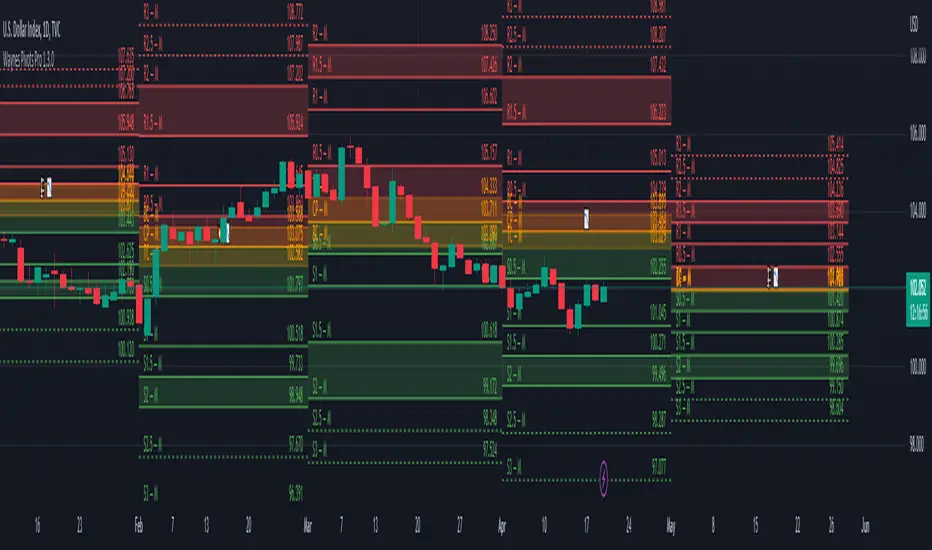
Wayne's Pivots ProThere is a public version of this indicator titled "Wayne's Pivots" if you would like to try out something similar to this indicator.
Wayne's Pivots Pro is named after Wayne McDonnel who came up with this indicator's pivot trading methodology. Wayne's Pivots are only one part of his methodology, but these pivots are the most critical part. They are frequently applied to supplement other trading methodologies as well. There are 3 key features that separate Wayne's Pivots specifically from every other pivot point indicator out there.
1. Midpoint Pivots
2. Biased Pivots
3. Next Period's Pivots
Understand that this indicator is supposed to be used, according to the methodology, alongside a fundamental bias. If you have not done fundamental research to know if you're a bull or bear on an asset, then you will likely not be using these pivots correctly. They do not tell you which direction the market will move. It tells you how far and how long a trade may go depending on which way you bias the pivots, and if your fundamental view was correct. This is trade planning tool for your entries and exits.
Breaking each point down:
1. Midpoint Pivots
If you take regular pivots (S#, R#), and get a histogram of every time price closed at or above each level, you generally end up with an even distribution. By adding midpoint levels you are doubling the amount of data, and increasing the resolution of the histogram. While these extra levels don't necessarily give us entries or exits, they do tell us when price doesn't quite reach a major support or resistance level. Midpoint pivot levels are calculated by finding the midpoint between each pivot level, and are labeled from the bottom up starting at M0 (Midpoint 0).
2. Biased Pivots
The traditional rules for trading pivot points are to buy support levels and sell resistance levels. In Wayne's methodology, we see pivots as a set for entries and take profits depending on our bias. It is known that trading the inverse of traditional pivot point rules that you can end up with a reasonable strategy. Biased pivots let us focus on only what matter to us by removing all other pivots, lines, and labels. Only showing us pivots useful to the bias we set.
For example, if you are a bull fundamentally you would set the bullish biased pivots. You would look for an entry in the area between the central pivot and second midpoint (M2), and an exit in the area between R2 and M4.
3. Next Period's Pivots
The third major feature of Wayne's Pivots are the "future" pivots. These are really calculated by taking the current HLC data and plotting it in realtime into the future before there's any data there. When we enter a new trading period, let say the day, we will have little data on the next day's pivots. As the current trading day goes on and gets closer to it's close, we start to see the next day's pivot points firm up. It's at this point that future pivots become actionable to create trading plans for the next day. The next period's pivots are exceptionally useful when scaled up to weekly, monthly, quarterly, and yearly timeframes. Daily, weekly, and monthly are the most commonly used within communities trading Wayne's methodology.
This is a completely rebuilt, professional use version of Wayne's Pivots. It includes many technical upgrades required by professional using Wayne's methodology. I released the original version publicly because it does not have many of the features here included in the Professional's version.
Features in Pro that are not in the public version:
Works on ALL timeframes.
Realtime pivot point updates.
Price levels on the pivots.
Extra pivots. (R3, M5, M0, S3)
All pivots start and end at the correct dates and times. (public version can't due to plot())
Easier to add more features!
Does this mean that you've abandoned the public version of Wayne's Pivots?
Absolutely not. Whenever there is a new feature in the Pro version, I always see if I can add it into the public one. It's just that the way it's built was not how I originally envisioned these pivots to be. If there's ever something that breaks the public version, I'm going to fix it because there's hundreds of people who use it.
I use the public version of Wayne's Pivots perfectly fine with my trading. Why switch to Pro?
Simply put, it's not going to give you the most accurate pivots that a professional would need. The pivots do not print properly on months with more or less than 30 days, and do their worst on short weeks. The public version has been like this ever since I first made it, and the only work around was to completely rebuild it. That's the major reason why I made the public version available to everyone in the first place. On top of all that, I can add way more features and customization options to these pivots than the public ones.
If I have a feature request will you try to implement it?
Absolutely! Some requests do have their limits, but don't be afraid to ask for something you really want. I'll try and implement lots of requested features as time goes on.
Monte Carlo Range Forecast [DW]This is an experimental study designed to forecast the range of price movement from a specified starting point using a Monte Carlo simulation.
Monte Carlo experiments are a broad class of computational algorithms that utilize random sampling to derive real world numerical results.
These types of algorithms have a number of applications in numerous fields of study including physics, engineering, behavioral sciences, climate forecasting, computer graphics, gaming AI, mathematics, and finance.
Although the applications vary, there is a typical process behind the majority of Monte Carlo methods:
-> First, a distribution of possible inputs is defined.
-> Next, values are generated randomly from the distribution.
-> The values are then fed through some form of deterministic algorithm.
-> And lastly, the results are aggregated over some number of iterations.
In this study, the Monte Carlo process used generates a distribution of aggregate pseudorandom linear price returns summed over a user defined period, then plots standard deviations of the outcomes from the mean outcome generate forecast regions.
The pseudorandom process used in this script relies on a modified Wichmann-Hill pseudorandom number generator (PRNG) algorithm.
Wichmann-Hill is a hybrid generator that uses three linear congruential generators (LCGs) with different prime moduli.
Each LCG within the generator produces an independent, uniformly distributed number between 0 and 1.
The three generated values are then summed and modulo 1 is taken to deliver the final uniformly distributed output.
Because of its long cycle length, Wichmann-Hill is a fantastic generator to use on TV since it's extremely unlikely that you'll ever see a cycle repeat.
The resulting pseudorandom output from this generator has a minimum repetition cycle length of 6,953,607,871,644.
Fun fact: Wichmann-Hill is a widely used PRNG in various software applications. For example, Excel 2003 and later uses this algorithm in its RAND function, and it was the default generator in Python up to v2.2.
The generation algorithm in this script takes the Wichmann-Hill algorithm, and uses a multi-stage transformation process to generate the results.
First, a parent seed is selected. This can either be a fixed value, or a dynamic value.
The dynamic parent value is produced by taking advantage of Pine's timenow variable behavior. It produces a variable parent seed by using a frozen ratio of timenow/time.
Because timenow always reflects the current real time when frozen and the time variable reflects the chart's beginning time when frozen, the ratio of these values produces a new number every time the cache updates.
After a parent seed is selected, its value is then fed through a uniformly distributed seed array generator, which generates multiple arrays of pseudorandom "children" seeds.
The seeds produced in this step are then fed through the main generators to produce arrays of pseudorandom simulated outcomes, and a pseudorandom series to compare with the real series.
The main generators within this script are designed to (at least somewhat) model the stochastic nature of financial time series data.
The first step in this process is to transform the uniform outputs of the Wichmann-Hill into outputs that are normally distributed.
In this script, the transformation is done using an estimate of the normal distribution quantile function.
Quantile functions, otherwise known as percent-point or inverse cumulative distribution functions, specify the value of a random variable such that the probability of the variable being within the value's boundary equals the input probability.
The quantile equation for a normal probability distribution is μ + σ(√2)erf^-1(2(p - 0.5)) where μ is the mean of the distribution, σ is the standard deviation, erf^-1 is the inverse Gauss error function, and p is the probability.
Because erf^-1() does not have a simple, closed form interpretation, it must be approximated.
To keep things lightweight in this approximation, I used a truncated Maclaurin Series expansion for this function with precomputed coefficients and rolled out operations to avoid nested looping.
This method provides a decent approximation of the error function without completely breaking floating point limits or sucking up runtime memory.
Note that there are plenty of more robust techniques to approximate this function, but their memory needs very. I chose this method specifically because of runtime favorability.
To generate a pseudorandom approximately normally distributed variable, the uniformly distributed variable from the Wichmann-Hill algorithm is used as the input probability for the quantile estimator.
Now from here, we get a pretty decent output that could be used itself in the simulation process. Many Monte Carlo simulations and random price generators utilize a normal variable.
However, if you compare the outputs of this normal variable with the actual returns of the real time series, you'll find that the variability in shocks (random changes) doesn't quite behave like it does in real data.
This is because most real financial time series data is more complex. Its distribution may be approximately normal at times, but the variability of its distribution changes over time due to various underlying factors.
In light of this, I believe that returns behave more like a convoluted product distribution rather than just a raw normal.
So the next step to get our procedurally generated returns to more closely emulate the behavior of real returns is to introduce more complexity into our model.
Through experimentation, I've found that a return series more closely emulating real returns can be generated in a three step process:
-> First, generate multiple independent, normally distributed variables simultaneously.
-> Next, apply pseudorandom weighting to each variable ranging from -1 to 1, or some limits within those bounds. This modulates each series to provide more variability in the shocks by producing product distributions.
-> Lastly, add the results together to generate the final pseudorandom output with a convoluted distribution. This adds variable amounts of constructive and destructive interference to produce a more "natural" looking output.
In this script, I use three independent normally distributed variables multiplied by uniform product distributed variables.
The first variable is generated by multiplying a normal variable by one uniformly distributed variable. This produces a bit more tailedness (kurtosis) than a normal distribution, but nothing too extreme.
The second variable is generated by multiplying a normal variable by two uniformly distributed variables. This produces moderately greater tails in the distribution.
The third variable is generated by multiplying a normal variable by three uniformly distributed variables. This produces a distribution with heavier tails.
For additional control of the output distributions, the uniform product distributions are given optional limits.
These limits control the boundaries for the absolute value of the uniform product variables, which affects the tails. In other words, they limit the weighting applied to the normally distributed variables in this transformation.
All three sets are then multiplied by user defined amplitude factors to adjust presence, then added together to produce our final pseudorandom return series with a convoluted product distribution.
Once we have the final, more "natural" looking pseudorandom series, the values are recursively summed over the forecast period to generate a simulated result.
This process of generation, weighting, addition, and summation is repeated over the user defined number of simulations with different seeds generated from the parent to produce our array of initial simulated outcomes.
After the initial simulation array is generated, the max, min, mean and standard deviation of this array are calculated, and the values are stored in holding arrays on each iteration to be called upon later.
Reference difference series and price values are also stored in holding arrays to be used in our comparison plots.
In this script, I use a linear model with simple returns rather than compounding log returns to generate the output.
The reason for this is that in generating outputs this way, we're able to run our simulations recursively from the beginning of the chart, then apply scaling and anchoring post-process.
This allows a greater conservation of runtime memory than the alternative, making it more suitable for doing longer forecasts with heavier amounts of simulations in TV's runtime environment.
From our starting time, the previous bar's price, volatility, and optional drift (expected return) are factored into our holding arrays to generate the final forecast parameters.
After these parameters are computed, the range forecast is produced.
The basis value for the ranges is the mean outcome of the simulations that were run.
Then, quarter standard deviations of the simulated outcomes are added to and subtracted from the basis up to 3σ to generate the forecast ranges.
All of these values are plotted and colorized based on their theoretical probability density. The most likely areas are the warmest colors, and least likely areas are the coolest colors.
An information panel is also displayed at the starting time which shows the starting time and price, forecast type, parent seed value, simulations run, forecast bars, total drift, mean, standard deviation, max outcome, min outcome, and bars remaining.
The interesting thing about simulated outcomes is that although the probability distribution of each simulation is not normal, the distribution of different outcomes converges to a normal one with enough steps.
In light of this, the probability density of outcomes is highest near the initial value + total drift, and decreases the further away from this point you go.
This makes logical sense since the central path is the easiest one to travel.
Given the ever changing state of markets, I find this tool to be best suited for shorter term forecasts.
However, if the movements of price are expected to remain relatively stable, longer term forecasts may be equally as valid.
There are many possible ways for users to apply this tool to their analysis setups. For example, the forecast ranges may be used as a guide to help users set risk targets.
Or, the generated levels could be used in conjunction with other indicators for meaningful confluence signals.
More advanced users could even extrapolate the functions used within this script for various purposes, such as generating pseudorandom data to test systems on, perform integration and approximations, etc.
These are just a few examples of potential uses of this script. How you choose to use it to benefit your trading, analysis, and coding is entirely up to you.
If nothing else, I think this is a pretty neat script simply for the novelty of it.
----------
How To Use:
When you first add the script to your chart, you will be prompted to confirm the starting date and time, number of bars to forecast, number of simulations to run, and whether to include drift assumption.
You will also be prompted to confirm the forecast type. There are two types to choose from:
-> End Result - This uses the values from the end of the simulation throughout the forecast interval.
-> Developing - This uses the values that develop from bar to bar, providing a real-time outlook.
You can always update these settings after confirmation as well.
Once these inputs are confirmed, the script will boot up and automatically generate the forecast in a separate pane.
Note that if there is no bar of data at the time you wish to start the forecast, the script will automatically detect use the next available bar after the specified start time.
From here, you can now control the rest of the settings.
The "Seeding Settings" section controls the initial seed value used to generate the children that produce the simulations.
In this section, you can control whether the seed is a fixed value, or a dynamic one.
Since selecting the dynamic parent option will change the seed value every time you change the settings or refresh your chart, there is a "Regenerate" input built into the script.
This input is a dummy input that isn't connected to any of the calculations. The purpose of this input is to force an update of the dynamic parent without affecting the generator or forecast settings.
Note that because we're running a limited number of simulations, different parent seeds will typically yield slightly different forecast ranges.
When using a small number of simulations, you will likely see a higher amount of variance between differently seeded results because smaller numbers of sampled simulations yield a heavier bias.
The more simulations you run, the smaller this variance will become since the outcomes become more convergent toward the same distribution, so the differences between differently seeded forecasts will become more marginal.
When using a dynamic parent, pay attention to the dispersion of ranges.
When you find a set of ranges that is dispersed how you like with your configuration, set your fixed parent value to the parent seed that shows in the info panel.
This will allow you to replicate that dispersion behavior again in the future.
An important thing to note when settings alerts on the plotted levels, or using them as components for signals in other scripts, is to decide on a fixed value for your parent seed to avoid minor repainting due to seed changes.
When the parent seed is fixed, no repainting occurs.
The "Amplitude Settings" section controls the amplitude coefficients for the three differently tailed generators.
These amplitude factors will change the difference series output for each simulation by controlling how aggressively each series moves.
When "Adjust Amplitude Coefficients" is disabled, all three coefficients are set to 1.
Note that if you expect volatility to significantly diverge from its historical values over the forecast interval, try experimenting with these factors to match your anticipation.
The "Weighting Settings" section controls the weighting boundaries for the three generators.
These weighting limits affect how tailed the distributions in each generator are, which in turn affects the final series outputs.
The maximum absolute value range for the weights is . When "Limit Generator Weights" is disabled, this is the range that is automatically used.
The last set of inputs is the "Display Settings", where you can control the visual outputs.
From here, you can select to display either "Forecast" or "Difference Comparison" via the "Output Display Type" dropdown tab.
"Forecast" is the type displayed by default. This plots the end result or developing forecast ranges.
There is an option with this display type to show the developing extremes of the simulations. This option is enabled by default.
There's also an option with this display type to show one of the simulated price series from the set alongside actual prices.
This allows you to visually compare simulated prices alongside the real prices.
"Difference Comparison" allows you to visually compare a synthetic difference series from the set alongside the actual difference series.
This display method is primarily useful for visually tuning the amplitude and weighting settings of the generators.
There are also info panel settings on the bottom, which allow you to control size, colors, and date format for the panel.
It's all pretty simple to use once you get the hang of it. So play around with the settings and see what kinds of forecasts you can generate!
----------
ADDITIONAL NOTES & DISCLAIMERS
Although I've done a number of things within this script to keep runtime demands as low as possible, the fact remains that this script is fairly computationally heavy.
Because of this, you may get random timeouts when using this script.
This could be due to either random drops in available runtime on the server, using too many simulations, or running the simulations over too many bars.
If it's just a random drop in runtime on the server, hide and unhide the script, re-add it to the chart, or simply refresh the page.
If the timeout persists after trying this, then you'll need to adjust your settings to a less demanding configuration.
Please note that no specific claims are being made in regards to this script's predictive accuracy.
It must be understood that this model is based on randomized price generation with assumed constant drift and dispersion from historical data before the starting point.
Models like these not consider the real world factors that may influence price movement (economic changes, seasonality, macro-trends, instrument hype, etc.), nor the changes in sample distribution that may occur.
In light of this, it's perfectly possible for price data to exceed even the most extreme simulated outcomes.
The future is uncertain, and becomes increasingly uncertain with each passing point in time.
Predictive models of any type can vary significantly in performance at any point in time, and nobody can guarantee any specific type of future performance.
When using forecasts in making decisions, DO NOT treat them as any form of guarantee that values will fall within the predicted range.
When basing your trading decisions on any trading methodology or utility, predictive or not, you do so at your own risk.
No guarantee is being issued regarding the accuracy of this forecast model.
Forecasting is very far from an exact science, and the results from any forecast are designed to be interpreted as potential outcomes rather than anything concrete.
With that being said, when applied prudently and treated as "general case scenarios", forecast models like these may very well be potentially beneficial tools to have in the arsenal.

Forecast OscillatorThe Forecast Oscillator is a technical indicator that compares a security close price to its time series forecast. The time series forecast function name is "tsf" and it calculates the projection of the price trend for the next bar.
The Forecast Oscillator and therefore the time series forecast are based on linear regression. The time series forecast indicator is equal to the sum of two other indicators: the linear regression (LinearReg) and the linear regression slope (LinearReg_Slope).
If the Forecast Oscillator stays above the zero line for an extended period, then it signals that the price may rise in the future and if it stays below the zero line for an extended period, then it signals a coming fall in the security price.
The indicator name is "Forecast Oscillator" and it accepts two arguments. The first argument is the time series that is used in the next bar forecast (It is usually the close price) and the second one is the period that will be passed to the time series forecast function during calculation . The technical analysis indicator returns a value in percentage that corresponds to the close price minus the previous value of the time series forecast, multiplied by 100 and divided by the close price.
Author's Note:
Just look at the exaggerated movements of the oscillator especially in trend changes . Some examples can be experienced on the chart in rectangles.
Kıvanç Özbilgiç

Moving RegressionMoving Regression is a generalization of moving average and polynomial regression.
The procedure approximates a specified number of prior data points with a polynomial function of a user-defined degree. Then, polynomial interpolation of the last data point is used to construct a Moving Regression time series.
Application:
Moving Regression allows one to smooth noise on the analyzed chart, assess momentum, confirm trends, and establish areas of support and resistance.
In addition, it can be used as a simple stand-alone forecasting method to identify trend direction and trend reversal points. When the local polynomial is predicted to move up in the next time step, the color of the Moving Regression curve will be green. Otherwise, the color of the curve is red. This function is (de)activated using the Predict Trend Direction flag.
Selecting the model parameters:
The effects of the moving window Length and the Local Polynomial Degree are confounded. This allows for finding the optimal trade-off between noise (variance) and lag (bias). Higher Length and lower Polynomial Degree (such as 1, i.e. linear), will result in "smoother" time series but at the cost of greater lag. Increasing the Polynomial Degree to, for example, 2 (squared) while maintaining the Length will diminish the lag and thus compromise the noise-lag tradeoff.
Relation to other methods:
When the degree of the local polynomial is set to 0 (i.e., fitting data to a constant level), the Moving Regression time series exactly matches the Simple Moving Average of the same length.

TBT ForecasterThe TBT Forecaster is a visual representation of the "weather forecast" for the crypto market, mainly Bitcoin and ALT coins.
Purpose:
The reason behind creating this indicator is to help give crypto traders a sense of what to expect in crypto currency markets. In general, crypto markets (ALT coins) are extremely dependent on the price action and sentiment of Bitcoin. By knowing what to expect for both BTC and ALT markets, crypto traders will have an edge on other traders by:
knowing when it's a good time to run BTC or stable coin pairs for bots on 3Commas
knowing when the ALT market is in a Bullish or Bearish mood
knowing if we're in a true ALT season or not
knowing if they should be focusing more on active trading on the BTC or stable coin market
Time Frame:
The TBT Forecaster can be viewed on any time frame, but it was originally designed to work off of the 6-hour time frame. Note that faster (higher) time frames can make the tool somewhat unreliable since faster (higher) time frames are subject to more sudden, volatile movements compared to the 6-hour or Daily time frames. To help users of the TBT Forecaster keep a healthy perspective, the indicator can be set to "same as symbol" (the indicator will adapt to any time frame you use) or "6 hours" (the original and intended time frame).
Metrics:
The two lines of the indicator represent Bitcoin (top) and ALT coins (below). The TBO Forecaster uses information derived from the price of Bitcoin, Bitcoin price volatility, moving averages, ATR (Average True Range), Bitcoin Dominance, and the ALT coin indexes (TOTAL2 and OTHERS). All of these metrics are combined and weighted into a system that quantifies the market sentiment for BTC and ALTs.
Sentiment:
The TBT Forecaster shows a gradient of market sentiment, from Bearish to Bullish. These market sentiment labels consist of a variety of different metrics that have to do with volume, price action, and several indices. The full gradient of sentiment is:
Bearish
Weak Bearish (ALT line only)
Neutral
Weak Bullish
Bullish
Realistic Expectations:
Note that it is impossible and unrealistic for the ALTs line to represent every single ALT coin/token/chart/symbol on every exchange. In my experience, there are always good charts to trade no matter what Bitcoin is doing. However, if we as traders know that ALTs are Bearish, then we can focus our efforts on trading Bitcoin (or just staying out of the ALT market until conditions change).
Use the link below to obtain access to this indicator

Running Donchian ChannelsExperimental script to plot a forecast for the Donchian Channels indicator.
By using show_last = 2 , the forecast shows a solid line, this gets messed up on the bar when a new high or low is made.. Like the image below. I don't know how to fix that, please tell me if you do :)

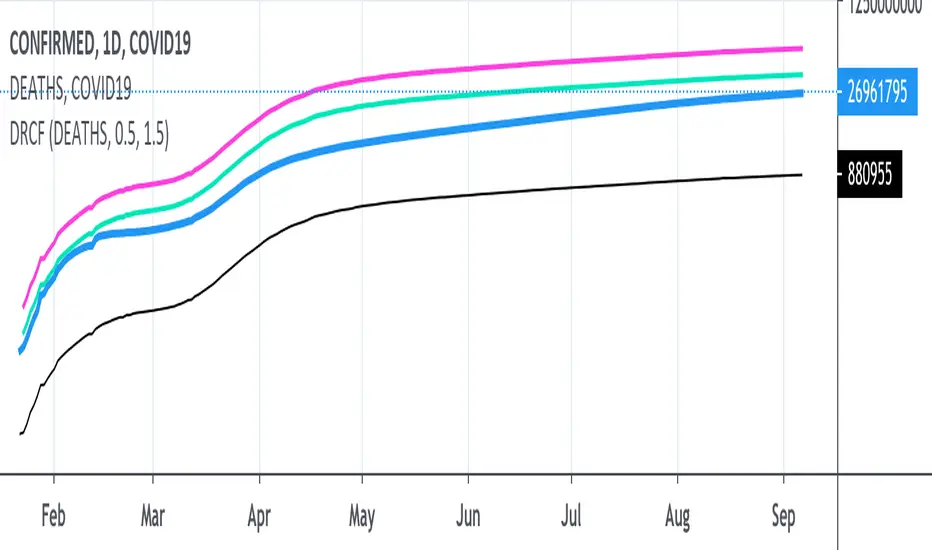
COVID19 Death Rate Cases Forecast (DRCF)The core idea is that given a deaths count and a death ratio, we can calculate how many cases must exist.
Total Cases <-> 100%
Deaths <-> Death Rate
This script plots the total cases for two different death rates.
Death Rate = (Deaths * 100) / Total Cases
Remember to update the DEATHS_X value in the script settings so that it matches the COMFIRMED_X graph you are viewing.
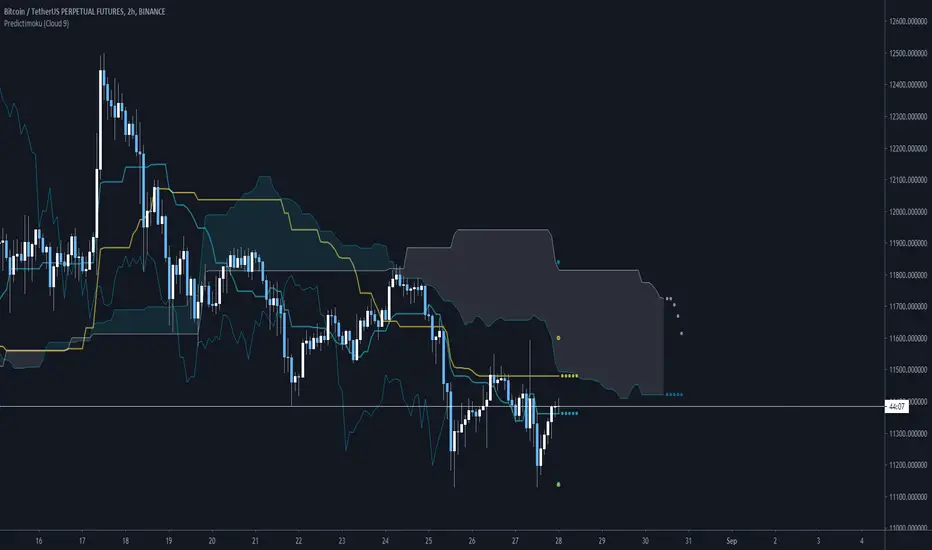
Predictimoku (Cloud 9) - Modified Ichimoku by Cryptorhythms [CR] Predictimoku (Cloud 9) - Modified Ichimoku by Cryptorhythms
📜Intro
New spin on the old standby ichimoku!
Predictimoku (Cloud 9): This indicator uses a proprietary algo to forecast the kijun tenkan & senkou spans accurately out into the future.
📋Background
Unfortunately you may have seen it around twitter as part of a paid for course with indicator set. These influencers claim its "their proprietary indicator". Well the truth is that the source code was stolen from me without payment by some folks who will remain nameless... Then they published the indicator as a private script to avoid moderation/ban (cowards!)
Lesson learned... this is why you never trust anyone until the money is in your hand. And if you see the indicator in the wild as part of some "guru's" overpriced course you will know who the thieves are!
But I wouldnt let that injustice or their shady behavior stand. So that now means you all will get access to it because I am providing it free for the public! :)
📋Features and How to Use
You use this indicator in all the same ways as you would use traditional ichimoku, the underlying structure is the same. Though the default settings are using doubled lookback lengths as per "crypto standard."
The extra functionality comes in the form of accurate and non repainting forecast of up to 17 bars for the kijun, tenkan and senkou spans! This can be useful in many ways for instance it can show you ahead of time when a kumo twist will happen, or a tenkan/kijun cross, etc!
💠Here is an example of the 17 bar forecast:
💠Here is an example of the Trading Range option to show you where price would need to go to force a recalculation of the forecasts. It also provides areas of interest for PA reactions.
💠Last an example of the fibonacci spread. By default the Auto Fib's lookback length is set to 60 to match the kijun lookback. This generally produces a nice framework for near future price action.
💠Look for some more new and unique ichimoku based indicators coming soon from us! :)
About Us
👍 We hope you enjoyed this indicator and find it useful! We post free crypto analysis, strategies and indicators regularly. This is our 84th script on Tradingview! Check signature for more information.
[RS]ZigZag Multiple Methods - Forecast - patterns - labelsexperimental:
zigzag indicator with all the zigzag methods that im aware of(that matter atleast), theres something for all tastes there :P
this will be the basis for zigzag tools i make in the future.
note: some zigzags REPAINT.
Quadratic RegressionFit a quadratic polynomial (parabola) to the last length data points by minimizing the sum of squares between the data and the fitted results. The script can extrapolate the results in the future and can also display the R-squared of the model. Note that this script is subject to some limitations (more in the "Notes" section).
Settings
Length : Number of data points to use as input.
Offset : Determine the number of past fitted values to be displayed, if 0 only the extrapolated values are displayed, if 55 only the past fitted values are displayed.
Src : Input data of the indicator
Show R2 : Determine if the value of the R-squared must be displayed, by default true.
Usage
When the underlying trend in the price is not linear, we might use more advanced models to estimate it, this is where using a higher-degree regression model might be required, as such a quadratic model (second-degree) is appropriate when the underlying trend is parabolic.
Here we can see that the quadratic regression (in blue) offer a better fit than a linear one.
Another advantage of the quadratic regression is that a linear one will always have the same direction, that's not the case with the quadratic regression and as such, it is possible to forecast reversals.
Above a linear regression (in red) and two quadratic regression (in blue) with both length = 54. Note that for the sake of clarity, the above image uses a quadratic regression to show all the past fitted values and another one to show all the forecasted values.
The R-Squared is also extremely useful when it comes to measuring the accuracy of the model, with values closer to 1 indicating that the model is appropriate, and thus suggesting that the underlying trend in the price is parabolic. The R-squared can also measure the strength of the trend.
Notes
The script uses the function line.new , as such only a maximum of 54 observations are displayed, getting more observations can be done by using an additional quadratic regression like we did in the previous section. Another thing is that line.new use xloc.bar_time , as such it is possible to observe some errors with the displayed results of the indicator, such as:
This will happen when applying the indicator to symbols with session breaks, I apologize for this inconvenience and I'll try to find solutions. Note however that the indicator will work perfectly on cryptos.
Summary
That's an indicator I really wanted to make, even if it is important to note that such models are rarely useful in stock markets, however it is more than possible to create a quadratic regression (with severe limitations) with pinescript.
Today I turn 21, while I should be celebrating I still wanted to share something with the community, it's also some kind of present to myself that tells me that I am a bit better at using pinescript than last year, and I am glad I could progress (instead of regress, regression , got it?). Thx a lot for reading!
[RS]Simple Forecast - Keltner WormsEXPERIMENTAL:
Using keltner channels with automatic multiplier finding, offsets and show_last cutoffs to generate a forecast area.
video showing why its named keltner worms :p..
streamable.com

[RS]Shotgun ForecastsExperimental:
its a play at linear forecasting.
use replay feature to see it in action:
streamable.com

MyAlgoPLEASE READ THE ENTIRE POST BEFORE PURCHASING & USING THE MyAlgo Tool. Saves you and me some time in emails and messages. :)
This is the official version of MyAlgo
PLEASE UNDERSTAND THAT THIS IS A DIFFERENT AND SEPARATE PRODUCT AND SCRIPT FROM "MyAlgo SLIM" FROM THE MyAlgo TRADING TOOL SERIES
Description
Buy & Sell Alerts can be set on all Tickers. This includes, but is not limited to Crypto, Commodities , FOREX, Equities and Indices. Also all candle Types are compatible.
Recommended Time-frames - Due to the complexity of MyAlgo-SLIM the user has a choice between three algorithms and is like that able to trade on all timeframes with the highest returns.
MyAlgo combines many different aspects at the same time, scans multiple other Algorithms and comes to a conclusion based on over 1350 lines of code.
It is based on Divergences, Elliott Waves , Ichimoku , MACD , MACD Histogram, RSI , Stoch , CCI , Momentum, OBV, DIOSC, VWMACD, CMF and multiple EMAs.
Every single aspect is weighted into the decision before giving out an indication.
Most buy/sell Algorithms FAIL because they try to apply the same strategy to every single chart, which
are as individual as humans. To conquer this problem, MyAlgo has a wide range of settings and variables which can be easily
modified.
To make it a true strategy, MyAlgo has as well settings for Take Profit Points and Stop
Losses. Everything with an Alert Feature of course so that FULL AUTOMATION IS POSSIBLE.
I know from experience that many people take one Algorithm and are simply too LAZY to add multiple Algorithms to make a rational choice. The result of that is that they lose money, by following blatantly only one Algorithm.
MyAlgo has additional 15 Indicators, perfect for all markets, which can be turned on and off individually.
Side Notes
MyAlgo is being updated and upgraded very frequently to suit the requests of our customers.
This is not financial advice. Please read our disclaimer before using.
Anything below this sentence will be Updates regarding MyAlgo
Indicator: Weight Of Middle [xQT5]This is my original indicator that was inspired by "Mayer Multiple" and "Chande Forecast Oscillator" (CFO).
I decided to search truth of trend power with SMA and LinReg and found it in a somewhere of the middle. Also, I added a limit area, where you need to keep a more attention, because it can show a potential reversal.
You can change parametrs with a your own look.
One more signal for indicator:
- If "WOM" is above "1" - it's a bullish direction;
- If "WOM" is below "1" - it's a bearish direction.
Enjoy it!