[UPRIGHT Trading] Trend Direction Force Index (TDFI)The Trend Direction Force Index, TDFI or TDF Index, is a staple in the Forex community, but is excellent on most asset (i.e. stock) trading.
Developed by Pyotr Wojdyo for metastock trading platform originally, but now on several other.
The idea of the TDFI is that there is enough trend directional force to enter the trade.
How it works:
When the signal is above the high threshold, the trader can go long.
When the signal is below the low threshold, the trader can go short.
It's usually used as confirmation along with another indicator.
Features:
Fully customizable
Built-in color changing
Alerts!
If you like this, you will definitely like what else I've published.
Like, follow, support, etc.
Enjoy.
Cheers,
Mike
(UPRIGHT Trading)
Forex

Trend Trading with Currency Strength MeterThis is a trend trading strategy designed mainly for forex made of two big components:
First we have the currency meter, which is made of taking TSI of different INDEXes such as EUR, USD, GBP, JPY, NZD, AUD , CHF and CAD.
Once we establish which one is the weakest and most powerful, we pair them together and we go on that chart.
Lastly we check with the EMA 200 to confirm our direction.
We can see in this example for the USDJPY chart, that USD is the strongest, JPY is the weakest and ema confirm our bullish trend.
For timeframe in general I recommend big timeframes, 1-4h+ , and as a mentality a swing trading mentality, we can stay in trade for days/weeks.
For exit in general I recommend to exit when either one of the pairs losses/gain power or when the EMA is crossing with current candle
If you have any questions, let me know !

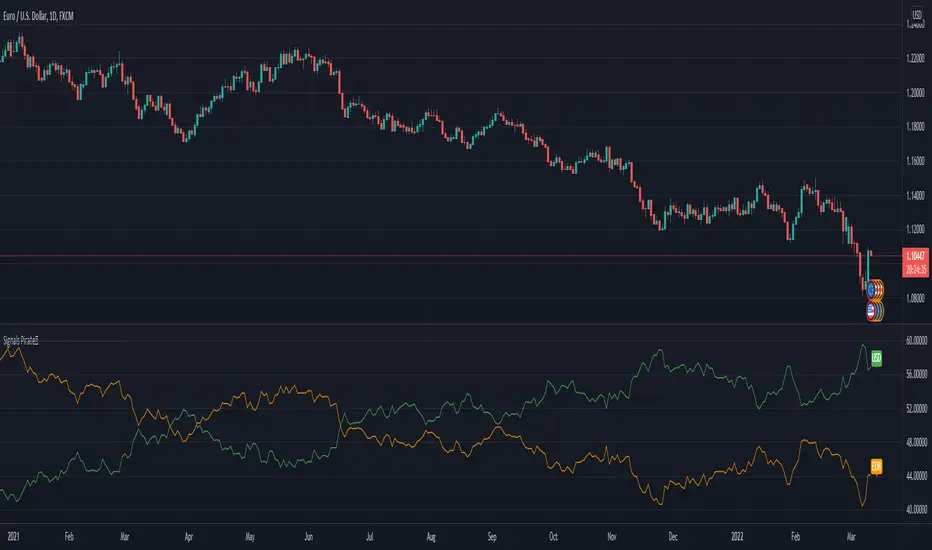
Signals Pirate™ Currency Strength IndicatorSignalsPirate™ Currency Strength package was created to take your Forex trading to the next level. With a simple yet intuitive display of the underlying strength of all major currencies it’s a great tool to add to your arsenal, or even as your sole trading strategy component!
The only input required to fine tune the underlying logic is the ‘Length’ variable, this can be adjusted to alter the look back period for strength determination. This metric is calculated using a combination of strength indicators such as the RSI, Stochastic, ADX and more applied to the underlying currency index, such as the DXY for the USD. When the Currency Strength value increasing for any given currency, it’s a great indication that there is great underlying strength as the currency becomes more valuable in comparison to other currencies; and vice versa as the value decreases.
The default settings are the best settings we’ve found so far but you can change them to build your own unique trading strategy. We’d recommend experimenting with values to find the best results for the asset you are trading, and your own personal trading and investing style.
Direction for use:
1. Use on any asset (preferably Forex) and time frame.
2. Fine tune the Length input and customise the visuals.
3. Watch for divergences between strong and weak currencies as the strength value increases/decreases.
4. Consider longing currencies that are showing overwhelming strength vs currencies that are showing weakness, and do the opposite for short trades. For example, if the USD is massively increasing in strength and the EUR is decreasing, shorting EURUSD may be a trade to watch.
5. Be aware of the strength values changing, closing trades as the divergences decrease is sensible.
As mentioned previously, this is a strength system that dynamically operates to function with superior accuracy regardless of what currency you’re trading. But with the level of customisation available, this can easily be fine tuned to accommodate scalping, reversal trading, or even long term investing.
We hope you love this Forex and Currency Strength tool, and it takes your trading and investing to the next level. Please let us know if you have any questions or queries, or if you have any suggestions for improvements etc. We love your feedback and are constantly striving to continuously improve!
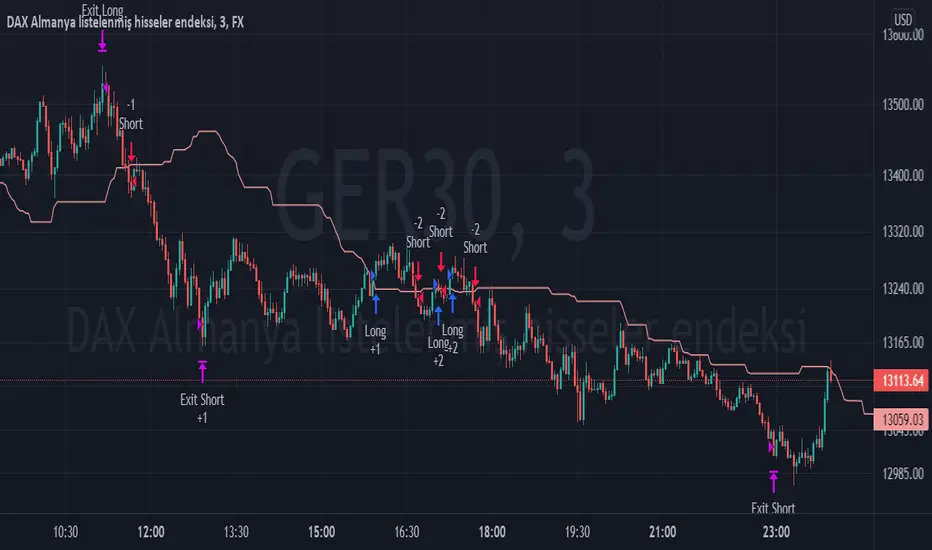
TPS - FX TradeI based my strategy on the Lagging Span 2 line in the Ichimoku Cloud. I actually designed the strategy for the DAX Germany index 3 Minutes period, but you can use it on any instrument you want. I would like to point out some points that you should pay attention to when optimizing the strategy for the instrument you want to use.
Position Take Profit and Stop Loss levels are tick calculations. These values will differ for each instrument. If you are trading in Forex, the values you will write here should be starting from the numbers after the comma in the instrument value. For example, if you want to take profit at "200" points in DAX, you must write "20000" in the Long or Short Take Profit Score field, this applies to the Stop Loss Points, but if you want to take profit or stop loss at 200 points in UKOIL, you must write "200" in the entry part.
Simple FX Market Hours█ OVERVIEW
A simple market session indicator that show you what market is in session according to the timezone you configured. It will draw a table with 4 cells matching 4 market Sydney, Tokyo, London and New York. Whenever market is in session the matching text will change colour.
█ WHAT MAKE THIS DIFFERENT
All other indicator on the market are either bar colouring, background colouring, or some sort of box drawing on the chart which is very messy and cluttered your chart. This indicator is as simple as it gets. The label are positions by default at the top right corner (you can change this in the config). It doesn’t draw anything on your chart so you can get right into your price action without anything blocking you.
Also, these type of indicator on the market are not auto converting the market session time to your your configured timezone, you will have to manually entered in the market session hours in your local time. This indicator does! Or perhaps I didn’t look hard enough. Either way I think there aren’t any indicator that are this simple.
█ HOW IT WORKS
I’m using table function (available to pinescript version 4 and above) to position the market labels and change colour of them according to if the market is in session or not.
For timezone, I have predefined all the market hours in all of the timezone from GMT-12 to GMT+12. When you select your timezone it will convert it to the symbol’s exchange timezone. Feel free to update the timezone if I had it incorrectly.
This script doesn’t take into account the DST because DST doesn’t starts or ends on a fixed date.
I also put in a check for symbol type using: syminfo.type == "forex”. So that it will only display if you are on forex pairs. You don’t need to hide it while you are looking at crypto or other assets. For convenience purposes.
█ NOTES
If you like the script be sure to press the like button it will help shows other people that this is useful. Thank you very much!
AnyChartI changed few lines of code from TradingView's original Open Interest indicator to make this one. I wanted to compare other charts to while entering my trade like looking at BTC when trading in alts. It has option to view any chart. Add other things to improve your analysis.

Forex Dogs Moving Averages with Distance TableThis is an indicator based on the book【Forex】ForexDog’s Vacuum Zone Trading 2021: Trading Strategy to “not lose” based on Experience and Logic written by Forex Dog (yes, this is his author name on Amazon; he is a trader popular mostly in Japan). It consists of simple moving averages which should somewhat correspond to the higher timeframes moving averages. The original was traded on a 15m chart and the periods are as follows: 5, 20, 40, 50, 80, 100, 200, 400, 640, 1600, 1920, 3200.
Then, there is a big table with a distances overview. This should give you an idea of how far each average is in ticks. The minus in front of the ticks_total signifies direction.
I expect some feedback on this because I don't think the user convenience is very with tables being so bright. My goal is to create a system that limits the number of "noodles" on the chart but still carries the information via the tables on the side.
Moving Average Length is not adjustable by design. The book says to use these quite explicitly, although the logic would work just fine with some other levels, it would not be the original strategy.
Good luck!

Fusion: Forex sessions with daylight savingsThis has multiple ways to see Forex sessions as I found both on the main chart and on a separate chart useful at different times so this gives you the benefit of both.
When you want to use this separate from your main chart uncheck it the option "On main chart".
On the main chart we can show:
The legend
Boxes
Labels
Breakout check area
Start & end labels
On any other chart area we can show:
The legend
Horizontal bars representing the sessions.
All objects are color coded and the legend shows the color codes.
Credit:
Blended my own sessions indicator and "FX Market Sessions" by boidoki
The code is structured to easily drop into a bigger system so use it as a lone indicator or add the code to some bigger project you are creating.
Finally, if you find value please do make a comment, give thumbs up etc.
Enjoy and good luck!

Auxiliary Equity Configurator (AXE)Auxiliary Equity Configurator (AXE) is a whole new level money management auxiliary that calculates statistically preferable lot based on the Account balance, Winning rate, Risk reward ratio, and Kelly multiplier configured a priori in the input panel.
On the chart, RR visualization bands, Expected balance history matrix in the worst successive trading loss (for displaying how many times you can trade with a given lot at simple/compound interest), and Info-table for the calculation details are shown.
Regarding RR visualization bands, whenever the Tolerable drawback input changes, the proper lot is calculated based on the given data. You can easily access how many lots you should possess and the take-profit/stop-loss price to set. A tolerable drawback can be placed in the quoted currency rate of the displayed chart, except the forex and part of CFD symbols (Gold, Silver, Platinum, WTI oil, Brent oil, Natural gas, and more in the future!) that is valued in Pips. Parameters are configurable in suit with the broker you are using. Also, RR visualization bands are brilliantly interactive, thanks to pine v5 interactive scripts.
The currency for Account balance and Tolerable drawback is automatically converted to USD for internal calculation; therefore, no mess-ups around thinking currency value conversion whatsoever! The design for each tool is highly customizable, too.
Unleash yourself from consuming the colossal amount of time thinking of money management with AXE!
DTFL FOREX OverlayThese tools are used by FOREX traders who primarily follow the DTFL trading strategy, however, they can easily be utilized by any other FOREX trader looking for an all-in-one indicator that includes sessions, previous high/lows, session values, various moving averages and lockable ADR/ATR lines.

Holyscalp v.3 A MACD 15 min trading strategy,
I set two macd trends that must match in trend direction to be traded,
along with that they must follow the moving average trend set in place
the trades trigger with an atr stop loss indicator "atr+" by zedartoftrading to be exact
It automates fully through autoview/oanda broker
the ma breach settings look back however many bars set in place and see if the bars are closing in opposite trend to the moving average
*TIP get another chart with same forex pair and take and change the candle sticks to heikin candles and set chart to 1D and trade only with that trend for the 15min settings, you can disable short trades by setting the threshold limit to 1 and to disable long trades set threshold to -1
Dec 31, 2021
Release Notes: for my use only
an hour ago
Release Notes: It trades based on these parameters I set in place.
1. The long term macd trend and the short term macd trend must match
2. The atr+ can not be more than 3x the previous atr.
3. It must trade with the trend set in place, I have two moving averages to choose from, to disable the second moving average set it to 1.
4. Don't touch the hammer and star fib level leave at zero, need to code that separately
5. the MA breach looks back a certain amount of bars to try and stop trading while its consolidating. I set at 1:0
an hour ago
Release Notes: Just updated the default settings, Remember they are set for optimization for 15mins but the same rules and parameters still apply to longer time frames, just change the moving averages to your liking if you want to move up timeframes.

High - Low Difference (Forex)This script is created to read and label the difference between High and Low of a candle in points term & in percentage term.
This is basically made for Forex Trading.
Do explore the settings of the scrip.

SMART4TRADER - BREAKOUTThis indicator shows the breakthrough of extremes for the selected period. The default period is set = 3
The indicator checks on the current bar whether the maximum or minimum prices for the selected period are broken
----------------
Данный индикатор показывает прорыв экстремумов за выбранный период. По-умолчанию выставлен период = 3
Индикатор проверяет на текущем баре пробиты ли максимальные или минимальные значения цен за выбранный период

Heikin Ashi Trailing Stoploss ActivationThe Basics
This indicator should be used on regular candle sticks. It is possible to trigger an alert, when the block flips from red to green bar. Or vice versa.
Red block represents a red Heikin Ashi candle.
Green block for green Heikin Ashi candle.
It can be used as a trailing stoploss for (DCA/ TV) bots, when riding trends.
What Makes It Different
The user can preset the price (of the asset e.g. BTC), where it will start looking for Heikin Ashi flips. Every Heikin Ashi flip before this preset price will be ignored. Preset prices could be chosen tactically at resistance levels.
Different time frames of Heikin Ashi flips can be used together. E.g. 10 min, 3 hour or 2 Day time frames. If this is possible within your Tradingview subscription.
Example
The user has a long position (bought at the green arrow.) The user wants to start trailing at price 88 USDT (blue line).
The indicator will only trigger when the following conditions are met:
Cross of red block on the indicator (representing red Heikin Ashi candle)
Price has crossed 88 USDT
If the candlestick turns from a green to a red block, before crossing 88 USDT. It will NOT trigger the alert. Visible as the orange down arrows. In the indicator below it is displayed as a red block.The alert will go off at the red down arrow on 10th Nov (if chosen for Once per bar close). The price condition of 88 USDT was already met at 7th Nov.
Final Words
Disclaimer: Please use it with care and at own risk. The owner of this indicator is not liable for any financial losses.
Past performance is no guarantee of future returns.

Currency Strength DashboardDrawing Currency Strength (consists of: USD, EUR, JPY, GBP, AUD, CHF, CAD, NZD) historical plots in parallel with currency strength heat map and dynamic legend, which makes this script unique as Dashboard.
Calculation criteria is based on user's input: Session, by which you can recalculate based on D, W, M.
Supertrend NinjaSupertrend Ninja
The Basics
The Supertrend Ninja is a trend-following indicator. The indicator is optimised for daily, 2 days and 3 days candlesticks and can be used on varying trending markets.
Supertrend Ninja using 2 days candlesticks only gave 7 bullish signals in 2020 and 2 in 2021 for Bitcoin/USDT (based on Binance charts). Greatly reducing false signals. It can be used on lower time frames as well, although you will encounter more noise.
This indicator could be used as a compass for DCA or TV bots as well.
What To Look For
When the background of the candlestick closes green with an upwards pointing pink arrow. It indicates a possible bullish (up)trend. To enter a trade its best to place an order a few ticks above the candle high. This way we only enter a position, when there is trend continuation.
When the background of the candlestick closes red with a downwards pointing black arrow. It indicates a possible bearish (down)trend. To enter a trade its best to place an order a few ticks below the candle low.
Exits can be determined by Fibonacci extensions, orderblocks or other resistances to name a few. Or exit the trade when the opposite background color appears.
Final words
Disclaimer: Please use it with care and at own risk. The owner of this indicator is not liable for any financial losses.
Past performance is no guarantee of future returns.

Contrarian Scalping Counter Trend Bb Envelope Adx and StochasticContrarian Scalping is an trading strategy designed to take advanted of a counter-trend.
The advantage of these strrategies types is that they have a good profitability but with do not great gain (in relation at the time frame).
Indicators used:
Bollinger
Envelope
ADX
Stochastic
Rules for entry
For short: close of the price is above upper band from bb and envelope, adx is below 30 and stochastic is above 50
For long: close of the price is below lower band from bb and envelope, adx is below 30 and stochastic is below 50
Rules for exit
For short: either close of the candle is below lower band of bb or enveloper or stochastic is below 50
For long: either close o the candle is above upper band of bb or envelope or stochastic is above 50
If there are any questions let me know !

Triple CSWhat this indicator does:
This indicator will be scanning for ranges of extremity.
It measures multiple underlying factors in the financial markets like measuring levels of strength using RSI, momentum using Stochastics and extreme ranges using Bollinger Bands.
What is "extreme range" criteria: ranges above 70 or below 30 on RSI and Stoch are considered extreme, as well as moments of extreme volatility exceeding overbought and oversold levels on BBs.
All monitored data is to be plotted in a horizontal row, providing information about oversold, overbought and mid-range market conditions. This data will either meet the criteria simultaneously and plot a Red or Green indication or it will miss one or more requirements, plotting Gray indications.
This indicator is a real-time indicator, meaning it's updating live and due to this tracking in real-time, indications not yet 'printed' can give false readings. For performance purposes, it is best practice to allow all indication plots to 'print', meaning if a plot ever changes in color, it's best to allow that candle to fully close , ticking to 0:00 before confirming the accuracy of the indicator's findings.
How it works:
This indicator scans multiple sources of data simultaneously. When appropriate conditions within a trading range are met, the indicator will update it's color.
The indicator will plot Gray , Green , and Red indications which can be explained below.
-
Grey plots : No indication of full extremity, meaning one or more conditions being tracked has not met requirements, suggesting price is likely in mid-range.
-
Green plots : Extremity level lows have been simultaneously met, data indicates extreme oversold conditions are likely present.
-
Red plots : Extremity level highs have been simultaneously met, data indicates extreme overbought conditions are likely present.
What market will this indicator work on?
Stocks > Forex > Crypto
All the above are supported by this indicator.
Charts with more history have more data for the indicator to utilize. (Lack of data can result in poor performance.)
- This indicator performs best on 4H, 12H, D, and W timeframes, although you can use this indicator on any timeframe TradingView supports.
This indicator was created to find ranges of extreme trade which can help traders be more confident in their timing with the market.
Trading can be difficult, let an algorithm scan the market and monitor for early signs of volatility changes.
Past performance does not guarantee future results. Please do your due diligence when placing trades.

Sessions & Days Of The WeekTraders tend to focus their energy on specific sessions or time periods. This indicator will plot the days of the week, and also highlight the following sessions: Frankfurt (2:00am - 11:00am EST), London (3:00am - 12:00pm EST), New York (8:00am - 5:00pm EST), Sydney (5:00pm - 2:00am EST), Tokyo (7:00pm - 4:00am EST).
It’s important to be aware that Session Open and Close times will vary based on the time of year, as countries shift over to daylight savings time.
BollingerBands Strat + pending order alerts via TradingConnectorSoftware part of algotrading is simpler than you think. TradingView is a great place to do this actually. To present it, I'm publishing each of the default strategies you can find in Pinescript editor's "built-in" list with slight modification - I'm only adding 2 lines of code, which will trigger alerts, ready to be forwarded to your broker via TradingConnector and instantly executed there. Alerts added in this script: 14, 17, 20 and 23.
SCRIPT INCLUDES PENDING ORDERS AND ALERTS! Alert will be sent to MetaTrader when order is triggered, but not yet filled. That means if market conditions change and order does not get filled, it needs to be cancelled as well, and there are alerts for that in the script as well.
How it works:
1. TradingView alert fires.
2. TradingConnector catches it and forwards to MetaTrader4/5 you got from your broker.
3. Trade gets executed inside MetaTrader within 1 second of fired alert.
When configuring alert, make sure to select "alert() function calls only" in CreateAlert popup. One alert per ticker is required.
Adding stop-loss, take-profit, trailing-stop, break-even or executing pending orders is also possible. These topics have been covered in other example posts.
This routing works for Forex, indices, stocks, crypto - anything your broker offers via their MetaTrader4 or 5.
Disclaimer: This concept is presented for educational purposes only. Profitable results of trading this strategy are not guaranteed even if the backtest suggests so. By no means this post can be considered a trading advice. You trade at your own risk.
If you are thinking to execute this particular strategy, make sure to find the instrument, settings and timeframe which you like most. You can do this by your own research only.

Scalping Trading System bot Crypto and StocksThis is a trend trading strategy scalping bot that can work with any type of market. However I concluded my tests so far with Crypto, Stocks and Forex, and with optimizations always could be found some profitable settings.
Indicators
SImple Moving Average
Exponential Moving Average
Keltner Channels
MACD Histogram
Stochastics
Rules for entry
long= Close of the candle bigger than both moving averages and close of the candle is between the top and bot levels from Keltner. At the same time the macd histogram is negative and stochastic is below 50.
short= Close of the candle smaller than both moving averages and close of the candle is between the top and bot levels from Keltner. At the same time the macd histogram is positive and stochastic is above 50.
Rules for exit
We exit when we meet an opposite reverse order.
This strategy has no risk management inside, so use it with caution !

Fibonacci Moving AverageThe Fibonacci Moving Average is a powerful indicator that takes into account many underlying moving averages to give out an approximate short-term/long-term view of the markets. Its strength lies with dynamic support and resistance levels. I have created this indicator in order to improve trend-following entry positions.

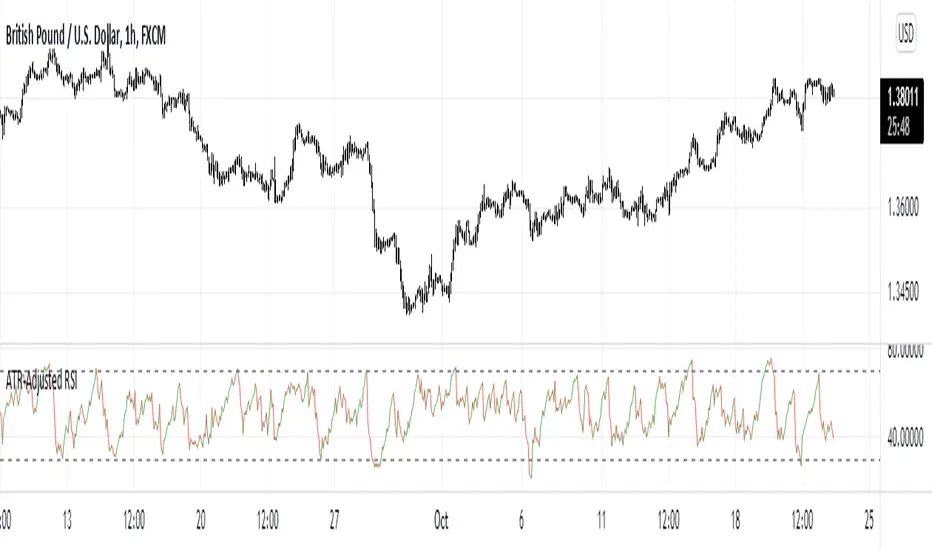
ATR-Adjusted RSIThis indicator adjusts the RSI values using the Average True Range. It is used the same way as a normal RSI.