PpSignal Variable Index Dynamic Average V2The Moving Average is, perhaps, the most popular indicator in trading for a reason. Comparatively, the crossing average can tell you plenty about a trend, i.e. whether it’s broken or unbroken, changing or holding. But the Moving Average isn’t perfect; there is one area where it falls short and that is volatility. Even an Exponential Moving Average, which places more emphasis on the latest data, can miss the mark when it comes to a sudden change in volatility, rising or falling. Consequently, it can either give a fake signal or else generate a signal only when it is too late to trade on. Volatility is where the Variable Index Dynamic Average comes in, or VIDYA for short.
The Variable Index Dynamic Average or VIDYA was developed by Tushar Chande, and its focus is precisely on volatility. In other words, the VIDYA is an average that adjusts itself to changing volatility. When volatility is high, the VIDYA becomes more sensitive and when volatility is low, the VIDYA becomes less sensitive. That allows you to assess the trend according to current market conditions (and not irrelevant conditions that had earlier prevailed).
The VIDYA in Essence
The math behind the VIDYA formula is quite complicated, but the logic is not.
The VIDYA essentially has two components, the first being the Exponential Moving Average (aka EMA). The second indicator is in the “oscillator family” and it is known as the Chande Momentum Oscillator (aka CMO). Like most oscillators, the Chande Momentum Oscillator generates a signal of -100 and 100, with -100 being oversold and 100 overbought. The EMA is the anchor index, and the CMO’s job is to adjust the exponential average to volatility. The closer the CMO is to 100 or -100 the higher the volatility and the more sensitive our exponential average will turn. Conversely, the closer the CMO is to 0 the less sensitive our exponential average will turn. The final reading after the volatility adjustment is the VIDYA.
As you can see below, once you add the Variable Index Dynamic Average in MetaTrader you get a window with two parameters from which to choose: One is the Period CMO and the other is Period EMA. We can then decide which period the CMO will run on (and thus affect the sensitivity of our EMA) and which period the EMA will run on (to capture our trend). Usually, the best CMO to plug in is a third of the value of the EMA duration; this is to allow the latest change in volatility to impact to the greatest degree. If the CMO period is too long, it will likewise spread over the period too long and consequently fail to reflect current levels of volatility, thus defeating the VIDYA’s purpose.
VIDYA
Comparing the VIDA to the EMA
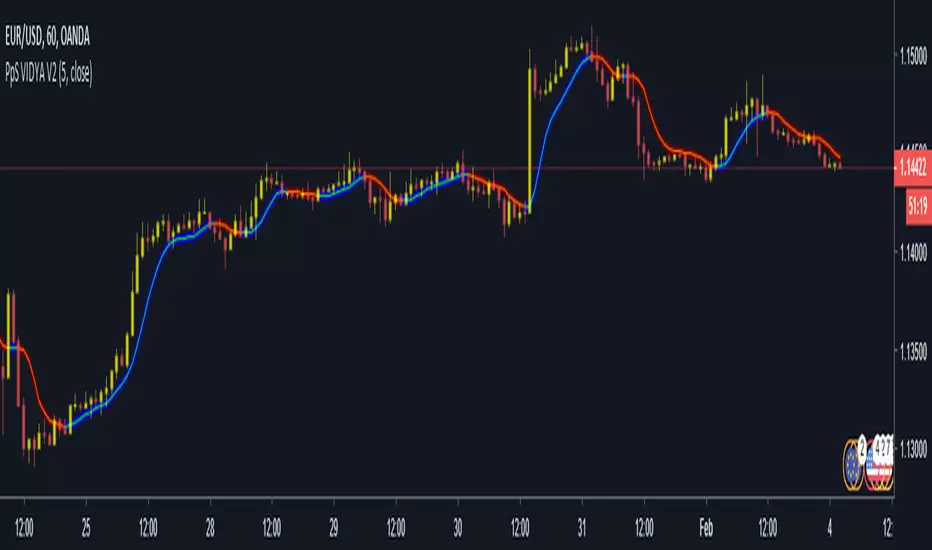
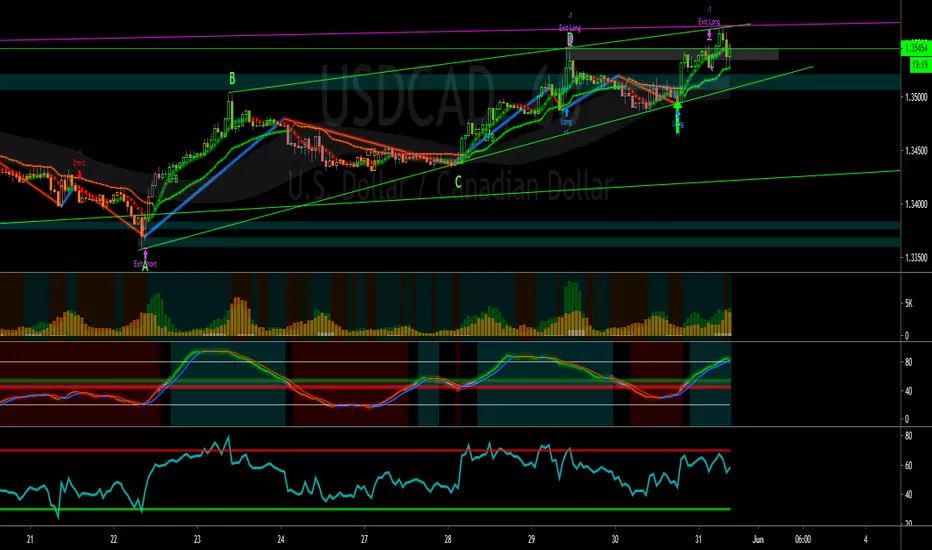
When we compare the two, we can see the clear advantages the VIDYA(Red) has over the EMA(Green). Both the VIDYA and the EMA run on a 30-week period, but the VIDYA is smoothed out by the Chande Momentum Oscillator running on a 10-week period (again, a third of the whole period). The VIDYA simply captures the trend much more accurately. We can see how, in Point A, when momentum weakens, the Variable Index Dynamic Average starts to flatten, while the EMA just moves across the price and fails to adjust.
This quality is especially beneficial when we want to get an indication if a trend has broken or not. The EMA, in this case, suggests the trend has, indeed, broken but when we look at the VIDYA we quickly get a more accurate picture. We can see that the downtrend has not been broken which allows us to prepare for another bearish round rather than mistakenly expect a rebound.
VIDYA
Of course, for every upside there is a downside and the downside of the VIDYA is that it becomes less effective on a very high duration, such as above 90. The Chande Momentum Oscillator cannot reflect sentiment very well when the duration ןד high and therefore it stops being effective at balancing the Exponential Moving Average within the Variable Index Dynamic Average. One way to tackle or mitigate this is to go higher in the intervals whenever possible, such as from days to weeks or weeks to months. Nonetheless, you should be cognizant of this in inherent weakness in the Variable Index Dynamic Average. Yet, despite that, the Variable Index Dynamic Average does a very effective job. If you are trading under volatile conditions and want to figure out if a trend is broken or set to continue, the Variable Index Dynamic Average could be the solution. When combined with other indicators of momentum, the VIDYA can give you the bigger, clearer picture.
www.onestepremoved.com
Forex
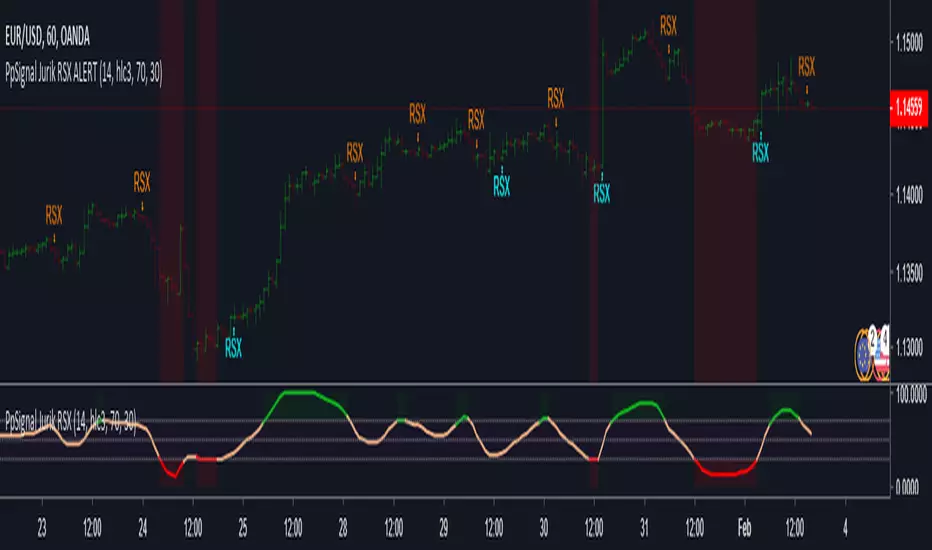
PpSignal Jurik RSXJurik RSX
Mark Jurik is a brilliant engineer and has done amazing work creating smooth, minimum lag indicators. I’ve bought a lot of his indicators and in fact I have used the Jurik Moving Average (JMA) to pre-process (smooth) data for the Better Sine Wave indicator. You can check out his website here.
emini-watch.com
www.jurikres.com
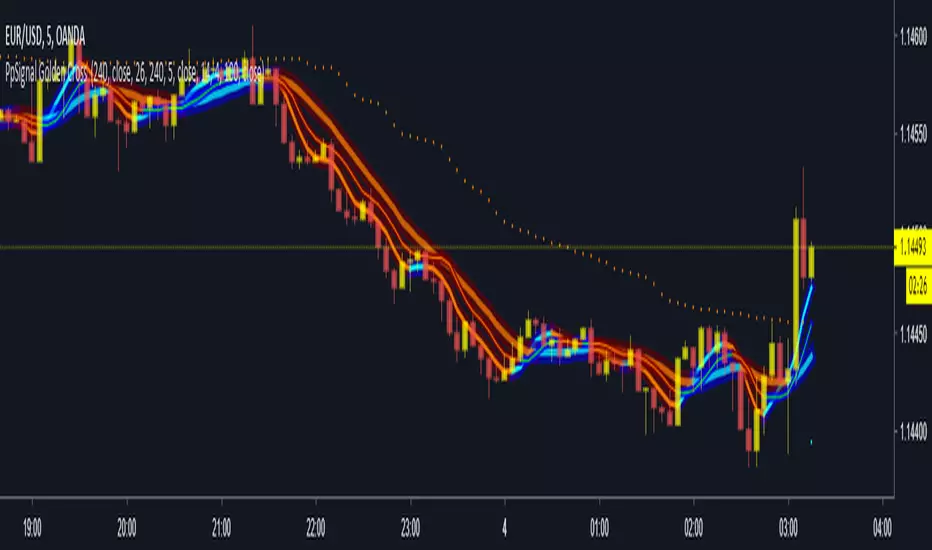
PpSignal Golden Cross we did a 3 move average combination.
We recommended use with ewo MTF breack band.
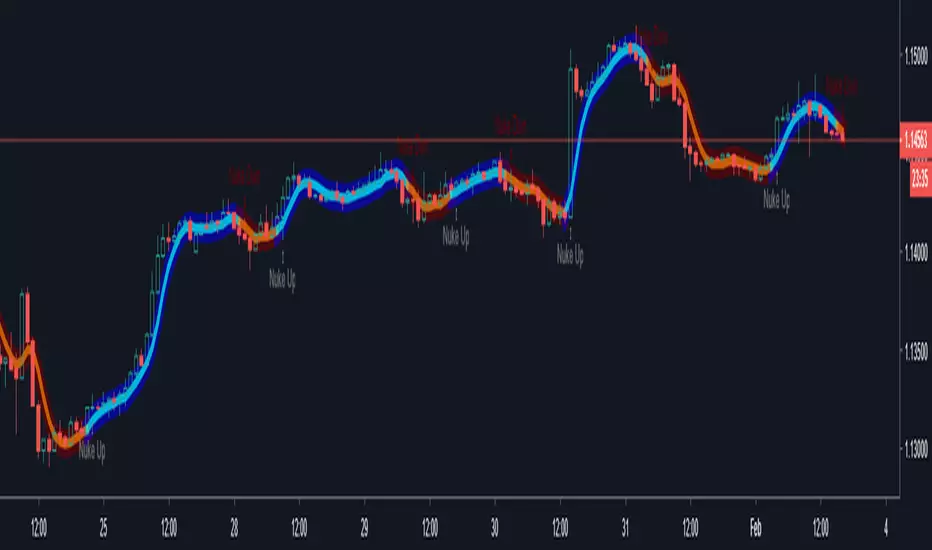


PpSignal EMA Smooth Envelope [LazyBear]LazyBear indicator, I added a smooth John Ehlers and CFB for a trend follow

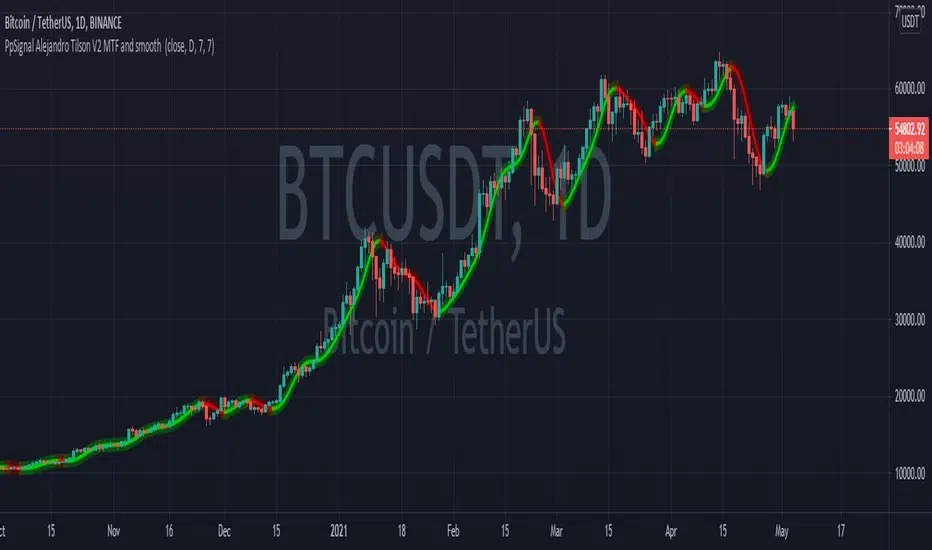
Alejandro Tilson T3 V2 MTFTilson Move average with John Ehlers smooth system adn buy or sell signal trade.
enjoy

PPSignal Scalper Double Cross Signal and EWO Smooth V4.0Recomendation
-for grafic 4h and D use
PPS W Signal
EWO W Signal
-For signal 30 min to 3H
PPS D and W signal
EWO D Signal
For signal < 30 Min
PPS 1H and $h
EWO 1H


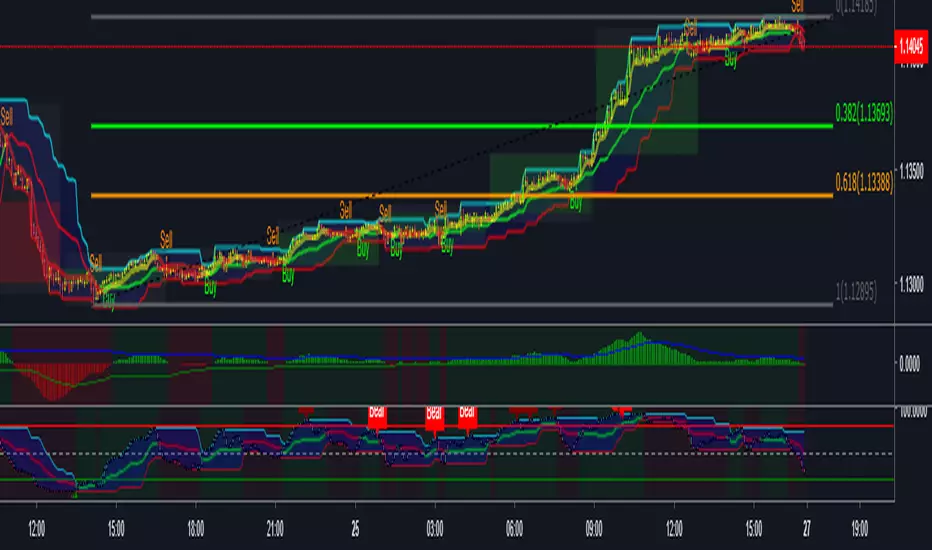
PpSignal Fibonacci Golden Zonefibonacci golden zone is a popular forex system for buy or sell fibo areas.
Buy in 38 fibo zone and sell in 61 fibo zone. when the fiboncci trend is up, the fill color between 28 and 61 is yellow, when the trend is down the fibonacci color is red.
a recommended use some move average with some oscillator for a find the trend.
Move average recommended serhttps://www.tradingview.com/script/guQUYY7J-PpSignal-Trend-Follow/
Oscillator see

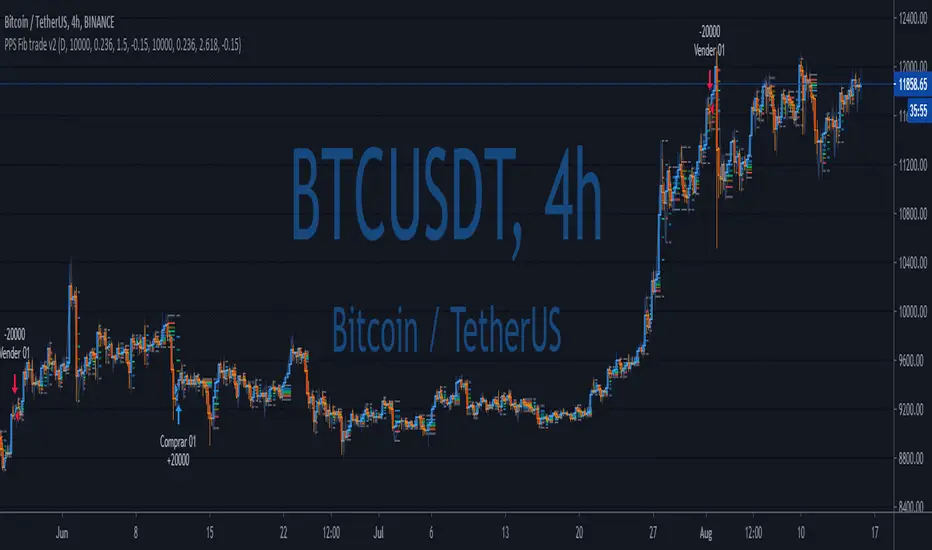
PPSIGNAL fibo trade V 2Fibonacci trade is a combination between break Fibonacci time strategy and pattern harmonic strategy.
When the system identify a harmonic pattern wait the buy signal in the 38,2% Fibonacci zone and sell when the harmonic pattern end and in fibo 61,8% zone.

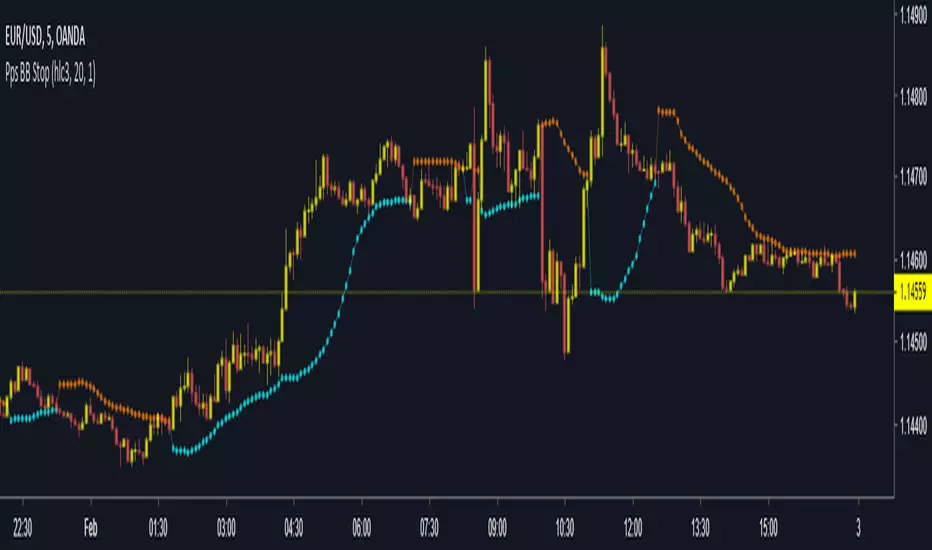
PpSignal Donchian Channels CFB and BB StrategyHere we are combine cfb with bollinger band and donichian midle line channel estrategy
This technique is for those who want the most simple method that is very effective. The best trade are during the busiest trading hours, 3am to 12am EST NY time. This method does not work in sideways markets, only in volatile trending markets.
Time Frames: 1, 5, 10, 15, 30 min.
Currency pairs: majors and btc
Essential chart indicator
-Ppsignal EWO BB, ( )
Other Chart indicators:
- Awesome Oscillator. ( )
- Optionally Add Squeeze Indicator ( )
- Bollinguer band period 13 desviation 1.
BUY SIGNAL
-Ewo above 0
-CFB crosses the middle donichian channel.
-CFB crosses ariiba from the upper band of bollinguer band.
SELL SIGNAL
- Ewo below 0
- CFB crosses below the middle channel
- CFB crosses below the signal bb.
Wath is CFB?
PPSignal BB-EWO BB $ CFB Strategy ScalpThis indicator is an implementation of the Bollinger Band, CFB and EWO Oscillator Scalping system.
This technique is for those who want the most simple method that is very effective. It is BEST traded during the busiest trading hours, 3am to 12am EST NY time. This method doesn't work in sideways markets, only in volatile trending markets.
-Time Frames: 1, 5, 10, 15 ,30 min.
-Currency pairs: majors, btc , futures and volatile stock.
Other Chart indicators:
Add EWO bb.
Optionally Add Squeeze Indicato or bbsqueeze .
Here's the strategy:
// Going LONG:
Enter a long position when CFB has crossed up through the Bollinger upper band (lime) . At the same time, the EWO BB or BBqueeze should be approaching or crossing it's zeroline, going up. This is indicated by "Buy" alert.
// Going SHORT:
Enter a short position when CFB has crossed down through the low Bollinger red. At the same time, the EWO BB or BBqueeze should be approaching or crossing it's zero line, going down. This is indicated by the "Sell" Alert.
// Take profit:
// 10-20 pips depending on pair or When Awesome Oscillator turns a different color.
// HINTS: Best trades tend to occur when price reversing bounce off outer band and and outside Optional Bollinger Squeeze indication.
PpSignal Donchian Channels Gann HILO SmootheStrategy based on the growth of cfb and the middle donichian channel softened and ewo cross 0 signal.
- when cfb crosses up the middle donichian channel and ewo is up to 0 is buy
- when cfb crosses down the donichian middle channel and the ewo is below 0 , sell.
Attention: This strategy is recommended to be used in periods of volatility, see (). You can use btc, forex, futures, and penny stock.