Momentum Explosion 2CCI RSI"Momentum Explosion Template for Mobile Metatrader", that is a trading system trend momentum based on two Commodity Channel Index (CCI) , RSI and two Moving Averages.The trading signals are generated by the crossing of the moving averages confirmed by the agreement of the two CCIs and the RSI.
Two Moving averages Filtered by double CCI and RSI
Credit is to Dimitri Author Beejay (Forex Factory)
Trading Rules Momentum Explosion
Buy
EMA 8 crosses upward SMA 26.
CCI 34 periods > 0
CCI 55 periods > 0
RSI 26 > 48.
Sell
EMA 8 crosses downward SMA 26.
CCI 34 periods < 0
CCI 55 periods < 0
RSI 26 < 48.
Forex

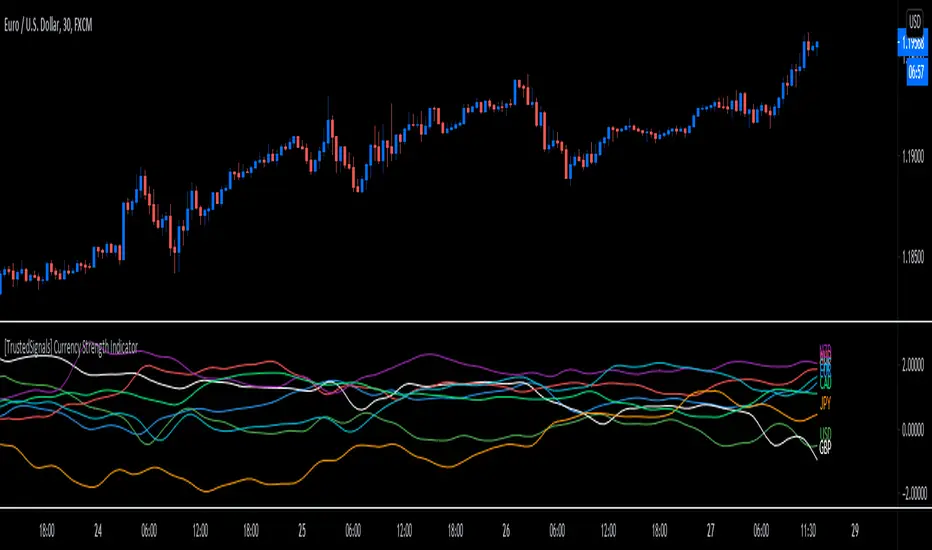
[TrustedSignals] Currency Strength IndicatorOur own branded currency strength meter gives you a quick visual guide to which currencies are currently strong, and which ones are weak.
The meter measures the strength of all forex cross pairs and applies calculations on them to determine the overall strength for each individual currency.
It is useful as a quick guide to which currencies you might want to trade, and which might be worth staying away from. For instance, if a certain currency is very strong, and another suddenly turns weaker, you may find a trading opportunity
The indicator has an extra option the user can activate, to show only the 2 indexes correlated to the displayed pair on the chart. For example, if the EURUSD pair is displayed on the chart, the indicator will only show the EUR index and the USD index.
It is recommended to use a lookback length of over 90 for Timeframes higher than 60min, and under 60 for lower intraday timeframes
Use the link below to obtain access to this indicator
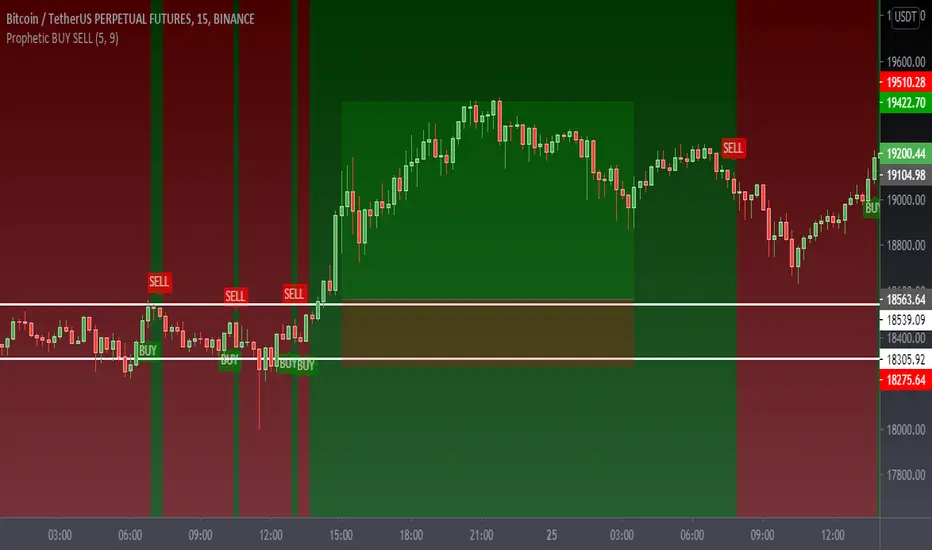
Prophetic BUY SELL IndicatorThis premium indicator will help you to do quick scalping on Cryptocurrencies, Forex, and Stocks.
This indicator is very simple to understand.
Green BUY Alert - Buy Signal Market is up
Red SELL Alert - Sell Signal Market is down
Caution:- Do not use it during market being choppy or sideways
Once the BUY signal appears the background changes green and same with SELL it turns red
can change the color according to requirements
It also has a moving average which also changes the color as the candles close above the MA or the below Default color are green and red
Please Like Share and Follow and if required please contact:- @mobudd (TELEGRAM)
or Ping me on trading view
Guys, It takes effort so please do not ask for free access.
You're always welcome to share any type of suggestion & feedback.
Joseph Nemeth Heiken Ashi Renko MTF StrategyFor Educational Purposes. Results can differ on different markets and can fail at any time. Profit is not guaranteed. This only works in a few markets and in certain situations. Changing the settings can give better or worse results for other markets.
Nemeth is a forex trader that came up with a multi-time frame heiken ashi based strategy that he showed to an older audience crowd on a speaking event video. He seems to boast about his strategy having high success results and makes an astonishing claim that looking at heiken ashi bars instead of regular candlestick bar charts can show the direction of the trend better and simpler than many other slower non-price based indicators. He says pretty much every indicator is about the same and the most important indicator is price itself. He is pessimistic about the markets and seems to think it is rigged and there is a sort of cabal that created rules to favor themselves, such as the inability of traders to hedge in one broker account, and that to win you have to take advantage of the statistics involved in the game. He believes fundamentals, chart patterns such as cup and handle and head and shoulders, and fibonacci numbers don't matter, only price matters. The foundation of his trading strategy is based around heiken ashi bars because they show a statistical pattern that can supposedly be taken advantage of by them repeating around seventy or so percent of the time, and then combines this idea with others based on the lower time frames involved.
The first step he uses is to identify the trend direction in the higher time frame(daily or 4 hourly) using the color of the heiken ashi bar itself. If it is green then take only long position after the bar completes, if it is red then take only short position. Next, on a lower time frame(1 hour or 30 minutes) look for the slope of the 20 exponential moving average to be sloping upward if going long or the slope of the ema to be sloping downward if going short(the price being above the moving average can work too if it's too hard to visualize the slope). Then look for the last heiken ashi bar, similarly to the first step, if it is green take long position, if it is red take short position. Finally the entry indicator itself will decide the entry on the lowest time frame. Nemeth recommends using MACD or CCI or possibly combine the two indicators on a 5 min or 15 min or so time frame if one does not have access to renko or range bars. If renko bars are available, then he recommends a 5 or 10 tick bar for the size(although I'm not sure if it's really possible to remove the time frame from renko bars or if 5 or 10 ticks is universal enough for everything). The idea is that renko bars paint a bar when there is price movement and it's important to have movement in the market, plus it's a simple indicator to use visually. The exit strategy is when the renko or the lowest time frame indicator used gives off an exit signal or if the above conditions of the higher time frames are not being met(he was a bit vague on this). Enter trades with only one-fifth of your capital because the other fifths will be used in case the trades go against you by applying a hedging technique he calls "zero zone recovery". He is somewhat vague about the full workings(perhaps because he uses his own software to automate his strategy) but the idea is that the second fifth will be used to hedge a trade that isn't going well after following the above, and the other fifths will be used to enter on another entry condition or if the other hedges fail also. Supposedly this helps the trader always come out with a profit in a sort of bushido-like trading tactic of never accepting defeat. Some critics argue that this is simply a ploy by software automation to boost their trade wins or to sell their product. The other argument against this strategy is that trading while the heiken ashi bar has not completed yet can jack up the backtest results, but when it comes to trading in real time, the strategy can end up repainting, so who knows if Nemeth isn't involving repainting or not, however he does mention the trades are upon completion of the bar(it came from an audience member's question). Lastly, the 3 time frames in ascending or descending fashion seem to be spaced out by about factors of 4 if you want to trade other time frames other than 5/15min,30min/1hour, or 4hour/daily(he mentioned the higher time frame should be atleast a dozen times higher than the lower time frame).
Personally I have not had luck getting the seventy+ percent accuracy that he talks about, whether in forex or other things. I made the default on renko bars to an ATR size 1 setting because it looks like the most universal option if the traditional mode box size is too hard to guess, and I made it so that you can switch between ATR and Traditional mode just in case. I don't think the strategy repaints because I think TV set a default on the multi-time frame aspects of their code to not re-paint, but I could be wrong so you might want to watch out for that. The zero zone recovery technique is included in the code but I commented it out and/or remove it because TV does not let you apply hedging properly, as far as I know. If you do use a proper hedging strategy with this, you'll find a very interesting bushido type of trading style involved with the Japanese bars that can boost profits and win rates of around possibly atleast seventy percent on every trade but unfortunately I was not able to test this part out properly because of the limitation on hedging here, and who knows if the hedging part isn't just a plot to sell his product. If his strategy does involve the repainting feature of the heiken ashi bars then it's possible he might have been preaching fools-gold but it's hard to say because he did mention it is upon completion of the bars. If you find out if this strategy works or doesn't work or find out a good setting that I somehow didn't catch, please feel free to let me know, will gladly appreciate it. We are all here to make some money!

Trendy Bar Trend Color LiteLite version of the original Trendy Bar Trend Color
This will only color the candlestick body of your chart
Can be used with solid, hollow, renko, or any other chart type
Custom coloring for Highs, Lows, and consolidation is removed

Swing/Daytrading strategy with reversal option
Hello, today I bring a swing reversal strategy that work on all financial markets.
It uses timeframes starting from 1h, the bigger the better.
Its very dangerous because it has no stop loss, neither a take profit. Our exit condition is based on the reversal on the entry .
For entry we have 2 types : normal and reversal
Lets say we want to go long , for that we check the last CLOSE of a candle with the previos HIGH. If its higher than that, and at the same time CLOSE is bigger than the moving average, we have a long entry.
For short we have CLOSE with the previous LOW. If its lower than that and at the same time is lower than moving average, we have a short entry.
For moving average we use T3 MA
For reversal what I do, is , I take the short condition and I apply it to long, and for long I apply the short condition.
On many cases I found out it work amazingly.
I forgot to add: it also has a time entry system, so we use the best hours/sessions for entries .
Exit a trade: lets say we enter short, when we find a long condition, we close short and enter into long. Viceversa for long.
If you have any questions, let me know.
Enjoy it :)

Profitable Strategy Forex 80 by LukasHello all,
Herewith I publish my Forex strategy, it's works for major pairs only.
I ran more than a thousand test to get this result! :))
The strategy have more than 8 Buy and Sell signal condition with 2 core signal provider.
You can turn on/off each 7 signal and find the most profitable combination for each pairs.
If you trade on lower timeframe, you can turn on "Higher Timeframe MA".
It's also will trigger buy/sell when breakout from monthly high / low when entry condition meets.
You can set weekly or monthly.
I work on 4H timeframe when develop the script, so best use is 4H.
Basically i want to make reliable strategy that can automate trade
without the need to check chart every minutes! Hahha
So i think higher time frame is the best time to start,
and I found 4H chart on Forex have more clear structure and volatility .
I make the signal visible, it consist of 3 line represent The Pairs, Base and Counter pairs,
basically when Green line on top it means Base currency is strong, vice versa.
You may share your setting in the comment section, so others can try it :)
For this result I turn on Signal A,C,D,E,F
Signal A and B use special RSI
Signal C and D use special MACD
Signal E use RSI
Signal F use EMA and DEMA combination
In my opinion each pairs has unique character, some of them move faster than others.
So, adjust the setting for each pairs will benefit you more.
For further develop of this strategy, please give me feedback! :)

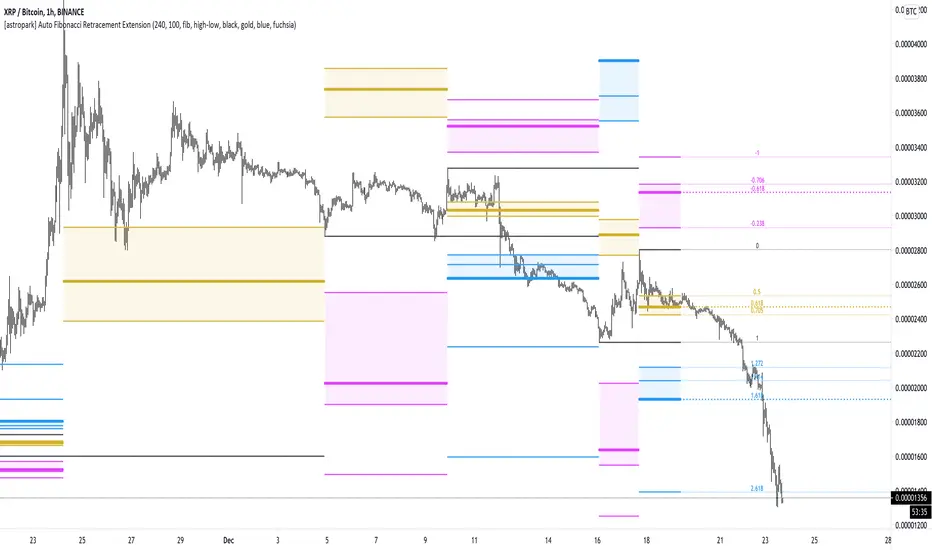
[astropark] Auto Fibonacci Retracement ExtensionDear followers,
today a new analysis tool for day trading, scalping and swing trading: Automatic Fibonacci Retracements and Extensions drawer!
It works on every timeframe and market, as it simply draws automatically most important fibonacci levels on the chart.
Based on the analysis window set (default 100 bars, but you can edit it as you like), it finds recent high and low and start drawing the following levels:
recent high and low (black)
golden retracement range: 0.5 * 0.618 * 0.705 fibonacci retracements (gold)
fibonacci extensions range above 1: 1.272 * 1.424 * 1.618 * 2.618 * 4.236 (blue)
fibonacci extensions range below 0: -0.238 * -0.618 * -0.706 * -1(fuchsia)
Whenever the indicator finds a new high or a new low, al fibonacci levels are re-draw automatically.
The indicator will let you:
change analysis window
enable displaying labels related to current fibonacci levels and/or prices
change colors
show/hide each specific level
How to use the indicator?
Basically, all techniques which apply to fibonacci tool are valid here too.
After a big move up or down, a new high or low is created and a retracement is expected: if trend is strong, retracement to golden ration 0.618 will be a perfect spot for buy or sell respectively in order to continue riding the trend.
In general a bounce is always expected when price hit 0.618 retracement , good to know for scalping traders, while swing trades will continue holding the trade for higher profits.
If the golden retracement range (0.5 - 0.705) is broken and then retested from the other side, a continuation move is expected towards previous high/low (fib level 1) and even more towards the fibonacci extensions range above 1 (1.618 - 2.618 - 4.236).
If the base of bounce and trend continuation on golden retracement range, traders can expect
price to hit again previous high/low and
if trend is strong, a consolidation near the previous high/low range (conditions that are respectively bullish and bearish)
do a further continuation towards -0.618 fib level range
Traders must always understand that
the higher the timeframe, the stronger is the meaning and so the reaction when a specific fibonacci level is hit
don't trade blindly, try to find confluences to have an higher chance to be in a winning trade in near future
money and risk management are very important, so manage your position size and always have a stop loss in your trades
As said, this indicators work on every timeframe and in all markets (Crypto currencies, stocks, FOREX, indexes, commodities). Here some examples:
BTCUSDT 1D: after a long run, a retracement is expected and a bounce at 0.618 golden level is more than obvious: perfect short (sell) entry
BTCUSDT 1D: again as previous example, after a long run, a retracement is expected as well as price's bounces back above
EURUSD 1h: lots of info here, directly in the chart below:
bounces on 0.618 golden zone
double top
price breaks 0.618 level and retests it from below targeting previous low
double bottom and bounce back towards golden zone
bearish consolidation at recent low and further decline towards 1.618 fib extension
AMZN 1h stock: lots of info here too, directly in the chart below:
new high is print, price retrace to golden zone
bounces on 0.618 golden zone
price breaks 0.618 level and retests it from below targeting previous low
double bottom and bounce back towards golden zone
rejection at golden zone, price falling targeting previous low again and probably 1.618 fib extension
price breaks hard previous low and hits fib extension range below recent low
price retraces back up towards new golden retracement range
golden retracement range is broken and used as support: targets are previous high and 1.618 extension
once 1.618 extension level is broken and retested successfully as support, price moves towards 2.618 fibonacci extension level
SPY (SPX500) index: lots of info in the chart
interesting to note that March 2020 huge dump can be totally mapped as a series of fibonacci level bounces, so you understand the importance of riding a trend now, right?
after the low was formed, price retraced perfectly to golden ration 0.618
each time price hit a golden level/range, it retraces creating double top and double bottom configurations too
In the chart below we can see the power of the double bottom at golden retracement level: targets are previous high and -0.618 fibonacci extension level
XAUUSD 15m: as we are in a lower timeframe, the default analysis windows has been reduced to 50.
What can we see here:
golden retracement and price is rejected towards previous low
golden retracement hit and price bounces back lower
new high is formed: golden retracement hit and price bounces back higher
price break previous high and hits fibonacci extensions -0.618 and -1
price continues rising forming a regular bearish divergence with RSI
once uptrend is broken, price falls dramatically
first target is 0.618 retracement level, where you see a very small retracement due to strength of sellers
second target is previous low, which is broken and retested many time from below (bearish retest)
third target is fibonacci extension range (in this case 1.414 is almost hit)
as an hidden bullish divergence with RSI was created, price goes back up
This is a premium indicator , so send me a private message in order to get access to this script.
MACD with 3 strategiesMACD WITH 3 STRATEGIES
- Macd line change colour when cross the signal line
- Background Color change colour based on a moving average, on settings the value of the moving average can be changed 50,100,150,200
- Strategy one based on Macd lines with bar changing colours
- Strategy two based on Macd lines but with a different method
- Strategy three based on two other trending indicators
This indicator can be used to spot trends and changing of direction of the market and with the bar coloured its easier to identify them.
The strategy one can be used as confirmation of a trend or as changing direction integrated with other indicators like Rsi , Stochastic, Supertrend , Bollinger band, with ema option mode works better.
The strategy two can be use together with the back ground colour: When is red and the candles are red can be identified as strong drown trend.
When is green and the candles are green can be identified as strong up trend.
The strategy three can be used after checked the strategy two for more confirmation for a trend.
VERY IMPORTANT WHEN YOU TRY A NEW STRATEGY TEST IT IN A DEMO ACCOUNT FOR AT LEAST 3 MONTHS
Every donations will be devolved to cancer research and you ll have one month free trial.
If you want to purchase this indicator 30% will be devolved to cancer research.
Please leave a comment or message me if you want you have two weeks trial.
Enjoy!
Multi Time Frame Buy&Sell V4.0 [BACKTEST]Hi guys,this indicator Developed for Intraday and multi Time Frame Trading. Note: Invite only Script.Request to me Access permission to test this.
*** THIS IS STUDY VERSION ***
Time Frame : can use for 15 min / 30 min / 1h / 4h time
15 min configuration is best result for bitcoin and ethereum .
This can be used : Crypto Currency/ Bitcoins / ethereum ,Forex,currencies ,Index ,Commodity Gold / silver , Oil Market and in Equity / Futures
ETHUSDT Futures 15min
BTCUSDT Futures 15min:
GOLD /USD FOREX 15min:
HOW IT WORKS:
this indicator analyze EMA&SMA support and resistance then combine with pivot point and fibo levels is used to calculate the signals.and finally show entry label on
chart with target point and stop loss
HOW TO USE:
Creating a signal is as simple as adding the indicator called to your chart(buy or sell)label and background color change ( green=buy / red = sell)
green line is target and black line is stop loss.
in top of setting page you can see noise filter option . that can change it to get better result and reduce noise. in setting can set 3 target level and stoploss
NOT:all information show to info panel in chart.
strategy tester : enabled .All you can test this in live market in any segment.
NOT: can to change noise filter in setting setup until to get best result.
Choose any Date Month Year to Current Date and check the results below in the Strategy Tester.
REPAINT/NO REPAINT : No Repaint ,entery labal(buy or sell) and Background Color wont change. In the current candle position wait for the candle to close to see the
stability.
"Set alert": Select "Once per bar close" for your alert options.
There are 5 alerts:
- BUY
- SELL
- BUY OR SELL (for free TV users)
- take profit
- stop loss
Review and Feedback.Thank you!
Any issues report to me to Fix.Thank you!
how To Get access : Use the link below to obtain access to this indicator or PM us to obtain access.

Doji swing strategyThis is a simple strategy based on Doji star candlestick
This strategy is suited for big time frames, like 4h -1Day and so on.
It places two orders: long at doji star high or previous candle high and short at doji star low or previous candle low.
It can also be applied volume average, in order to filter between trades .
This strategy works very well with high time frames like Weekly TF because it eliminates the noise in doji formation.
It also has inside a risk management made of SL/TP , or if not prefered it can exit based on a exit condition.
If you have any questions, please let me know !
Multi Time Frame Buy&Sell V4.0 [ALERTSETUP]Hi guys,this indicator Developed for Intraday and multi Time Frame Trading. Note: Invite only Script.Request to me Access permission to test this.
*** THIS IS STUDY VERSION ***
Time Frame : can use for 15 min / 30 min / 1h / 4h time
15 min configuration is best result for bitcoin and ethereum .
This can be used : Crypto Currency/ Bitcoins / ethereum ,Forex,currencies ,Index ,Commodity Gold / silver , Oil Market and in Equity / Futures
ETHUSDT Futures 15min
BTCUSDT Futures 15min:
GOLD /USD FOREX 15min:
HOW IT WORKS:
this indicator analyze EMA&SMA support and resistance then combine with pivot point and fibo levels is used to calculate the signals.and finally show entry label on
chart with target point and stop loss
HOW TO USE:
Creating a signal is as simple as adding the indicator called to your chart(buy or sell)label and background color change ( green=buy / red = sell)
green line is target and black line is stop loss.
in top of setting page you can see noise filter option . that can change it to get better result and reduce noise. in setting can set 3 target level and stoploss
NOT:all information show to info panel in chart.
strategy tester : enabled .All you can test this in live market in any segment.
NOT: can to change noise filter in setting setup until to get best result.
Choose any Date Month Year to Current Date and check the results below in the Strategy Tester.
REPAINT/NO REPAINT : No Repaint ,entery labal(buy or sell) and Background Color wont change. In the current candle position wait for the candle to close to see the
stability.
"Set alert": Select "Once per bar close" for your alert options.
There are 5 alerts:
- BUY
- SELL
- BUY OR SELL (for free TV users)
- take profit
- stop loss
To Get access - Send me a private chat message in tradingview.com to get access.Or request in comment section below.
Review and Feedback.Thank you!
Any issues report to me to Fix.Thank you!
Use the link below to obtain access to this indicator:

[astropark] DMI/ADX strategy [alarms]Dear Followers,
today I'm happy to share with you my DMI / ADX Strategy .
It provides directional trend information, so if a bullish or a bearish trend is going to start. Statistically it works better on lower timeframes (from 5 minutes to 1 hour).
It is both a Swing and Scalping Strategy indicator , based on a simple trend following theory , good for trading FOREX, Indexes, Stocks, Commodities and Cryptocurrencies.
To help in Taking Profits, the strategy integrates 2 special other than bull/bear signals:
Overbought and Oversold RSI Signals , which appear both as darker background (the darker the color, the more the price is in overbought/oversold) and green "ob"-"tp" / red "os"-"tp" labels (they optionally pop up only on a configurable stronger overbought/oversold condition) (you can enable/disable it optionally)
Peak Profit Tracker , which resets every time a new trade starts and keeps track of price fluctuation during the trade: the message is don't be too greedy and take profits or lock them with a stoploss in profit (you can enable/disable it optionally)
You can edit many options in order to
have more/less bull/bear signals
enable/disable showing bull/bear signals
enable/disable showing RSI TP signals (you can edit RSI length, overbought (OB) and oversold (OS) levels)
enable/disable showing peak profits on each trade
The user who wants to use this strategy, especially via an automated bot, must always set a stoploss (example 150$ from entry on bitcoin ) or use a proper risk management strategy .
This is not the "Holy Grail", so use it with caution. It's highly suggested to use a proper money management .
This script will let you set all notifications you may need in order to be alerted on each triggered signals.
You can find the strategy version for backtesting here below:
Here there are some examples how this DMI / ADX strategy works on many markets:
LTC/USDT 15m
BTC/USD 15m
BNB/BTC 15m
ETH/USD 15m
GOLD (XAU/USD) 15m
GOLD (XAU/USD) 1h
FB 15m
AAPL 15m
TSLA 1h
BANKNIFTY Index 5m
NIFTY 50 Index 5m
This is a premium indicator , so send me a private message in order to get access to this script .

Ichimoku with MACD/ CMF/ TSI This is a strategy made from ichimoku cloud , together with MACD, Chaiking Money FLOW and True Strenght Index.
It can be adapted to any timeframe and any type of financial markets.
The idea behind its very simple,
We combine the long / short strategy from ichimoku, like cross between lines and below/above cloud together with histogram from MACD for positive/negative level. We use the same criteria for TSI and CMF, to check if its above or below 0 level.
Based on that we have a long or a short entry. The exit happens when the next options triggers, like for example we had long signal, we exit when we receive the short signal and viceversa.
It can be adapted with a risk management to apply a tp/sl level.
For any suggestion or details , let me know.

Triple EMA Scalper low lag stratHi all,
This strategy is based on the Amazing scalper for majors with risk management by SoftKill21
The change is in lines 11-20 where the sma's are replaced with Triple ema's to
lower the lag.
The original author is SoftKill21. His explanation is repeated below:
Best suited for 1M time frame and majors currency pairs.
Note that I tried it at 3M time frame.
Its made of :
Ema ( exponential moving average ) , long period 25
Ema ( exponential moving average ) Predictive, long period 50,
Ema ( exponential moving average ) Predictive, long period 100
Risk management , risking % of equity per trade using stop loss and take profits levels.
Long Entry:
When the Ema 25 cross up through the 50 Ema and 100 EMA . and we are in london or new york session( very important the session, imagine if we have only american or european currencies, its best to test it)
Short Entry:
When the Ema 25 cross down through the 50 Ema and 100 EMA , and we are in london or new york session( very important the session, imagine if we have only american or european currencies, its best to test it)
Exit:
TargetPrice: 5-10 pips
Stop loss: 9-12 pips

Crazy Signals - Early Detection of a Short Term TrendThis is a simple yet powerful tool that helps you detect Trends for the short term.
Time Frames:
- Avoid using very small time frames as there will be too many signals in a short period
- Intraday: 15 mins, 30 mins, 60 mins seem to detect trends well
- Overnight Trades: 60 mins
- Positional: 1D is recommended
- For Investment, one can week a weekly timeframe
Rules of Engagement:
1. The Upward Arrow (Green) indicates possible upside. While the Downward Arrow (Orange) indicates a possible downside
2. Not every Signal has to be traded. Rules to check before taking a trade:
a. The candle on which the Signal is generated, should be either small or medium size compared to other candles on the chart. If the candle is large, ignore it
b. In case of a Buy Signal, entry should be made once the Price crosses above the High made on the Signal Candle
c. In case of a Sell Signal, entry should be made once the Price crosses below the Low made on the Signal Candle
d. For extra caution, in steps b & c, one can wait for the current candle to close higher than the High of Signal Candle for Buy Signal and close lower than the Low of Signal Candle (this is for extra safe traders)
This tool is to be used for trades that usually last for a few candles.
Please do your own research before trading.

Ultimate VWAP Bands- Ultimate VWAP Bands is a script that helps to decide and further clarify areas of oversold and overbought conditions.
- For example, when the price is in the lowest band it is extremely oversold relative to the VWAP . Hence it should be considered a good place to buy with a high risk to reward payoff.
- Each band is set at a fixed offset away from the VWAP . The "VWAP Band Multiplier" adjusts this and is a key part of the script. This allows the indicator to be adjusted based on the assets volatility . For example, with Crypto. A multiplier of 1 would be strongly advised. Whilst a multiplier of 0.1-0.25 would be useful for currency pairs.
- This indicator can be used for all manners of trading. However, it is most effective when used for scalping and swing trading.

[astropark] Nova BandsDear followers,
today a new analysis and scalping tool for day trading on low timeframes (5-15 minutes) or to plan swing trades on hourly timeframes. It can be used also on high timeframes just for analysis current market trend.
The indicator plots a series of levels which create a nice bands flow.
The slope of levels make you easily understand when price is in consolidation, in uptrend or in downtrend.
The golden rule is always the same: buy low and sell high .
This indicator plots:
3 "price is low here" levels (from dark green to light green)
3 "price is average here" levels
3 "price is high here" levels (from purple to orange)
When bands are flat, price is in consolidation and this is best condition to trade with nova bands.
When price reaches higher bands, you will open a short position with targets below levels, fully closing your position when price hits the average level (black).
Here an example on Bitcoin on 15m using 1h resolution:
The same applies when price reaches lower bands, you will open a long position with targets above levels, fully closing your position when price hits the average level (black).
When bands get nearer and nearer is called "Bands Squeeze": price is next to a main breakout move, volatility is coming!
Here an example of SPX500: after long consolidation and bands getting nearer and neared, we had the breakout, downwards in this case.
In this screenshot you can see what signals algorithm provided:
Our suggestion is to play safe these kind of scenarios, no reason to FOMO buy/sell. Just wait for price consolidation / getting back inside the bands.
For example you would have skip first three buy signals, while you would have longed the last two as price came back inside bands after the big volatility which made price went below bands.
Another example is TSLA stock on 15m with 1h resolution:
Price touched the first bullish level and made a big move upwards, breaking bands with a +90% move.
In this case, you would have skipper first 2 sell signals, while you would have accepted next two with stoploss above recent high.
Acceptable also the other two sell signals, which you may have closed when price retraced to lower levels:
You can of course run trends like this buying on price hitting bullish/lower levels after a long consolidation and sell on price hitting middle and higher levels:
A trader who wants to be a winner must understand that money and risk management are very important, so manage your position size and always have a stop loss in your trades.
Here some examples how the indicator works on different markets:
EURUSD 15m with standard settings and 1h resolution
GOLD (XAUUSD) 15m with standard settings and 1h resolution
Facebook (FB) 15m with standard settings and 1h resolution
This is a premium indicator , so send me a private message in order to get access to this script.
[astropark] trade yesterday rangeDear followers,
today a nice scalping tool for day trading on low time frames (1-3-5 minutes)!
Each day the indicator will print some important levels and ranges related to the trading day before:
yesterday high (black line)
yesterday day range averange (silver line)
yesterday low (black line)
average between yesterday high and yesterday average, together with a resistance range (red)
average between yesterday low and yesterday average, together with a support range (green)
two extension ranges above yesterday high (first is blue, second is red)
two extension ranges below yesterday low (first is blue, second is green)
Trading levels is one of most effective trading tecniques:
once a level is broken upwards, you can long (buy) the bullish retest with stoploss below recent low
once a level is broken downwards, you can short (sell) the bearish retest with stoploss below recent high
consolidation below or at a resistance level is bullish, so long (buy) breakout upwards and long more on a bullish retest of broken level
consolidation above or at a support level is bearish, so short (sell) breakout downwards and short more on a bearish retest of broken level
many times you see a level to be tested 2 or 3 times: short (sell) double and triple top, long (buy) double or triple bottom
Here you can see the levels described above and basic usage in a consolidation trading day:
A trader who wants to be a winner must understand that money and risk management are very important, so manage your position size and always have a stop loss in your trades.
Here you can see many examples on how to use this indicator.
Triple top on yesterday range high: perfect short setup (5 take profits targets in the example)
Resistance levels broken: long setup on bullish retest (2 take profits targets in the example)
Double top and support broken: 2 short setups (2 and 3 take profits targets in the example)
Here some examples how to basically use the indicator in a consolidation trading day: short (sell) resistance levels, long (buy) support levels
This is a premium indicator , so send me a private message in order to get access to this script.
Dynamic Dots Dashboard (a Cloud/ZLEMA Composite)The purpose of this indicator is to provide an easy-to-read binary dashboard of where the current price is relative to key dynamic supports and resistances. The concept is simple, if a dynamic s/r is currently acting as a resistance, the indicator plots a dot above the histogram in the red box. If a dynamic s/r is acting as support, a dot is plotted in the green box below.
There are some additional features, but the dot graphs are king.
_______________________________________________________________________________________________________________
KEY:
_______________________________________________________________________________________________________________
Currently the dynamic s/r's being used in the dot plots are:
Ichimoku Cloud:
Tenkan (blue)
Kijun (pink)
Senkou A (red)
Senkou B (green)
ZLEMA (Zero Lag Exponential Moving Average)
99 ZLEMA (lavender)
200 ZLEMA (salmon)
You'll see a dashed line through the middle of the resistances section (red) and supports section (green). Cloud indicators are plotted above the dashed line, and ZLEMA's are below.
_______________________________________________________________________________________________________________
How it Works - Visual
_______________________________________________________________________________________________________________
As stated in the intro - if a dynamic s/r is currently above the current price and acting as a resistance, the indicator plots a dot above the histogram in the red box. If a dynamic s/r is acting as support, a dot is plotted in the green box below. Additionally, there is an optional histogram (default is on) that will further visualize this relationship. The histogram is a simple summation of the resistances above and the supports below.
Here's a visual to assist with what that means. This chart includes all of those dynamic s/r's in the dynamic dot dashboard (the on-chart parts are individually added, not part of this tool).
You can see that as a dynamic support is lost, the corresponding dot is moved from the supports section at the bottom (green), to the resistances section at the top (red). The opposite being true as resistances are being overtaken (broken resistances are moved to the support section (red)). You can see that the raw chart is just... a mess. Which kinda of accentuates one of the key goals of this indicator: to get all that dynamic support info without a mess of a chart like that.
_______________________________________________________________________________________________________________
How To Use It
_______________________________________________________________________________________________________________
There are a lot of ways to use this information, but the most notable of which is to detect shifts in the market cycle.
For this example, take a look at the dynamic s/r dots in the resistances category (red background). You can see clearly that there are distinctive blocks of high density dots that have clear beginnings and ends. When we transition from a high density of dots to none in resistances, that means we are flipping them as support and entering a bull cycle. On the other hand, when we go from low density of dots as resistances to high density, we're pivoting to a bear cycle. Easy as that, you can quickly detect when market cycles are beginning or ending.
Alternatively, you can add your preferred linear SR's, fibs, etc. to the chart and quickly glance at the dashboard to gauge how dynamic SR's may be contributing to the risk of your trade.
_______________________________________________________________________________________________________________
Who It's For
_______________________________________________________________________________________________________________
New traders: by looking at dot density alone, you can use Dot Dynamics to spot transitionary phases in market cycles.
Experienced traders: keep your charts clean and the information easy to digest.
Developers: I created this originally as a starting point for more complex algos I'm working on. One algo is reading this dot dashboard and taking a position size relative to the s/r's above and below. Another cloud algo is using the results as inputs to spot good setups.
Colored Bars
There is an option (off by default, shown in the headline image above) to fill the bar colors based on how many dynamic s/r's are above or below the current price. This can make things easier for some users, confusing for others. I defaulted them to off as I don't want colors to confuse the primary value proposition of the indicators, which is the dot heat map. You can turn on colored bars in the settings.
One thing to note with the colored bars: they plot the color purely by the dot densities. Random spikes in the gradient colors (i.e. red to lime or green) can be a useful thing to notice, as they commonly occur at places where the price is bouncing between dynamic s/r's and can indicate a paradigm shift in the market cycle.
_______________________________________________________________________________________________________________
Timeframes and Assets
_______________________________________________________________________________________________________________
This can be used effectively on all assets (stocks, crypto, forex, etc) and all time frames. As always with any indicator, the higher TF's are generally respected more than lower TF's.
Thanks for checking it out! I've been trading crypto for years and am just now beginning to publish my ideas, secret-sauce scripts and handy tools (like this one). If you enjoyed this indicator and would like to see more, a like and a follow is greatly appreciated 😁.

London Open Range Breakout by KviateqThis script is what I currently use to day trade forex on a 5-minute timeframe.
The script features Multi-timeframe EMA20 that uses timeframe multipliers and is smoother by the factor by which you're multiplying your current timeframe.
Default settings are set to display EMA20 on the current (M5) timeframe, as well as M15, H1, H4 and D1 timeframes.
The background color changes intensity based on how many conditions are met - are all EMAs in the right order, is the current close above/below all the EMAs.
Featured is also a range set to 1 hour since the London breakout (can be changed to M15, or however long you'd like - my current setting is 30 minute).
Also featured are levels that I find to be of most importance - such as Daily and Weekly Open, Previous Day's and Week's Highs.
The idea is to only take trades when all stars align - EMAs, break above/below the Opening Range and not to long/short into an important level.

Fx Auto Supply and Demand [For Day Trading Only]Fx Auto Supply and Demand automatically plots important supply and demand levels for Forex day trading.

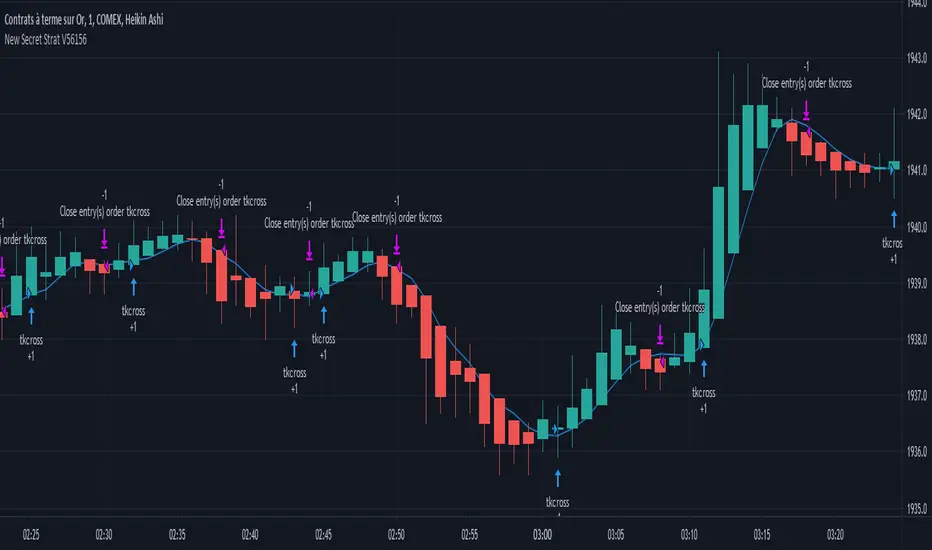
New Secret Strat V56156After years of resserch and development, I finally finished created the best strategy ever made.
It works on every security you can think of: futures, forex, bitcoin, and so on.
It will adapt the pattern of every chart to make the most money possible.
This is the masterpieace I was hopping to produce one day, and now it is.
Right before you.
Enjoy the best strategy that has ever been created.
Good luck !