VIX Implied MovesKey Features:
Three Timeframe Bands:
Daily: Blue bands showing ±1σ expected move
Weekly: Green bands showing ±1σ expected move
30-Day: Red bands showing ±1σ expected move
Calculation Methodology:
Uses VIX's annualized volatility converted to specific timeframes using square root of time rule
Trading day convention (252 days/year)
Band width = Price × (VIX/100) ÷ √(number of periods)
Visual Features:
Colored semi-transparent backgrounds between bands
Progressive line thickness (thinner for shorter timeframes)
Real-time updates as VIX and ES prices change
Example Calculation (VIX=20, ES=5000):
Daily move = 5000 × (20/100)/√252 ≈ ±63 points
Weekly move = 5000 × (20/100)/√50 ≈ ±141 points
Monthly move = 5000 × (20/100)/√21 ≈ ±218 points
This indicator helps visualize expected price ranges based on current volatility conditions, with wider bands indicating higher market uncertainty. The probabilistic ranges represent 68% confidence levels (1 standard deviation) derived from options pricing.
Implied

Implied Fair Value Gap (IFVG) ICT [TradingFinder] Hidden FVG OTE🔵 Introduction
The Implied Fair Value Gap (IFVG) is distinctive due to its unique three-candlestick formation, which differentiates it from conventional Fair Value Gaps.
Implied fair value represents an estimated worth of an asset—often a business or its goodwill—based on the price likely to be received in a structured transaction between market participants at a specific point in time.
In the ever-evolving world of technical analysis, pinpointing price reversal points and market anomalies can significantly enhance trading strategies and decision-making for traders and investors. Among the advanced concepts gaining traction in this field is the Implied Fair Value Gap (IFVG), introduced by the renowned analyst Inner Circle Trader (ICT).
This tool has proven to be an effective method for identifying hidden supply and demand zones in financial markets, offering a unique edge to traders looking for high-probability setups.
Unlike traditional gaps that are visible on price charts, IFVG is a hidden gap that doesn’t appear explicitly on the chart and thus requires specialized technical analysis tools for accurate identification.
This hidden gap can signal potential price reversals and offers traders insight into high-liquidity areas where price is likely to react. This article will guide you through using the ICT Implied Fair Value Gap Indicator effectively, covering its settings, usage strategies, and key features to help you make informed decisions in the market.
🟣 Bullish Implied FVG
🟣 Bearish Implied FVG
🔵 How to Use
The IFVG indicator is designed to assist traders in recognizing hidden support and resistance zones by identifying Bullish and Bearish IFVG patterns. With this tool, traders can make better-informed decisions about suitable entry and exit points for their trades based on these patterns.
🟣 Bullish Implied Fair Value Gap
This pattern occurs in an uptrend when a large bullish candlestick forms, with the wicks of the previous and following candles overlapping the body of the central candlestick.
This overlap creates a demand zone or a hidden support level, which can act as an ideal entry point for buy trades. Often, when the price returns to this area, it is likely to resume its upward trend, presenting a profitable buying opportunity.
🟣 Bearish Implied Fair Value Gap
This pattern is similar but forms in downtrends. Here, a large bearish candlestick appears on the chart, with the wicks of adjacent candles overlapping its body. This overlap defines a supply zone or a hidden resistance level and serves as a signal for potential sell trades.
When the price returns to this zone, it often continues its downward trend, providing an optimal point for entering sell trades.
The IFVG indicator also includes various filters that traders can use to refine their analysis based on market conditions. These filters, including Very Aggressive, Aggressive, Defensive, and Very Defensive, allow users to customize the IFVG zones' width, offering flexibility according to the trader’s risk tolerance and trading style.
🟣 Example Trading Scenarios
Suppose you’re in a strong uptrend and the IFVG indicator identifies a Bullish IFVG zone. In this scenario, you could consider entering a buy trade when the price retraces to this zone, expecting the uptrend to resume. Conversely, in a downtrend, a Bearish IFVG zone can signal a favorable entry point for short trades when the price revisits this area.
🔵 Settings
Implied Block Validity Period: This parameter specifies the validity period of each identified block, taking into account the number of bars that have passed since its formation. Proper adjustment of this period helps traders focus only on relevant zones, increasing the accuracy of the analysis.
Mitigation Level OB : This option defines the mitigation level for supply and demand blocks (Order Blocks), with settings including Proximal, 50% OB, and Distal.
Depending on the selected level, the indicator will focus on closer, mid-range, or farther points for block identification, allowing traders to adjust for the level of precision required.
Implied Filter : Activating this filter allows traders to apply conditions based on the width of the IFVG zones. With options like Very Aggressive and Very Defensive, traders can control the width of IFVG zones to suit their risk management strategy—whether they prefer high-risk setups or low-risk setups.
Display and Color Settings : This section enables users to customize the appearance of the IFVG zones on their charts. Traders can set different colors for Bullish and Bearish zones, allowing for easier distinction and improved visualization.
Alert Settings : One of the standout features of the IFVG indicator is the alert system. By setting up alerts, users can be notified whenever the price approaches a demand or supply zone.
Alerts can be customized to trigger Once Per Bar (one alert per bar) or Per Bar Close (alert at the close of each bar), ensuring that traders stay updated on critical price movements without needing to monitor the chart continuously.
🔵 Conclusion
The ICT Implied Fair Value Gap (IFVG) indicator is a powerful and sophisticated tool in technical analysis, allowing professional traders to identify hidden supply and demand zones and use them as entry and exit points for buy and sell trades.
This indicator’s automatic detection of IFVG zones helps traders uncover hidden trading opportunities that can enhance their analysis.
While the IFVG indicator offers numerous advantages, it is important to use it in conjunction with other technical analysis tools and sound risk management practices.
IFVG alone does not guarantee profitability in trading; it works best when combined with other indicators such as volume analysis and trend-following indicators for a comprehensive trading strategy.

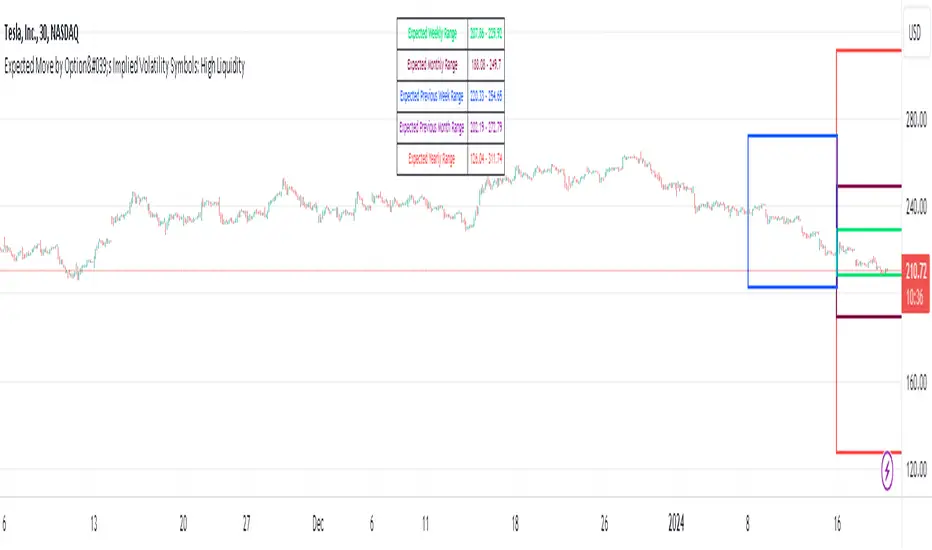
Expected Move by Option's Implied Volatility High Liquidity
This script plots boxes to reflect weekly, monthly and yearly expected moves based on "At The Money" put and call option's implied volatility.
Symbols in range: This script will display Expected Move data for Symbols with high option liquidity.
Weekly Updates: Each weekend, the script is updated with fresh expected move data, a job that takes place every Saturday following the close of the markets on Friday.
In the provided script, several boxes are created and plotted on a price chart to represent the expected price moves for various timeframes.
These boxes serve as visual indicators to help traders and analysts understand the expected price volatility.
Definition of Expected Move: Expected Move refers to the anticipated range within which the price of an underlying asset is expected to move over a specific time frame, based on the current implied volatility of its options. Calculation: Expected Move is typically calculated by taking the current stock price and applying a multiple of the implied volatility. The most commonly used multiple is the one-standard-deviation move, which encompasses approximately 68% of potential price outcomes.
Example: Suppose a stock is trading at $100, and the implied volatility of its options is 20%. The one-standard-deviation expected move would be $100 * 0.20 = $20.
This suggests that there is a 68% probability that the stock's price will stay within a range of $80 to $120 over the specified time frame. Usage: Traders and investors use the expected move as a guideline for setting trading strategies and managing risk. It helps them gauge the potential price swings and make informed decisions about buying or selling options.There is a 68% chance that the underlying asset stock or ETF price will be within the boxed area at option expiry. The data on this script is updating weekly at the close of Friday, calculating the implied volatility for the week/month/year based on the "at the money" put and call options with the relevant expiry. This script will display Expected Move data for Symbols within the range of JBL-NOTE in alphabetical order.
In summary, implied volatility reflects market expectations about future price volatility, especially in the context of options. Expected Move is a practical application of implied volatility, helping traders estimate the likely price range for an asset over a given period. Both concepts play a vital role in assessing risk and devising trading strategies in the options and stock markets.
Expected Move by Option's Implied Volatility Symbols: EAT - GBDC
This script plots boxes to reflect weekly, monthly and yearly expected moves based on "At The Money" put and call option's implied volatility.
Symbols in range: This script will display Expected Move data for Symbols within the range of EAT-GDBC in alphabetical order.
Weekly Updates: Each weekend, the script is updated with fresh expected move data, a job that takes place every Saturday following the close of the markets on Friday.
In the provided script, several boxes are created and plotted on a price chart to represent the expected price moves for various timeframes.
These boxes serve as visual indicators to help traders and analysts understand the expected price volatility.
Definition of Expected Move: Expected Move refers to the anticipated range within which the price of an underlying asset is expected to move over a specific time frame, based on the current implied volatility of its options. Calculation: Expected Move is typically calculated by taking the current stock price and applying a multiple of the implied volatility. The most commonly used multiple is the one-standard-deviation move, which encompasses approximately 68% of potential price outcomes.
Example: Suppose a stock is trading at $100, and the implied volatility of its options is 20%. The one-standard-deviation expected move would be $100 * 0.20 = $20.
This suggests that there is a 68% probability that the stock's price will stay within a range of $80 to $120 over the specified time frame. Usage: Traders and investors use the expected move as a guideline for setting trading strategies and managing risk. It helps them gauge the potential price swings and make informed decisions about buying or selling options. There is a 68% chance that the underlying asset stock or ETF price will be within the boxed area at option expiry. The data on this script is updating weekly at the close of Friday, calculating the implied volatility for the week/month/year based on the "at the money" put and call options with the relevant expiry.
In summary, implied volatility reflects market expectations about future price volatility, especially in the context of options. Expected Move is a practical application of implied volatility, helping traders estimate the likely price range for an asset over a given period. Both concepts play a vital role in assessing risk and devising trading strategies in the options and stock markets.

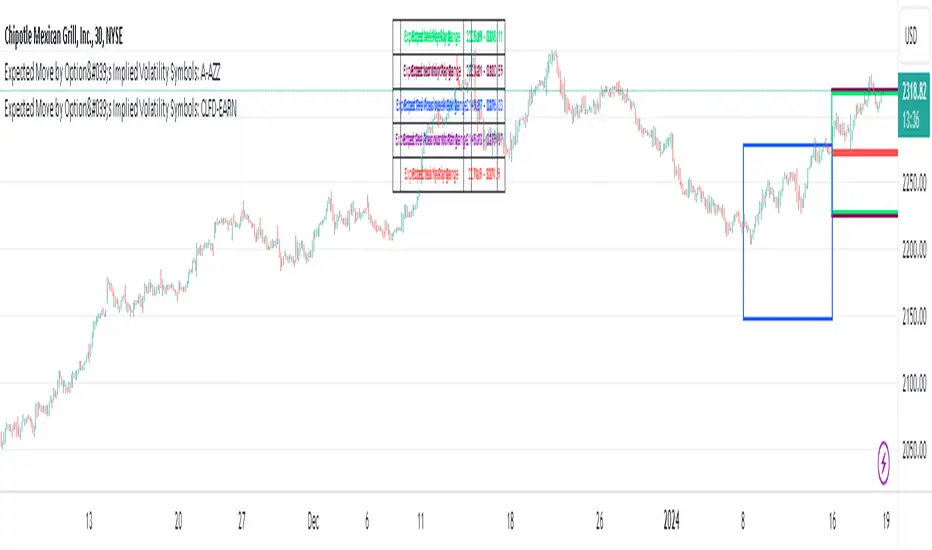
Expected Move by Option's Implied Volatility Symbols: CLFD-EARN This script plots boxes to reflect weekly, monthly and yearly expected moves based on "At The Money" put and call option's implied volatility.
Symbols in range: This script will display Expected Move data for Symbols within the range of CLFD - EARN in alphabetical order.
Weekly Updates: Each weekend, the script is updated with fresh expected move data, a job that takes place every Saturday following the close of the markets on Friday.
In the provided script, several boxes are created and plotted on a price chart to represent the expected price moves for various timeframes.
These boxes serve as visual indicators to help traders and analysts understand the expected price volatility.
Definition of Expected Move: Expected Move refers to the anticipated range within which the price of an underlying asset is expected to move over a specific time frame, based on the current implied volatility of its options. Calculation: Expected Move is typically calculated by taking the current stock price and applying a multiple of the implied volatility. The most commonly used multiple is the one-standard-deviation move, which encompasses approximately 68% of potential price outcomes.
Example: Suppose a stock is trading at $100, and the implied volatility of its options is 20%. The one-standard-deviation expected move would be $100 * 0.20 = $20.
This suggests that there is a 68% probability that the stock's price will stay within a range of $80 to $120 over the specified time frame. Usage: Traders and investors use the expected move as a guideline for setting trading strategies and managing risk. It helps them gauge the potential price swings and make informed decisions about buying or selling options. There is a 68% chance that the underlying asset stock or ETF price will be within the boxed area at option expiry. The data on this script is updating weekly at the close of Friday, calculating the implied volatility for the week/month/year based on the "at the money" put and call options with the relevant expiry.
In summary, implied volatility reflects market expectations about future price volatility, especially in the context of options. Expected Move is a practical application of implied volatility, helping traders estimate the likely price range for an asset over a given period. Both concepts play a vital role in assessing risk and devising trading strategies in the options and stock markets.
Expected Move by Option's Implied Volatility Symbols: B - CLF
This script plots boxes to reflect weekly, monthly and yearly expected moves based on "At The Money" put and call option's implied volatility.
Symbols in range: This script will display Expected Move data for Symbols within the range of B - CLF in alphabetical order.
Weekly Updates: Each weekend, the script is updated with fresh expected move data, a job that takes place every Saturday following the close of the markets on Friday.
In the provided script, several boxes are created and plotted on a price chart to represent the expected price moves for various timeframes.
These boxes serve as visual indicators to help traders and analysts understand the expected price volatility.
Definition of Expected Move: Expected Move refers to the anticipated range within which the price of an underlying asset is expected to move over a specific time frame, based on the current implied volatility of its options. Calculation: Expected Move is typically calculated by taking the current stock price and applying a multiple of the implied volatility. The most commonly used multiple is the one-standard-deviation move, which encompasses approximately 68% of potential price outcomes.
Example: Suppose a stock is trading at $100, and the implied volatility of its options is 20%. The one-standard-deviation expected move would be $100 * 0.20 = $20.
This suggests that there is a 68% probability that the stock's price will stay within a range of $80 to $120 over the specified time frame. Usage: Traders and investors use the expected move as a guideline for setting trading strategies and managing risk. It helps them gauge the potential price swings and make informed decisions about buying or selling options. There is a 68% chance that the underlying asset stock or ETF price will be within the boxed area at option expiry. The data on this script is updating weekly at the close of Friday, calculating the implied volatility for the week/month/year based on the "at the money" put and call options with the relevant expiry.
In summary, implied volatility reflects market expectations about future price volatility, especially in the context of options. Expected Move is a practical application of implied volatility, helping traders estimate the likely price range for an asset over a given period. Both concepts play a vital role in assessing risk and devising trading strategies in the options and stock markets.
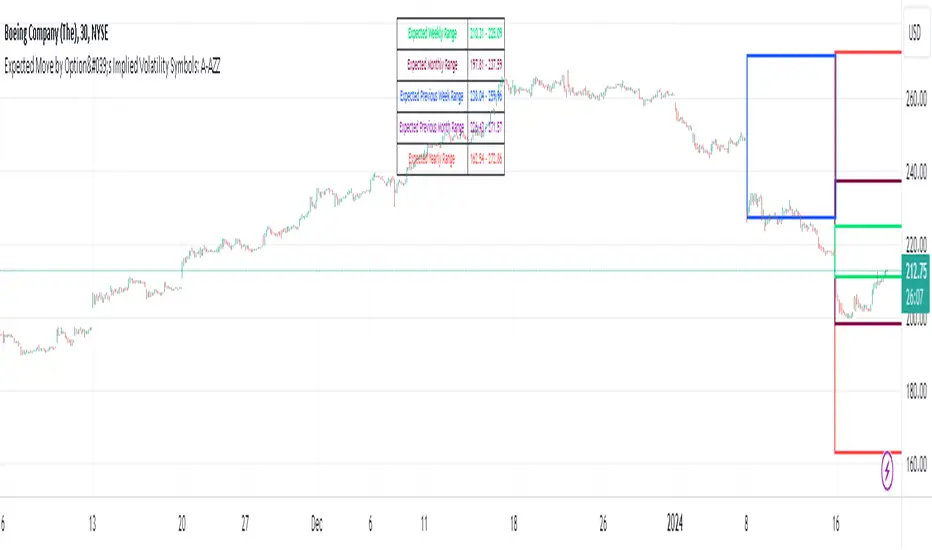
Expected Move by Option's Implied Volatility Symbols: A - AZZ
This script plots boxes to reflect weekly, monthly and yearly expected moves based on "At The Money" put and call option's implied volatility.
Symbols in range: This script will display Expected Move data for Symbols within the range of A - AZZ in alphabetical order.
Weekly Updates: Each weekend, the script is updated with fresh expected move data, a job that takes place every Saturday following the close of the markets on Friday.
In the provided script, several boxes are created and plotted on a price chart to represent the expected price moves for various timeframes.
These boxes serve as visual indicators to help traders and analysts understand the expected price volatility.
Definition of Expected Move: Expected Move refers to the anticipated range within which the price of an underlying asset is expected to move over a specific time frame, based on the current implied volatility of its options. Calculation: Expected Move is typically calculated by taking the current stock price and applying a multiple of the implied volatility. The most commonly used multiple is the one-standard-deviation move, which encompasses approximately 68% of potential price outcomes.
Example: Suppose a stock is trading at $100, and the implied volatility of its options is 20%. The one-standard-deviation expected move would be $100 * 0.20 = $20.
This suggests that there is a 68% probability that the stock's price will stay within a range of $80 to $120 over the specified time frame. Usage: Traders and investors use the expected move as a guideline for setting trading strategies and managing risk. It helps them gauge the potential price swings and make informed decisions about buying or selling options. There is a 68% chance that the underlying asset stock or ETF price will be within the boxed area at option expiry. The data on this script is updating weekly at the close of Friday, calculating the implied volatility for the week/month/year based on the "at the money" put and call options with the relevant expiry.
In summary, implied volatility reflects market expectations about future price volatility, especially in the context of options. Expected Move is a practical application of implied volatility, helping traders estimate the likely price range for an asset over a given period. Both concepts play a vital role in assessing risk and devising trading strategies in the options and stock markets.

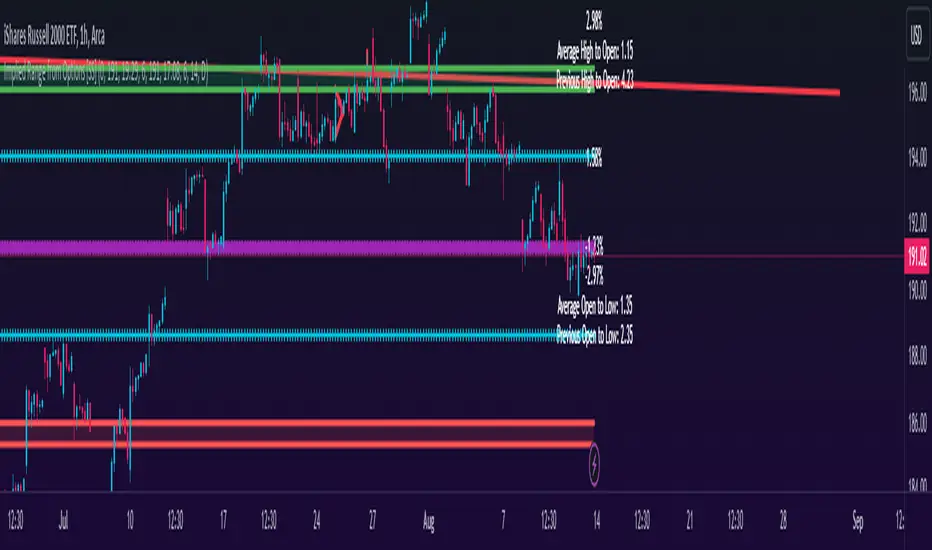
Implied Range from Options [SS]I have been promising to post this for a while, but I just needed to make sure that a) there were no similar indicators already available and b) make it a bit more user friendly.
So here it is, a basic indicator that will display the implied range from options.
In addition to displaying the implied range from options, it will provide some secondary information to help add context to the implied range. Those are shown in the chart below:
The indicator will list various precents at each point to the upside and to the downside. This is the percent move required, based on the current close price, to obtain any point in the implied move range.
In addition, the indicator will display the average move from open to high and open to low over a user defined period (default to 14 candle period) as well as the previous open to high and open to low move from the previous day.
This is to give you context of:
a) How much of a % increase or decrease is required to reach the implied ranges; and
b) How does the implied range compare to the ticker's average moves.
An increased implied range that exceeds the ticker's average move can alert you that the market is pricing in an above average move. This can be helpful and alert you to potential news releases or other fundamental things that have the potential to move the market.
How to Use the indicator:
So unfortunately, this indicator requires a bit of manual input. I was going to do an auto IV calculcation using Black-Scholes Model but just to be more rigorous in accuracy, I decided to, for now, leave it at a manual input. So when you launch the settings menu, this is what you will see:
You can collect all of this required information from your broker. Inversely, you can collect it online for free from various services such as Barchart or COBE's exchange website. The easiest way is to just pull it from your broker though.
Make sure, if you are doing weekly options to see the weekly range, you set the timeframe to 1 week. The timeframe function will calculate the average move over the desired timeframe length. So if you are doing a 0 dte for the next day, you want to see the intra-day range and will select the 1 day timeframe. It will then present to you the range averages and information on the daily timeframe for you to compare to the implied options range.
Same for the weekly, monthly, yearly, etc.
Additional options:
The indicator provides the midline average and midway points, to add static targets if you are trading the implied range.
These can be toggled on or off in the settings menu:
As well, as you can see, you can also toggle off the range labels.
There is also an offset option. This allows you to extend the range into the future:
Simply select how many candles you would like to plot the range in advance.
Closing remarks
That is the indicator. Its very simple, but it is handy. I was never one to pay attention to option pricing data, but I have been plotting it out daily and weekly these past few weeks and it does add a bit of context in terms of what the market is thinking. So I do recommend actually adding it to your repertoire of analyses going into the weeks and months, and really just paying attention to how the average ranges compare to what the market is pricing in.
One quick suggestion, select the strike price that aligns with the closing price of the ticker. This gives you a better representation of the range.
Safe trades everyone and leave your comments, questions and suggestions below!
ICT Implied Fair Value Gap (IFVG) [LuxAlgo]An Implied Fair Value Gap (IFVG) is a three candles imbalance formation conceptualized by ICT that is based on detecting a larger candle body & then measuring the average between the two adjacent candle shadows.
This indicator automatically detects this imbalance formation on your charts and can be extended by a user set number of bars.
The IFVG average can also be extended until a new respective IFVG is detected, serving as a support/resistance line.
Alerts for the detection of bullish/bearish IFVG's are also included in this script.
🔶 SETTINGS
Shadow Threshold %: Threshold percentage used to filter out IFVG's with low adjacent candles shadows.
IFVG Extension: Number of bars used to extend highlighted IFVG's areas.
Extend Averages: Extend IFVG's averages up to a new detected respective IFVG.
🔶 USAGE
Users of this indicator can primarily find it useful for trading imbalances just as they would for trading regular Fair Value Gaps or other imbalances, which aims to highlight a disparity between supply & demand.
For trading a bullish IFVG, users can find this imbalance as an area where price is likely to fill or act as an area of support.
In the same way, a user could trade bearish IFVGs by seeing it as a potential area to be filled or act as resistance within a downtrend.
Users can also extend the IFVG averages and use them as longer-term support/resistances levels. This can highlight the ability of detected IFVG to provide longer term significant support and resistance levels.
🔶 DETAILS
Various methods have been proposed for the detection of regular FVG's, and as such it would not be uncommon to see various methods for the implied version.
We propose the following identification rules for the algorithmic detection of IFVG's:
🔹 Bullish
Central candle body is larger than the body of the adjacent candles.
Current price low is higher than high price two bars ago.
Current candle lower shadow makes up more than p percent of its total candle range.
Candle upper shadow two bars ago makes up more than p percent of its total candle range.
The average of the current candle lower shadow is greater than the average of the candle upper shadow two bars ago.
where p is the user set threshold.
🔹 Bearish
Central candle body is larger than the body of the adjacent candles.
Current price high is higher than low price two bars ago.
Current candle upper shadow makes up more than p percent of its total candle range.
Candle lower shadow two bars ago makes up more than p percent of its total candle range.
The average of the candle lower shadow 2 bars ago is greater than the average of the current candle higher shadow.
where p is the user set threshold.
🔶 SUPPLEMENTARY MATERIAL
You can see our previously posted script that detects various imbalances as well as regular Fair Value Gaps which have very similar usability to Implied Fair Value Gaps here:

Implied Volatility Suite (TG Fork)Displays the Implied Volatility, which is usually calculated from options, but here is calculated indirectly from spot price directly, either using a model or model-free using the VIXfix.
The model-free VIXfix based approach can detect times of high volatility, which usually coincides with panic and hence lowest prices. Inversely, the model-based approach can detect times of highest greed.
Forked and updated by Tartigradia to fix some issues in the calculations, convert to pinescript v5 and reverse engineered to reproduce the "Implied Volatility Rank & Model Free IVR" indicator by the same author (but closed source) and allow to plot both model-based and model-free implied volatilities simultaneously.
If you like this indicator, please show the original author SegaRKO some love:
EWMA Implied Volatility based on Historical VolatilityVolatility is the most common measure of risk.
Volatility in this sense can either be historical volatility (one observed from past data), or it could implied volatility (observed from market prices of financial instruments.)
The main objective of EWMA is to estimate the next-day (or period) volatility of a time series and closely track the volatility as it changes.
The EWMA model allows one to calculate a value for a given time on the basis of the previous day's value.
The EWMA model has an advantage in comparison with SMA, because the EWMA has a memory.
The EWMA remembers a fraction of its past by a factor A, that makes the EWMA a good indicator of the history of the price movement if a wise choice of the term is made.
Full details regarding the formula :
www.investopedia.com
In this scenario, we are looking at the historical volatility using the anual length of 252 trading days and a monthly length of 21.
Once we apply all of that we are going to get the yearly volatility.
After that we just have to divide that by the square root of number of days in a year, or weeks in a year or months in a year in order to get the daily/weekly/monthly expected volatility.
Once we have the expected volatility, we can estimate with a high chance where the market top and bottom is going to be and continue our analysis on that premise.
If you have any questions, please let me know !

vol_rangesThis script shows three measures of volatility:
historical (hv): realized volatility of the recent past
median (mv): a long run average of realized volatility
implied (iv): a user-defined volatility
Historical and median volatility are based on the EWMA, rather than standard deviation, method of calculating volatility. Since Tradingview's built in ema function uses a window, the "window" parameter determines how much historical data is used to calculate these volatility measures. E.g. 30 on a daily chart means the previous 30 days.
The plots above and below historical candles show past projections based on these measures. The "periods to expiration" dictates how far the projection extends. At 30 periods to expiration (default), the plot will indicate the one standard deviation range from 30 periods ago. This is calculated by multiplying the volatility measure by the square root of time. For example, if the historical volatility (hv) was 20% and the window is 30, then the plot is drawn over: close * 1.2 * sqrt(30/252).
At the most recent candle, this same calculation is simply drawn as a line projecting into the future.
This script is intended to be used with a particular options contract in mind. For example, if the option expires in 15 days and has an implied volatility of 25%, choose 15 for the window and 25 for the implied volatility options. The ranges drawn will reflect the two standard deviation range both in the future (lines) and at any point in the past (plots) for HV (blue), MV (red), and IV (grey).

Volume using Candle RangeAnother way of finding out a rough estimate of the volume or how much bulls or bears were in control using only the range of the candlesticks in relation to the closing price. If the close is in the higher range zone then the volume is said to have been positive, if the close is in the lower range zone then the volume is said to have been negative. The close is compared to the midpoint of the candle to see how far from the midpoint the close was.
The columns bars show how far each candlestick's close price is to the midpoint of its high and low. It's possible for the column bar to be a different color than the candlestick itself if the close was above or below the midpoint. An average line is shown that takes the average of a given length amount of column bars. There is an option to show the absolute value only of the columns and the average line.
This is based on an idea I found about candlestick range bars implying volume. This is an attempt to put that theory into practice and to see if there's any truth to it. It's not exactly volume and may not always look like it, and it does not show how many trades took place but instead tries to use price in relation to the high and low range.

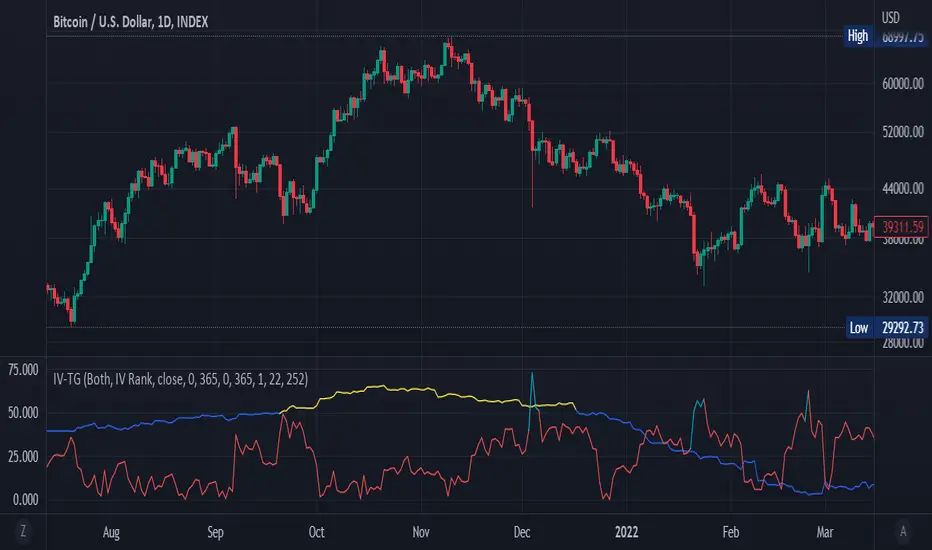
VIX-VXV-Ratio-Buschi
English:
This script shows the ratio between the VIX (implied volatility of SPX options over the next month) and the VXV (implied volatility of SPX options over the next three months). Since in normal "Contango" mode, the VXV should be higher than the VIX, the crossing under 1.0 or maybe 0.95 after a volatility spike could be a sign for a calming market or at least a calming volatility.
Deutsch:
Dieses Skript zeigt das Verhältnis zwischen dem VIX (implizite Volatilität der SPX-Optionen über den nächsten Monat) und dem VXV (implizite Volatilität der SPX-Optionen über die nächsten drei Monate). Da im normalen "Contango"-Modus der VXV höher als der VIX liegen sollte, kann das Abfallen unter 1,0 oder 0,95 nach einer Volatilitätsspitze ein Anzeichen für einen ruhiger werdenden Markt oder zumindest eine ruhiger werdende Volatilität sein.

OHLC Volatility Estimators by @Xel_arjonaDISCLAIMER:
The Following indicator/code IS NOT intended to be a formal investment advice or recommendation by the author, nor should be construed as such. Users will be fully responsible by their use regarding their own trading vehicles/assets.
The embedded code and ideas within this work are FREELY AND PUBLICLY available on the Web for NON LUCRATIVE ACTIVITIES and must remain as is by Creative-Commons as TradingView's regulations. Any use, copy or re-use of this code should mention it's origin as it's authorship.
WARNING NOTICE!
THE INCLUDED FUNCTION MUST BE CONSIDERED AS DEBUGING CODE The models included in the function have been taken from openly sources on the web so they could have some errors as in the calculation scheme and/or in it's programatic scheme. Debugging are welcome.
WHAT'S THIS?
Here's a full collection of candle based (compressed tick) Volatility Estimators given as a function, openly available for free, it can print IMPLIED VOLATILITY by an external symbol ticker like INDEX:VIX.
Models included in the volatility calculation function:
CLOSE TO CLOSE: This is the classic estimator by rule, sometimes referred as HISTORICAL VOLATILITY and is the must common, accepted and widely used out there. Is based on traditional Standard Deviation method derived from the logarithm return of current close from yesterday's.
ELASTIC WEIGHTED MOVING AVERAGE: This estimator has been used by RiskMetriks®. It's calculation is based on an ElasticWeightedMovingAverage Standard Deviation method derived from the logarithm return of current close from yesterday's. It can be viewed or named as an EXPONENTIAL HISTORICAL VOLATILITY model.
PARKINSON'S: The Parkinson number, or High Low Range Volatility, developed by the physicist, Michael Parkinson, in 1980 aims to estimate the Volatility of returns for a random walk using the high and low in any particular period. IVolatility.com calculates daily Parkinson values. Prices are observed on a fixed time interval. n=10, 20, 30, 60, 90, 120, 150, 180 days.
ROGERS-SATCHELL: The Rogers-Satchell function is a volatility estimator that outperforms other estimators when the underlying follows a Geometric Brownian Motion (GBM) with a drift (historical data mean returns different from zero). As a result, it provides a better volatility estimation when the underlying is trending. However, this Rogers-Satchell estimator does not account for jumps in price (Gaps). It assumes no opening jump. The function uses the open, close, high, and low price series in its calculation and it has only one parameter, which is the period to use to estimate the volatility.
YANG-ZHANG: Yang and Zhang were the first to derive an historical volatility estimator that has a minimum estimation error, is independent of the drift, and independent of opening gaps. This estimator is maximally 14 times more efficient than the close-to-close estimator.
LOGARITHMIC GARMAN-KLASS: The former is a pinescript transcript of the model defined as in iVolatility . The metric used is a combination of the overnight, high/low and open/close range. Such a volatility metric is a more efficient measure of the degree of volatility during a given day. This metric is always positive.
