OVER RX (RSI lines) [RalphMark]Você agora pode enxergar quando o ativo atinge sobrecompra (70) ou sobrevenda (30) no RSI.
As barras coloridas ajudam você a identificar um toque.
Levels
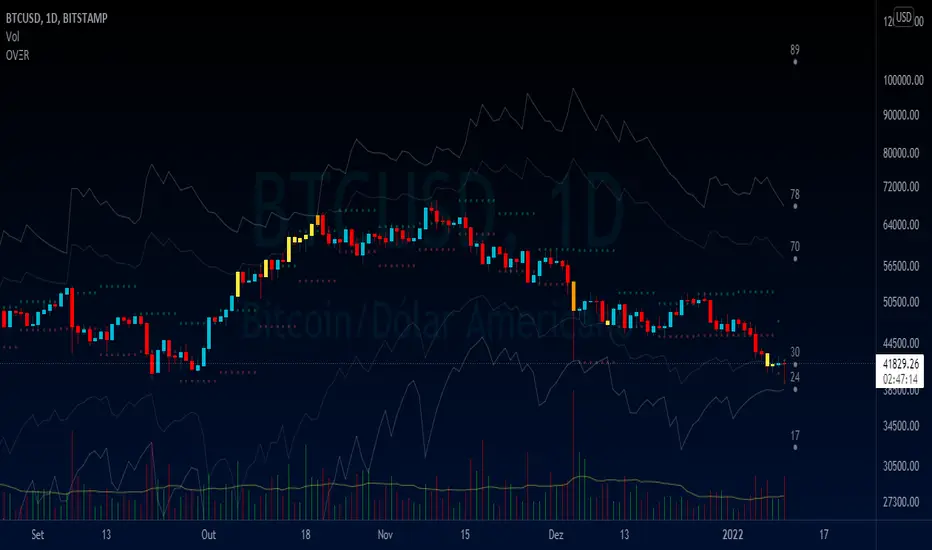
Percentage Levels by TimeframePlots the positive and negative percentage levels from a selection of timeframes and sources for any ticker. You can use this within a pullback trading system. For example, if you historically look at the average pullback of large cap stocks and ETF's, you can use this indicator to plot the levels it could pullback to for an entry to go long. It can be used as potential targets when trading a ticker short. Another use for this is to backtest the set percentage targets using TradingView's bar replay feature to see how ETF's and large cap stocks have reacted at these levels. Note: This is intended to be used at timeframes equal to higher than the chart's as it may cause re-painting issues.
Currently percentage levels are statically set to 1, 3, 5, 10, 15, 20, 25, and 30% levels above and below the chosen source (open, high, low, close). You can also display the data based on timeframes from Daily (1D) all the way up to Yearly (12M)
*Not financial advice but in my opinion the current percentage levels set (see above) are best used for ETF's and Large Cap Stocks.
Jan 2
Release Notes: Added the ability to select the historical bars to look back when plotting levels
Jan 2
Release Notes: To get a better display or proper resolution on your charts, change the view settings to "Scale Price Chart Only"
Jan 2
Release Notes: To add % labels for this indicator on the price axis, change your chart settings to include "Indicator Name Label" & "Indicator Last Value". You can find this under the Label section after hitting the gear icon in the bottom right of your chart.
Jan 2
Release Notes: Added: Custom Line Plot Extension Settings. Ideally both values should be equal to display optimal extended lines. To return to a base setting: '1' = Historical Lookback & '0' = Offset Lines. Also note this is dependent on the timeframe you are viewing on the chart.
Jan 2
Release Notes: Removed indicator from example chart that was not needed.
Jan 2
Release Notes: Updated some comments in the Pine Script
Jan 2
Release Notes: Update: Added commentary and instructions in the indicator settings to address recommended line plot settings for Stocks/ETF's vs Futures
Jan 2
Release Notes: Changed title from "Calculation Method" to "Calculation Source"
Jan 4 2021
Normal use of security() dictates that it only be used at timeframes equal to or higher than the chart's as it may cause re-painting

Impulse levelsThe indicator detects impulses based on an increase in ATR and volume, and also plots levels based on these impulses.

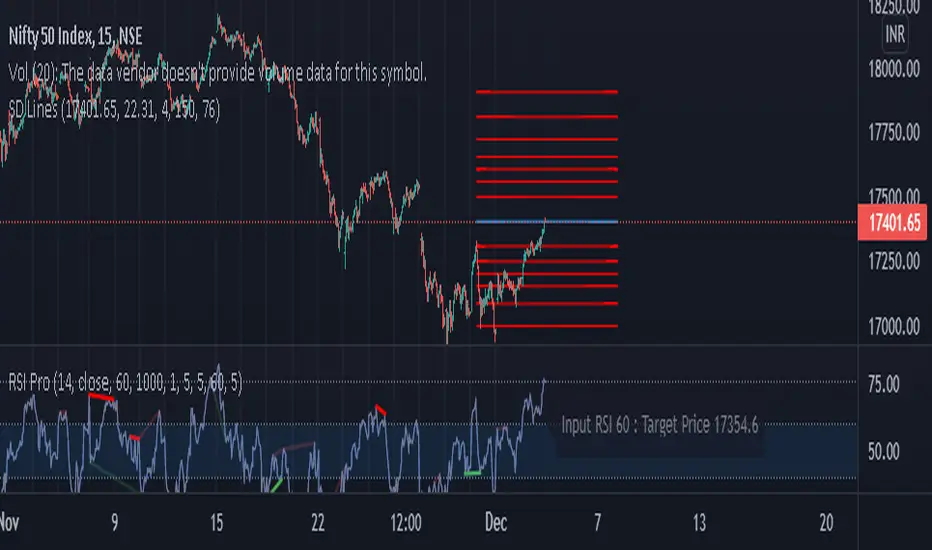
SD Lines for options [Nischay]Annual volatility is found from the NSE website in derivative section, select appropriate annualized volatility for selected instrument.
Nischay Rana
Spartan Trade Master 1.0Dear Traders/investors,
Make use of the Trade setup for intraday/Scalping/Swing Trading using Pivot Points , Along with CPR , EMA And Zone confirmation.
Advantages and Top Features:
-> CPR
-> Camarilla and standard Pivot Points
-> 20/50/100/200 EMA
-> Boring Candle
-> Next Day CPR & Camarilla
-> Multi Timeframe Analysis Using single chart
-> Previous Day High And Low
-> Supply and Demand Zones Based on Timeframes
How to Use?
Camarilla Trade Setup:
Green Zone: Reversal Buy Zone
Red Zone: Reversal Sell Zone
CPR Trade Setup:
1. Narrow CPR indicates Trending market
2. Wide CPR indicates sideways market
CPR + Camarilla confirmation:
Whenever there is a Narrow CPR we need to look for Breakout Trades.
Whenever there is a Wide CPR we need to look for Reversal Trade.
EMA : Exponential moving average tries to reduce confusion and noise of everyday price action.
Boring candle: Helps to identify any explosive or non-explosive moves, during marking of demand and supply zones.

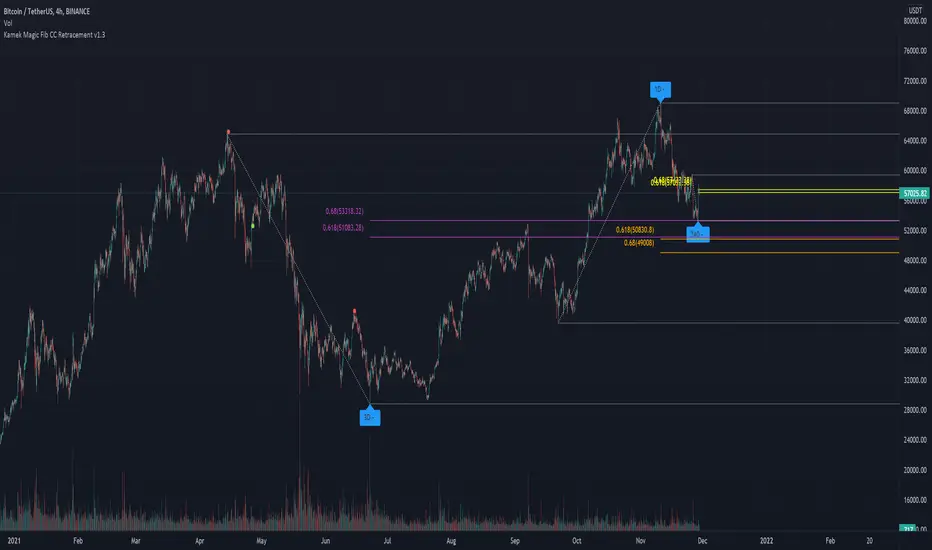
Kamek CC Magic v1.2This indicator has been created to automatically find the sweet spot for two fib levels. 0.618 & 0.66
- Using 3 Time Frame pivot points for fibs
- Each Time Frame pivot has fib retracement levels with customizable levels
- dynamic pivot left and right lookback period to adjust the lag in the higher highs and lower lows
Note: You need to have the chart time frame on the lowest fib time frame.
Recommended to use for scalping
0.618 & 0.66 for each Time frame.
1hr, 4hr, 1day
Recommended to use for Swing
0.618 & 0.68 for each Time frame.
4hr, 1day, 3day
but you can still use your own strategy using 4 fib levels.
The idea is based on the course material from Chart Champions
Its recommended using S&R levels or session volume to confirm entry or exit
Multi Oscillators Price LevelsThis script draws price levels corresponding to the highest price reached in overbought situations, and the lowest price reached in oversold situations, depending on the oscillator and the timeframe the user has configured.
These levels correspond, most of time, to good supports and resistances prices.
Price levels drawings can be based on the following indicators:
Stochastic RSI (default)
Stochastic CCI
RSI
CCI
You can customize this indicator with the following options:
Source: The candle source to use in indicators calculation
Source Indicator: The indicator on which you cant to base your levels
Timeframe: The timeframe on which you want to apply the selected indicator, and calculate levels
Show supports/resistances: enable/disable price levels, depending on there status (overbought - resistances) / (oversold - supports)
Lines width: width of price levels. (set to 10 by default in order to draw "zones")
Supports/Resistances source: Select the candle data you cant to use to draw supports and resistances levels
Extend levels: Select the line extension for price levels
Levels color: Select the desired color for price levels
And of course , all parameters corresponding to the supported indicators (Stoch, RSI, CCI)
Here are a few examples of different configurations:
This script will probably be modified in the future, don't hesitate to suggest any improvement.

QF LevelsQF LEVELS is an Indicator that displays various Levels and Session Ranges .
Daily / Weekly / Monthly / Quarterly / Yearly - Open levels
Previous DWMQY - Open levels
Monday - High / Mid / Low - Levels
Intraday (4H) Levels
London / New York / Asian - Sessions
Automatic Coloring based on Support / Resistance
Full Color Customization
Themes coming in next update

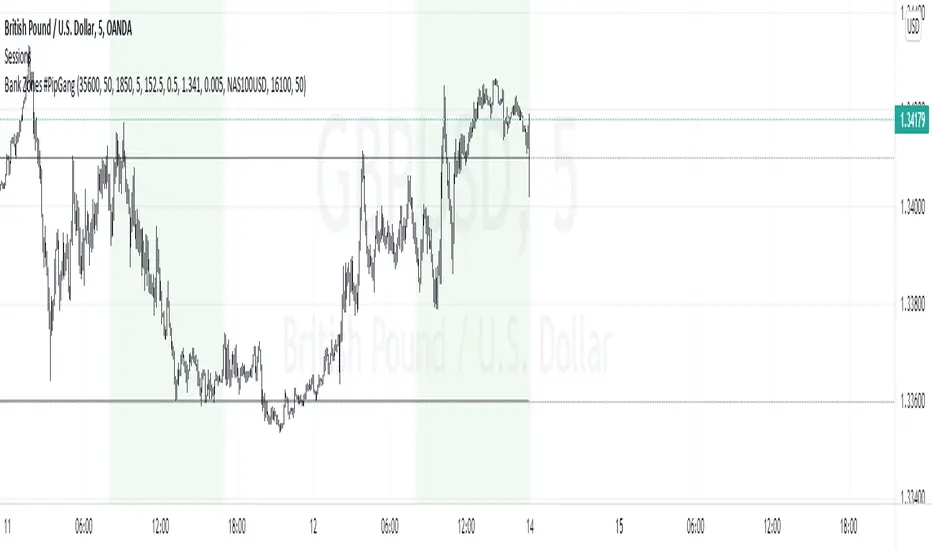
Bank Zones #PipGangHello Traders,
If you trade Forex and Indices this indicator will help you identify Buying and Selling levels that Banks are interested in. These levels are displayed on all time frames. Colors of the lines can be customized.
I also added code to show two EMA's, just uncomment the code to show them. :-)
How to use this indicator.
Show Bank Zones - this will enable/disable horizonal lines on the chart.
Price - enter bank zone price.
Increment By - plots three horizonal lines in pips above and below bank zone price.
Note: Decimal placement is KEY, this may vary by symbol.
Sample Settings:
US30USD
Price 35600.0
IncrementBy 50 (equals 50 pips)
XAUUSD
Price 1850.000
IncrementBy 5 (equals 50 pips)
GBPJPY
Price 152.500
IncrementBy .5 (equals 50 pips)
GBPUSD
Price 1.34100
IncrementBy .005 (equals 50 pips)
No Duplicates Interval Range & EQGenerates Range & EQ levels and removes duplicates. Prioritizes by higher timeframe for duplicates. For example, on Monday's open, weekly open is displayed while daily open is hidden automatically.

[MF] Auto Fibonacci LevelsDescription:
Automatically draw Fibonacci Pivot levels based on the previous (day's, week's or month's)
Range ( High-Low ). The HLC3 is used as the default Pivot level.
Unlike the "Auto Fibonacci Levels", this variation does not update
Levels on current day even if the price goes past the R3/S3 levels.
Timeframes: 1D, 1W, 1M
Range = (High - Low) - From previous Day, Week or month.
FIB LEVELS:
- Yellow = Pivot and Pivot Zone (HLC3 by default)
- red = R1,S1 Levels 0.236 * Range
- Green = R2,S2 Levels 0.368 * Range
- Lime = R3,S3 Levels 0.618 * Range
- Blue = R4,S4 Levels 0.786 * Range
- Gray = R5,S5 Levels 1.000 * Range
- Lime = R6,S6 Levels 1.236 * Range
- Red = R7,S7 Levels 1.382 * Range
- Blue = R8,S8 Levels 1.618 * Range
- Green = R9,S9 Levels 2.000 * Range
CLASSIC LEVELS:
- Yellow = Pivot and Pivot Zone (HLC3)
- Green = R1,S1 Levels (Pivot*2 - Low), (Pivot*2 - High)
- Lime = R2,S2 Levels ( Pivot + Range), ( Pivot - Range)
- Lime = R3,S3 Levels (High + 2*( Pivot - Low)), (Low - 2*(High - Pivot ))
- Blue = R4,S4 Levels (High + 3*( Pivot - Low)), (Low - 3*(High - Pivot ))
Refrences:
- Auto Daily Fib Levels R3.0 by JustUncleL
- Auto Fib by TheYangGuizi
- Monthly Dynamic Range Levels (Fibonaci) V0 by RicardoSantos
Modifications:
- Added next FIB Levels. (changes during the current cycle)
- Added FIB 0.236 Levels
- Added Option to change the colors of the Fib Levels
- Changed Default colors to the colors of Tradingview
- Upgraded to Version4 Pinescript

Volume MA * Fibo levelsIn the scrypt above, the SMA of Volume is taken as a basis and the Fibonacci levels are calculated.
This can be useful for analyzing the trend in accordance with changes in volume.
Any feedback is appreciated!
Good luck with your trading!

Market Sessions Open/Close LevelsThis indicator displays the market open and close price levels for the main trading sessions (Sydney, Tokyo, Frankfurt, London and New York). The Daily Line changes color depending on if price is trading above or below the level. Feel free to add or replace levels depending on your trading style and trading times.

Levels High LowEnglish:
Indicator for quickly identifying support and resistance levels. It is possible to use the parameter of the length of the upper and lower levels. The larger it is, the stronger the levels of the levels. The smaller it is, the less strong the levels are. It is possible to go back and turn off labels and lines. By default, the labels and lines are scale, and the length is 20.
Русский:
Индикатор предназначен для быстрого определения уровней поддержки и сопротивления. Есть возможность изменять параметр длинны верхних уровней и нижних. Чем он больше, тем более сильные уровни отображаются. Чем он меньше, тем менее сильные уровни отображаются. Есть возможность включать и отключать метки и линии. По умолчанию метки и линии отображаются, а длинна равна 20.

High Low Open Mid Ranges & Levels (Multi-Timeframe)This indicator automatically plots the chosen timeframe's high, low, mid point and open. These levels on higher timeframes act as support and resistance levels on lower timeframes, helping find entries, stoploss and profit targets.
Most common timeframes to choose are Daily, 1W, 1M, and 3M. Other timeframes that are good include, 2D, 2W and 2M.
For example, you can see in the snapshot below, we are on the 4hr TF showing those levels from the 2W. This historical 2W zone (open and mid) was (and currently still is) resistance. You can see it also provided a good entry to go short.
This is also useful for intraday scalping. Below, we are on the 15min TF with levels set on the 2D timeframe. You can see how the Open and Mid levels acted as resistance, providing good entries on range trades, with take profit set at the previous 2D low.
There is also a table which tells you all the main TFs high, low, open, and mid levels. They are the most important ones to look out for.
This indicator should not be used in isolation; it is best to pair it up with other TA such as orderblocks, S/D zones, S&R or overlay indicators.

Liquidity Levels [LuxAlgo]The Peak Activity Levels indicator displays support and resistance levels from prices accompanied by significant volume. The indicator includes a histogram returning the frequency of closing prices falling between two parallel levels, each bin shows the number of bullish candles within the levels.
1. Settings
Length: Lookback for the detection of volume peaks.
Number Of Levels: Determines the number of levels to display.
Levels Color Mode: Determines how the levels should be colored. "Relative" will color the levels based on their location relative to the current price. "Random" will apply a random color to each level. "Fixed" will use a single color for each level.
Levels Style: Style of the displayed levels. Styles include solid, dashed, and dotted.
1.1 Histogram
Show Histogram: Determines whether to display the histogram or not.
Histogram Window: Lookback period of the histogram calculation.
Bins Colors: Control the color of the histogram bins.
2. Usage
The indicator can be used to display ready-to-use support and resistance. These are constructed from peaks in volume. When a peak occurs, we take the price where this peak occurred and use it as the value for our level.
If one of the levels was previously tested, we can hypothesize that the level might be used as support/resistance in the future. Additional analysis using volume can be done in order to confirm a potential bounce.
The histogram can return various information to the user. It can show if the price stayed within two levels for a long time and if the price within two levels was mostly made of bullish or bearish candles.
In the chart above, we can see that over the most recent 200 bars (determined by Histogram Window) 68 closing prices fall between levels A and B, with 27 bars being bullish.
Additionally, the width of a bin and its length can sometimes give information about the volatility of a specific price variation. If a bin is very wide but short (a low number of closing prices fallen within the levels) then we can conclude a most of the movement was done on a short amount of time.

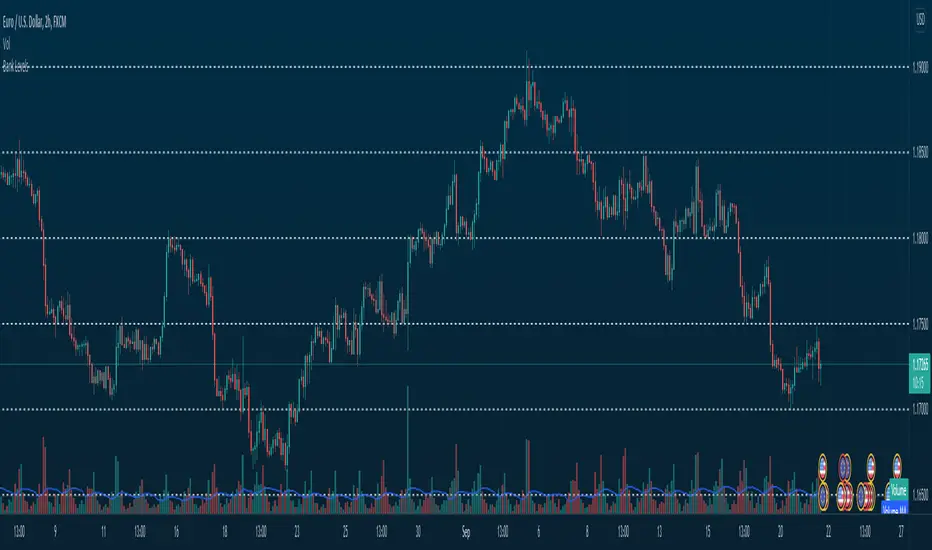
Bank Levels - Psychological Levels - Bitcoin, Indices, ForexThis got removed so I'm publishing it again.
What it is:
- This script draws in levels refereed to as bank levels. They are basically psychological/even numbers(40000, 45000, 150, 1850..)
Why doesn't it work on some charts?
- Each pair has a different tick value. You will have to edit the code to make it work on certain pairs. It's pretty simple, take a look.
CFD Ticks LevelsSimple but very effective script that finds areas of support and resistance through ticks exchange. Only works with CFDs
(You must enter in the settings the value corresponding to the CFD, example: US500 = 500, DAX30 = 30, FRANCE40 = 40 etc ...)
As usual, if you have any suggestions or bug reports don't hesitate.
Cheers

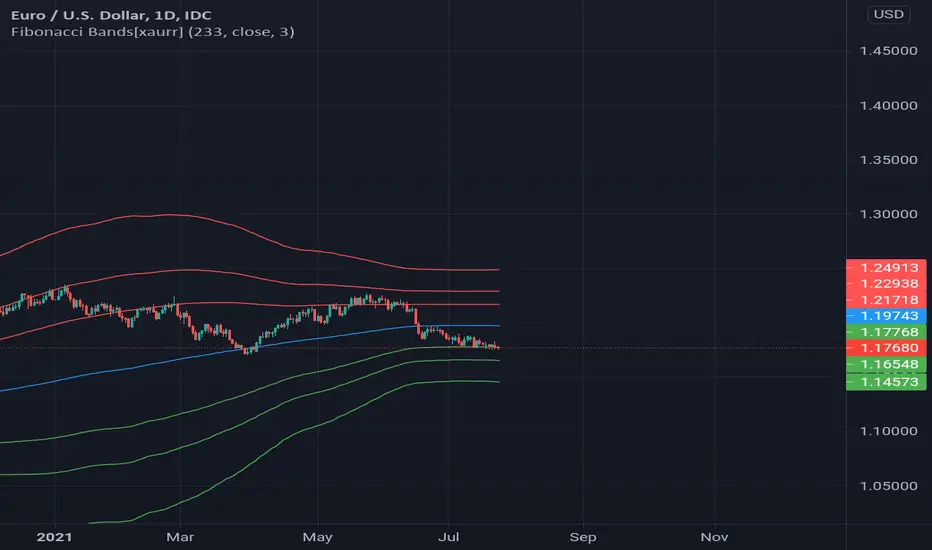
Fibonacci Bands[xaurr]This script draws Fibonacci bands according to std deviation using moving avarage with 233 periods, its the well know fibonacci number for following trend.
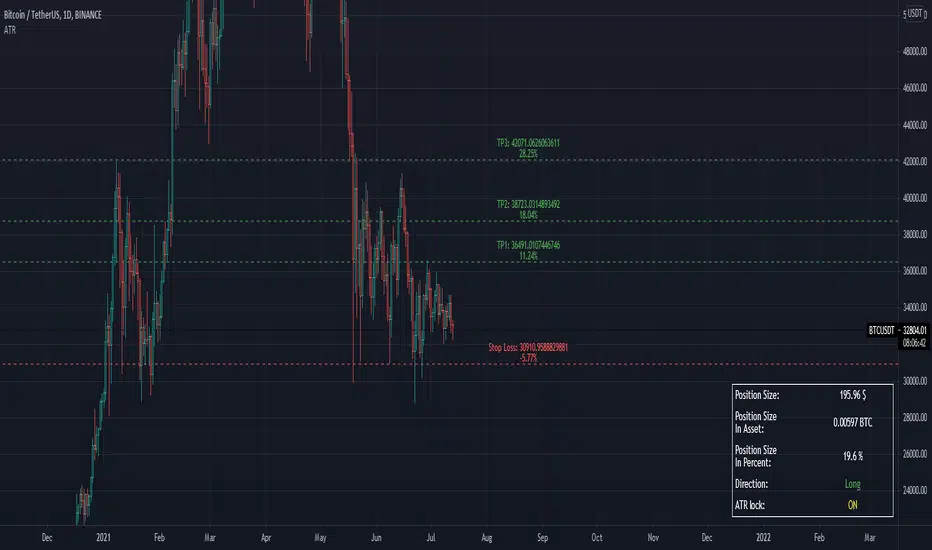
Awesome ATRB1rd's Awesome ATR:
An objective method of determining an initial Take Profit and Stop Loss, based on true market volatility and not arbitrary price levels. This indicator gives the user a powerful range of input variation with myriad permutations of smoothing and look back lengths, to build an objective value from which to measure profit and stop levels. This indicator also has a build-in alert function to keep you up to date with latest price developments regarding the ATR levels.
This indicator also automatically calculates a recommended position size based on our position sizing methodology. Simply input your capital amount and desired risk level. This indicator will display your optimum position size in USD or in Coin.
Purpose:
To give clear objective stop losses and take profit levels based off price volatility rather than arbitrary price levels, percentage points, ticks, pips, etc.
Yen PPLUse this Indicator to plot Psychological Price Levels on Yen Pairs, Set an alert to notify you when Price Action breaks a Psychological Price Level
This Indicator plots a 700 pip range.
When you first apply the Indicator a "Confirm Inputs" box will appear. Set the "Initial Value" box to a Flat .00 price about 350 pips below current Price Action.
This will set Current Price Action in about the middle of the range.
The PPL 1,2 and 3 "top" and "bot" settings represent the tops and bottoms of your Psychological Price Levels and allow you to adjust their location and width.
They are currently set to "Quarter Point Theory" and 2 pips wide.
You will probably want to leave PPL4 alone as it represents your Flat .00 numbers unless you want to adjust its width.
The Brightness and color can also be adjusted in "Bgcolor"
Set your alerts and enjoy.
Comments, Suggestions and Feedback are appreciated, Thanks for checking out the Indicator.

Stronger Classical Support/Resistance + Round LevelsI wrote some Support/Resistance scripts before this. In this new script, I implemented the logic of the code from the scratch, so it's very different from my previous S/R indicators and I think it's more advanced, accurate and efficient.
As the result it could do the followings for now:
- Draw more strong classical resistance/support levels by checking previous direction changes of the chart as far as Pine technically allows
- Colorize the levels based on the counted points of retracement/pullback (The darker the color is, the stronger the level is.)
- Show the number of reactions to each level
- Change the color of each level based on its main role as support, resistance or both
- Draw close round levels to current price for Forex pairs
I suggest all users of my previous S/R indicators to try this one.
Feel free to send me any issue or opinion!
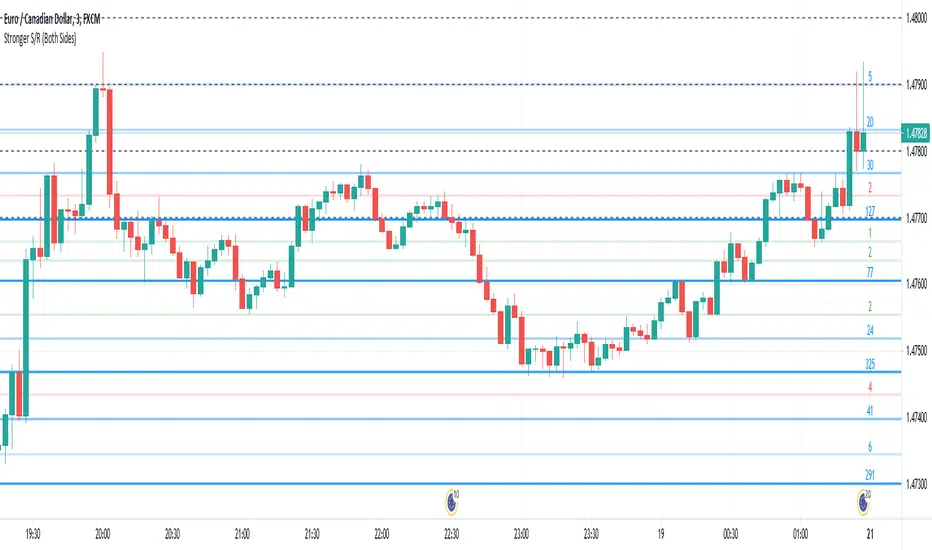
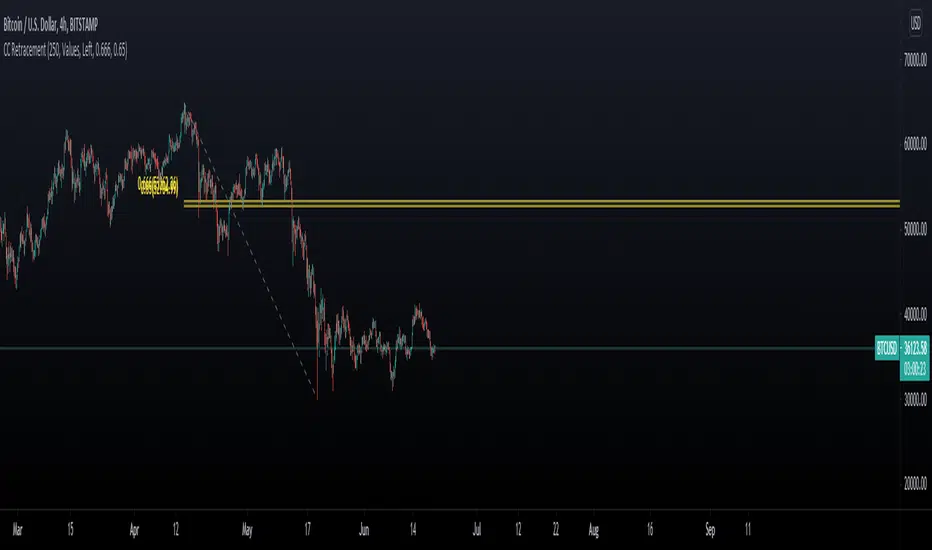
Chart Champions CC Pocket 0.65 -0.666 Fib levels or commonly know as the CC pocket
Marks Strong Support/Ressitance, Use with conflunce.
Lookback Length is adjustable
Let me know any suggestions or ideas which could help improve