JaT - Max/Min Labels ProDescription:
The JaT - Max/Min Labels Pro is a powerful and customizable tool designed for traders who want clear, precise, and visually appealing identification of local price extremes. This indicator dynamically detects local maxima and minima based on user-defined sensitivity and displays their values as labels directly on the chart.
Key Features:
Dynamic Extremes Detection: Automatically identifies local highs and lows using a user-configurable lookback period and sensitivity setting.
Customizable Label Offset: Allows you to position labels further away from the bars for enhanced visibility.
Clear Visualization: Labels are color-coded for clarity:
Green for Highs: Transparent green text (50% opacity) displayed above the bar.
Red for Lows: Transparent red text (50% opacity) displayed below the bar.
Efficient Performance: Utilizes optimized Pine Script arrays to manage labels dynamically and avoid clutter.
User-Friendly: Simple configuration with adjustable parameters for lookback period, sensitivity, and label offset.
Parameters:
Lookback Period: Defines the range of bars to analyze for extremes.
Sensitivity: Adjusts the smoothing level for extreme detection using a moving average.
Label Offset: Controls the vertical distance of labels from the bar, ensuring they are easy to read without overlapping.
Who is it for?
This indicator is ideal for traders who rely on technical analysis to spot potential reversal points, breakout levels, or key support/resistance zones. Whether you're a day trader, swing trader, or long-term investor, the JaT - Max/Min Labels Pro provides an elegant and practical solution for enhancing your charting workflow.
How to Use:
Add the indicator to your chart.
Configure the settings to suit your trading style:
Adjust the Lookback Period to define how far back the indicator analyzes.
Set the Sensitivity to control how frequently highs and lows are detected.
Use the Label Offset to adjust label placement for better visibility.
Observe the dynamically generated labels highlighting price extremes.
Feel free to tweak or expand this description if you'd like to emphasize other features or include additional instructions. Let me know if there's anything else you'd like to add or adjust! 😊
Levels

Multi Timeframe Market Formation [LuxAlgo]The Multi Timeframe Market Formation tool allows traders to analyze up to 6 different timeframes simultaneously to discover their current formation, S/R levels and their degree of synchronization with the current chart timeframe. Multi timeframe analysis made easy.
🔶 USAGE
By default, the tool displays the chart's timeframe formation plus up to 5 other formations on timeframes higher than the one in the chart.
When the chart formation is synchronized with any enabled timeframe formation, the tool displays labels and a trailing channel, it uses a gradient by default, so the more timeframes are synchronized, the more visible the labels and the trailing channel are.
All timeframes enabled in the settings panel must be higher than the chart timeframe, otherwise the tool will display an error message.
🔹 Formations
A formation is a market structure defined by a lower and an upper boundary (also known as support & resistance).
Each formation has a different symbol and color to identify it at a glance.
It helps traders to know the current market behavior and the tool displays up to 5 of them.
BULLISH (green ▲): higher high and higher low
BEARISH (red ▼): lower high and lower low
CONTRACTION (orange ◀): lower high and higher low
EXPANSION (blue ▶): higher high and lower low
SIDEWAYS (yellow ◀): Any that does not fit with the others
🔹 Multi Timeframe Formations
The tool displays up to 6 different timeframe formations, the chart timeframe plus 5 more configurable from the settings panel.
Each of them has an upper and lower limit, a timeframe, a color and an icon.
If a bound level is shared by more than one formation, the timeframes and symbols are displayed on the same line.
These are significant levels shared by different timeframes and traders need to be aware of them.
🔹 Sync With Chart Timeframe
If the current formation on the chart timeframe is in sync with any of the timeframes enabled in the settings panel, the tool will display this on the chart.
The more timeframes are in sync, the more they are visible, providing a clear visual representation of the common market behavior on multiple timeframes at the same time.
🔶 SETTINGS
Formation size: Size of market formations on the chart timeframe
🔹 Timeframes
TF1 to TF5: Activate/deactivate timeframe, set size of market formation and activate/deactivate high and low levels
🔹 Style
Show Labels: Enable/Disable Timeframe Sync Labels
Transparency Gradient: Enable/Disable Transparency Gradient
Show Trailing Channel | Multiplier: Enable/Disable Trailing Channel and set multiplier
Color for each formation

JJ Psychological Levels (125 Increments)Psychological Levels Indicator
Description:
The Psychological Levels Indicator is a versatile tool designed for traders to identify key price levels that often act as support or resistance zones in the market. These levels are plotted at regular intervals, customizable by the user, starting from a base price level. This is particularly useful for spotting psychological price points that traders and investors frequently monitor.
Key Features:
1.Dynamic Psychological Levels:
- The script calculates and displays horizontal lines at price levels separated by customizable increments (default: 125 points).
- These levels are dynamically adjusted to the visible range of the chart.
2. Customizable Inputs:
- Starting Level: Set the base level from which increments are calculated (e.g., 0 or 1000).
- Step Size: Define the interval between levels (e.g., 125 for indices like Bank NIFTY).
3. Visual Representation:
- Horizontal lines are drawn at each psychological level, helping traders quickly identify key zones.
- Labels are placed next to each level, displaying the corresponding price for easy reference.
4. Application Across Instruments:
- This indicator works seamlessly with various asset classes, including stocks, indices, forex, and cryptocurrencies.
How to Use:
1.Identify Key Price Zones:
- Use the plotted psychological levels to spot areas where price action is likely to react.
- Levels such as 1125, 1250, and 1375 (for a step size of 125) are visually highlighted.
2. Plan Trades Around Key Levels:
- These levels can act as support/resistance or breakout points, providing opportunities for entry, exit, and stop-loss placement.
3. Customizable Settings:
- Adjust the starting level and step size to tailor the indicator to your trading instrument or strategy.
Why Psychological Levels Matter:
Psychological levels are widely followed by traders and often coincide with key market turning points due to their significance in human behavior and market psychology. They are frequently used by institutional traders, making them valuable reference points for intraday and swing trading.
Custom Settings:
- **Starting Level:** Default: `0`
- **Step Size:** Default: `125`
Disclaimer:
This indicator is a technical analysis tool and is not intended to provide financial advice. Always combine it with other indicators and perform your due diligence before making trading decisions.

NPT Levels GeneratorNPT Levels Generator
Description:
The NPT Levels Generator is a custom indicator designed to draw horizontal lines at specific price levels on the chart. It helps traders identify key levels of interest, making it easier to analyze price action and plan trades.
The indicator takes a manually defined Base Price as the central reference point and then generates a series of horizontal lines above and below it at equal intervals. The number of lines and the distance between them are fully customizable through the settings panel.
This tool is particularly useful for identifying support and resistance levels, pivot zones, or any other significant price levels for technical analysis.
Features:
-Customizable Base Price: Define the central level manually.
- Adjustable Line Distance: Set the spacing between each horizontal line.
- Flexible Number of Lines: Choose how many lines to display above and below the base price.
- Custom Line Appearance: Configure the color and thickness of the lines.
This indicator is ideal for traders using price levels as a core part of their strategy, offering flexibility and clarity in visualizing key areas of interest.

DAILY ATR LEVELS AND EXPECTED MOVE LEVELSThis Pine Script code is designed to visualize ATR (Average True Range) levels and expected move levels on a chart. It provides useful inputs for customizing how these levels are displayed, such as line width, style, and color. The script is divided into several sections, each focused on a different feature:
1. User Inputs for Customization:
- Line Width and Style: Users can customize the line width, style (solid, dotted, or dashed), and color for various levels.
- Offset for Line Placement: The rightOffset input controls how far in the future the lines extend (measured in minutes).
- Show Labels: Labels can be toggled on/off for ATR levels and expected move lines, with customizable text colors.
2. ATR Levels and ATR Settings:
- The ATR length (atrLength) and the multiplier (atrMultiplier) control the calculation of ATR levels.
- The script plots ATR levels based on the daily open price, including key levels like ATR +25%, ATR +50%, etc., for both positive and negative movements.
- Line Drawing: The script dynamically creates lines for each ATR level, and the lines are customized according to the user's inputs. For each level, the line.new function is used to plot a line from the start of the day (daily open) to a point offset in the future.
- Labels: Labels are added near each ATR level to make them more identifiable, such as "ATR +25%" or "Daily Open."
3. Expected Move Calculation and Logic:
- The script calculates the expected move for the next trading session based on the previous close price and the volatility derived from the VIX (Volatility Index).
- The expected move is calculated as a percentage of the previous close and is added and subtracted from the previous close price to generate upper and lower levels.
- Volatility Adjustment: The VIX value is adjusted by the square root of 252 (the number of average trading days in a year) to calculate the daily volatility.
- Upper and Lower Lines: Lines are drawn for the expected move's upper and lower bounds, showing the potential price movement based on volatility.
4. Customizable Expected Move Lines:
- Line Style and Color: The upper and lower expected move lines can be customized in terms of width, style, and color, as specified by the user.
- Labels for Expected Move Levels: Labels are added for the upper and lower expected move lines, such as "Expected Move Upper" and "Expected Move Lower."
5. Logic for Drawing Lines:
- The script continuously evaluates whether the levels should be displayed based on the user's preferences.
- If showATRLevels or showLineEM is enabled, the script will draw the respective lines and labels on the chart.
- It uses line.new to draw the lines and label.new to position the labels at the correct levels on the chart.
6. Handling Time and Line Deletion:
- The script handles the dynamic nature of the chart by deleting previous lines (using line.delete) to avoid cluttering the chart with outdated lines.
- The time for the lines is set dynamically using the startTime and endTime variables, ensuring that lines are drawn within the correct timeframe.
Summary of Key Features:
- ATR Levels: Plots key levels of ATR, such as daily open, ATR +25%, ATR -25%, etc., with customizable colors and line styles.
- Expected Move Levels: Calculates and plots the upper and lower bounds of the expected move based on the VIX and previous close price.
- Customization Options: Users can control the appearance (line width, style, color) and whether to show labels for the ATR and expected move levels.
- Dynamic Updates: The lines and labels update dynamically throughout the trading day, adjusting based on market conditions.
Overall, this script is designed to help traders visualize volatility and potential price movement on a daily chart by providing ATR-based levels and expected move projections. It offers a high degree of customization to suit different charting preferences.

Custom Percent Pullback LevelThis script takes a stock's current day low and current day high and lets you set a custom pullback level (line and label on the chart) that you can then set an alert for or use as an indicator if the stock is still bullish or bearish.
Pullbacks can be useful for momentum runners to identify potential continuation. As a rule of thumb many people want to see that stock hold onto at least 33% of it's daily gain to continue a bullish look. Some people may want it to hold 50%, and others may want to see a certain amount of gains held through new highs.
This tool allows you to set a custom pullback level for that day so you can easily spot on the chart if the stock is nearing or falling below those levels. You can also set an alert for that level in order to get your attention.

Liquitive Buy/Sell Dollar AveragerLiquitive Buy/Sell Dollar Averager Indicator
The "Liquitive Buy/Sell Dollar Averager" is a versatile trading tool designed for intraday and multi-timeframe analysis, combining advanced range-bound calculations, RSI normalization, volume spikes, and candle pattern recognition to identify optimal buy and sell conditions. This indicator is particularly suitable for traders employing strategies that focus on dollar-cost averaging, position scaling, and systematic buy/sell decision-making.
Key Features:
Adaptive RSI-Based Levels:
Dynamically calculates inner bounds (IB) and outer bounds (OB) using RSI and price ranges, helping to identify overbought and oversold conditions relative to the price action.
Normalizes RSI values to the price range for seamless visualization overlaid on the chart.
Volume and Candle Analysis:
Detects significant volume spikes relative to a moving average, signaling increased market activity.
Identifies spiking green/red candles to capture momentum-driven price movements.
Dynamic Support and Resistance:
Calculates and plots support and resistance levels based on recent swing highs and lows.
Median and boundary lines help visualize key price levels for decision-making.
Profitability Check:
Buy and Sell Signals:
Checks profitability thresholds based on percentage gains/losses.
Incorporates logic for "time to buy" and "time to sell" using target profit margins.
Implements average move percentage to define realistic thresholds for buy/sell actions.
Time-Based Trading Restrictions:
Configures trading logic to disallow trades after a specific time (e.g., 3:40 PM for intraday sessions).
Ensures logical entry and exit decisions are only made within active trading hours.
Color-Coded Visualization:
Background colors dynamically shift between green (bullish), red (bearish), and neutral, depending on RSI and price position relative to the inner bounds.
Opacity of the background adjusts based on normalized RSI differences to provide a visual cue of market strength.
Customizable Parameters:
Allows user input for key settings like lookback periods, RSI length, percent ranges, volume thresholds, and transparency levels, enabling flexible configuration tailored to individual strategies.
Actionable Alerts and Signals:
Plots "Open Position", "Add to Position", and "Close Position" markers directly on the chart, making it easy to follow systematic trading rules.
How It Works:
Buy Signals:
Triggered when price conditions, volume spikes, and RSI-based thresholds align with profitability metrics.
Designed for dollar-cost averaging, identifying opportunities to add to long positions or open new positions.
Sell Signals:
Evaluates profitability conditions to identify when to close or scale out of positions.
Incorporates real-time evaluation of market momentum and profitability.

Premarket and Opening Range (First 30 minutes) LevelsThis indicator is for people who like to utilize the pre-market highs and pre-market Low's as well as the first 30 minutes high and low, or some people like to call the opening range. I hope you find value in this. Note, the levels will only appear after tracking. Premarket levels will happen after pre-market closes. Opening Range levels will show right after the first 30 minutes.
Multi-Timeframe Liquidity LevelsMulti-Timeframe Liquidity Levels – Overview
The Multi-Timeframe Liquidity Levels indicator automatically displays significant highs and lows from various timeframes (Daily, Weekly, Monthly, and Quarterly) on your current chart. This allows traders to quickly identify potential support and resistance zones without frequently switching between different timeframe charts. Additionally, the script offers extra lines for special reference points (e.g., the “Midnight” midpoint of the current day and the previous day’s open/close) to highlight potential liquidity zones even more clearly.
1. Core Idea and Benefits
Time-Saving: Instead of manually reviewing charts in different timeframes, the indicator fetches relevant high/low levels automatically and shows them on your active timeframe.
Clear Layout: Traders instantly see where the Daily, Weekly, Monthly, and Quarterly highs and lows lie—areas often associated with institutional orders or liquidity hunts.
Customizable: You can tailor the color scheme, line style (Solid, Dashed, Dotted), and line width, ensuring the displayed levels fit your personal charting style.
2. How It Works
Multi-Timeframe High/Low
For each timeframe (Day, Week, Month, Quarter), the indicator references the previous candle’s high and low (high , low ).
Using request.security(...), these values are plotted on the chart you’re currently viewing.
Flexible Display
You can individually enable or disable the Daily, Weekly, Monthly, and Quarterly lines, depending on which levels are most relevant to your trading.
With Line Style (Solid, Dashed, Dotted) and Line Width, you can easily emphasize certain lines you consider more important.
Additional Lines
“Midnight” Line: A theoretical midpoint between today’s high and low, which can be useful for gauging daily pivot areas.
Previous Day’s Open/Close: Many traders track these reference points to anticipate market reactions. You can show or hide these lines as desired.
Automatic Line Removal & Creation
When a particular timeframe (e.g., “Show Monthly Levels”) is disabled, the script automatically removes the existing monthly lines.
Enabling it again recreates those lines without hassle.
3. Usage and Interpretation
Identifying Support and Resistance
Highs and lows from higher timeframes are often key zones for entries, exits, or major market reactions.
A Daily level may be crucial for short-term traders, whereas Monthly or Quarterly levels can indicate long-term liquidity areas.
Spotting Market Shifts
If price decisively moves above a Higher-Timeframe line, it could signal strong momentum.
Conversely, a failed breakout (where price quickly returns under or above a level) might warn of a potential reversal.
Extra Lines as Filters
The “Midnight” Line helps visualize a rough central price for the current day, aiding in intraday directional bias.
Previous Day’s Open/Close: Common reference points for day traders, where swift approaches and rejections can indicate potential entries or partial take-profit zones.
4. Practical Tips
Use Color-Coding Wisely: Assign distinct colors (e.g., Blue for Daily, Green for Weekly, Orange for Monthly, Purple for Quarterly) so you can easily discern which timeframe you’re looking at.
Toggle On/Off As Needed: Day traders might focus on Daily and Weekly, while long-term traders may pay closer attention to Monthly and Quarterly.
Combine with Price Action: Lines alone don’t constitute a trading strategy. Use them alongside candlestick patterns, volume analysis, or other indicators for a more complete market perspective.
5. Important Notes & Recommendations
Not Financial Advice: This indicator simply reflects historical high/low data across multiple timeframes and does not constitute a buy or sell recommendation.
Trader Responsibility: Observe how the market actually behaves around these lines and adapt your risk management accordingly.

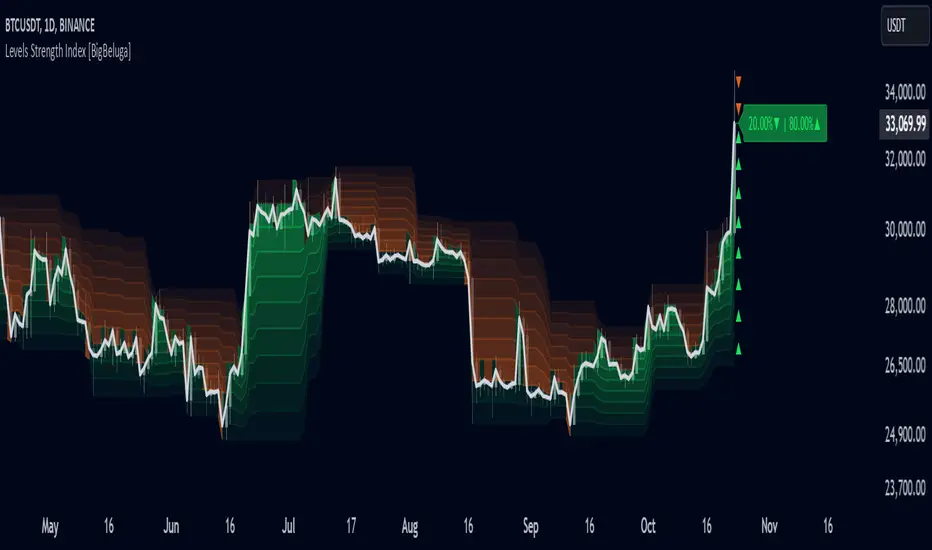
Levels Strength Index [BigBeluga]Levels Strength Index provides a unique perspective on market strength by comparing price positions relative to predefined levels, delivering a dynamic probability-based outlook for potential up and down moves.
🔵 Idea:
The Levels Strength Index analyzes the price position against a series of calculated levels, assigning probabilities for upward and downward movements. These probabilities are displayed in percentage form, providing actionable insights into market momentum and strength. The color-coded display visually reinforces whether the price is predominantly above or below key levels, simplifying trend analysis.
🔵 Key Features:
Dynamic Probability Calculation: The indicator compares the current price position relative to 10 predefined levels, assigning an "Up" and "Down" percentage. For example, if the price is above 8 levels, it will display 80% upward and 20% downward probabilities.
Color-Coded Trend Visualization: When the price is above the majority of levels, the display turns green, signaling strength. Conversely, when below, it shifts to orange, reflecting bearish momentum.
Clear Up/Down Probability Labels: Probabilities are displayed with directional arrows next to the price, instantly showing the likelihood of upward or downward moves.
Probability-Based Price Line: The price line is color-coded based on the probability percentages, allowing a quick glance at the prevailing trend and market strength. This can be toggled in the settings.
Customizable Transparency: Adjust the transparency of the levels to seamlessly integrate the indicator with your preferred chart setup.
Fully Configurable: Control key parameters such as the length of levels and price color mode (trend, neutral, or none) through intuitive settings.
🔵 When to Use:
The Levels Strength Index is ideal for traders looking to:
Identify strong upward or downward market momentum using quantified probabilities.
Visualize price strength relative to key levels with intuitive color coding.
Supplement existing level-based strategies by combining probabilities and market positioning.
Gain instant clarity on potential market moves with percentage-based insights.
Whether you're trading trends or ranges, this tool enhances decision-making by combining level-based analysis with a dynamic probability system, offering a clear, actionable perspective on market behavior.
Support and Resistance Non-Repainting [AlgoAlpha]Elevate your technical analysis with the Non-Repainting Support and Resistance indicator from AlgoAlpha. Designed for traders who value precision, this tool highlights key support and resistance zones without repainting, ensuring reliable signals for better market decisions.
Key Features
🔍 Concise Zones: Identifies critical levels in real-time without repainting.
🖍 Customizable Appearance: Choose your preferred colors for bullish and bearish zones.
📏 Pivot Sensitivity Settings: Adjust the lookback period to fit different market conditions.
🔔 Visual Alerts: Highlights zones on your chart with clear, dynamic boxes and lines.
How to Use
Add the Indicator : Add it to your favorites chart by clicking the star icon. Adjust the lookback period, max zone duration, and colors to match your strategy.
Analyze the Chart : Look for zones where prices frequently react, indicating strong support or resistance.
Set Alerts : Enable notifications for new zone formations and zone invalidations, ensuring you never miss critical market moves.
How It Works
The indicator detects pivot highs and lows using a specified lookback period. When a pivot is confirmed, it draws corresponding support or resistance zones using TradingView’s built-in drawing tools. These zones extend until price breaks through them or they expire based on a maximum allowed duration. The indicator continuously checks if price interacts with any active zones and adjusts accordingly, ensuring accurate and real-time visualization.

Pivot MeterThe "Pivot Meter" is a indicator designed to plot pivot levels (support and resistance) directly on the chart. It offers two types of pivot calculations STANDARD and FIBONACCI, allowing traders to choose their preferred method. Here's an overview of its features and functionalities:
________________________________________
Key Features
1. Pivot Types:
o STANDARD: Traditional calculation based on the previous period's high, low, and close.
o FIBONACCI: Uses Fibonacci ratios to calculate support and resistance levels.
2. Dynamic Time Frame Adjustment:
o The indicator adjusts its calculations based on the chart's timeframe, aligning pivot calculations with appropriate periods.
3. Pivot Levels:
o Resistance Levels (R1 to R5): Five resistance levels calculated based on the selected pivot type.
o Support Levels (S1 to S5): Five support levels corresponding to the pivot type.
o Central Pivot (P): The base pivot level for reference.
4. Visualization:
o All pivot levels are plotted as coloured horizontal bands on the chart for easy identification.
o Colours range from warm tones (red for higher resistance levels) to cool tones (blue for lower support levels).
o Thickness and styling make these levels visually prominent.
5. Real-Time Price Line:
o A dynamically updating line marks the current price, with customizable colour and width for visibility.
6. Labels for Levels:
o Labels are placed next to each pivot level for identification (e.g., R1, S1, Pivot).
o Labels dynamically adjust their position with the chart’s bar progression.
________________________________________
Purpose
This indicator helps traders identify potential reversal points, support and resistance levels, and critical price zones. It is especially useful for:
• Day Traders: Quickly assess key levels for short-term trades.
• Swing Traders: Spot significant support/resistance zones over longer periods.
• Trend Followers: Use pivot levels to confirm breakouts or bounces.
________________________________________
Customization Options
• Pivot Type Selection: Choose between STANDARD and FIBONACCI.
• Price Line Colour: Customize the colour of the current price line for better integration with your chart setup.
________________________________________
Technical Details
• Security Function: Data from higher timeframes is accessed using request.security, ensuring accurate and multi-timeframe pivot calculations.
• Dynamic Labelling: Labels update their positions with every new bar to remain synchronized with the latest data.
________________________________________
Usage
Traders can add this indicator to their TradingView charts to monitor critical levels and strategize entries, exits, and stop-loss placements based on the proximity to these pivots. The dual pivot calculation methods make it versatile for diverse trading styles.
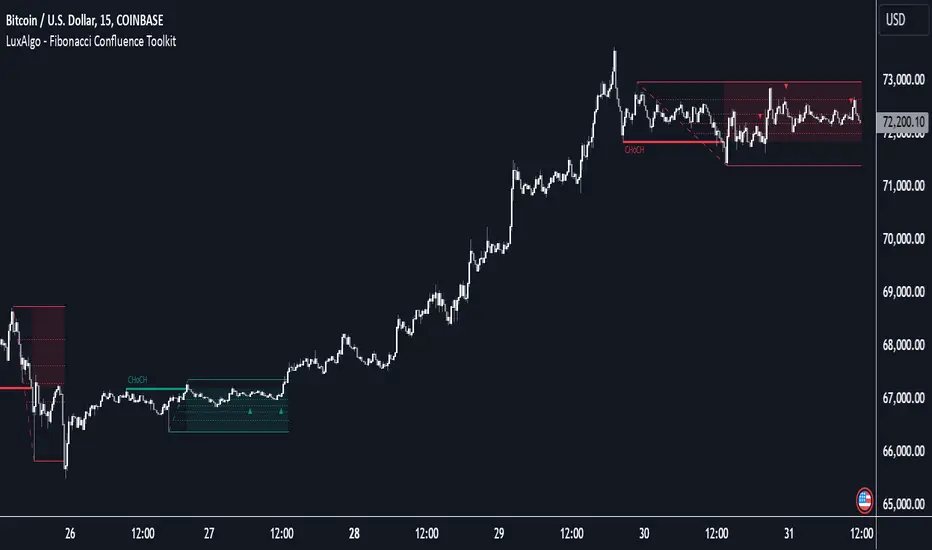
Fibonacci Confluence Toolkit [LuxAlgo]The Fibonacci Confluence Toolkit is a technical analysis tool designed to help traders identify potential price reversal zones by combining key market signals and patterns. It highlights areas of interest where significant price action or reactions are anticipated, automatically applies Fibonacci retracement levels to outline potential pullback zones, and detects engulfing candle patterns.
Its unique strength lies in its reliance solely on price patterns, eliminating the need for user-defined inputs, ensuring a robust and objective analysis of market dynamics.
🔶 USAGE
The script begins by detecting CHoCH (Change of Character) points—key indicators of shifts in market direction. This script integrates the principles of pure price action as applied in Pure-Price-Action-Structures , where further details on the detection process can be found.
The detected CHoCH points serve as the foundation for defining an Area of Interest (AOI), a zone where significant price action or reactions are anticipated.
As new swing highs or lows emerge within the AOI, the tool automatically applies Fibonacci retracement levels to outline potential retracement zones. This setup enables traders to identify areas where price pullbacks may occur, offering actionable insights into potential entries or reversals.
Additionally, the toolkit highlights engulfing candle patterns within these zones, further refining entry points and enhancing confluence for better-informed trading decisions based on real-time trend dynamics and price behavior.
🔶 SETTINGS
🔹 Market Patterns
Bullish Structures: Enable or disable all bullish components of the indicator.
Bearish Structures: Enable or disable all bearish components of the indicator.
Highlight Area of Interest: Toggle the option to highlight the Areas of Interest (enabled or disabled).
CHoCH Line: Choose the line style for the CHoCH (Solid, Dashed, or Dotted).
Width: Adjust the width of the CHoCH line.
🔹 Retracement Levels
Choose which Fibonacci retracement levels to display (e.g., 0, 0.236, 0.382, etc.).
🔹 Swing Levels & Engulfing Patterns
Swing Levels: Select how swing levels are marked (symbols like ◉, △▽, or H/L).
Engulfing Candle Patterns: Choose which engulfing candle patterns to detect (All, Structure-Based, or Disabled).
🔶 RELATED SCRIPTS
Pure-Price-Action-Structures.
Max/Min LevelsHighlights highs and lows that match the search criteria. A high is considered to be broken if the candlestick breaks through its shadow
A three-candlestick pattern will match the parameters:
Candle before - 1
Candle after - 1
A five-candlestick pattern will match the parameters:
Candle before - 2
Candle after - 2
ICTProTools | ICT Insight - Market Environment🚀 INTRODUCTION
The Market Environment Indicator provides traders with an essential contextual framework for analyzing price movements. Built on the principles of ICT (Inner Circle Trader) and Smart Money Concepts (SMC), this tool offers a structured view of how institutional players drive markets through liquidity manipulation and price level interactions. By defining the market environment, the indicator helps traders focus on the most relevant price zones, reducing distractions and enhancing decision-making.
At its core, the Interbank Dealing Range (IBDR) creates a clear structure of protected highs/lows and Premium/Discount zones , highlighting key areas for potential price reactions. This framework gives traders a lens to interpret market behavior and concentrate on meaningful liquidity zones and price action. The indicator helps traders navigate the market with precision, spotting significant opportunities while filtering out market noise. Indeed, the IBDR isn't always easily identifiable, and not every move will form a distinct dealing range.
This indicator goes beyond mere price levels… It reveals the larger market context in which prices evolve. By mastering this environment, traders can align their strategies with institutional logic and make well-informed decisions.
💎 FEATURES
The Interbank Dealing Range (IBDR) is a crucial concept within the ICT methodology that helps traders identify the market environment across multiple timeframes, specifically the premium and discount zones. The IBDR delineates areas where traders have the potential to buy low and sell high.
Its extremes are defined by the sweep of both buy-side and sell-side liquidity . These levels indicate the boundaries within which price is expected to evolve . Understanding these boundaries allows traders to determine where it is appropriate to enter or exit trades.
The primary goal of utilizing the IBDR is to capitalize on price movements by buying at discounted levels and selling at premium levels. This strategy aligns with the fundamental principle of trading: to buy at lower prices and sell at higher prices, maximizing profit potential.
By visualizing the IBDR on your charts, you can gain valuable insights into the prevailing market conditions and make informed trading decisions that align with the institutional approach to buying and selling.
This chart illustrates the Interbank Dealing Range (IBDR) applied to the US100 index, displaying two from different timeframes: a 1-hour (1h) IBDR on the left and a 30-minute (30m) IBDR on the right. This multi-timeframe view provides essential context for price action analysis.
The 1h IBDR could here function as the primary reference range, establishing key boundaries (High and Low) for price movement. Within this range, the Equilibrium (midpoint) separates the Premium zone (above) from the Discount zone (below). The 0.25 and 0.75 levels add further precision by subdividing these zones.
Price action then flows between these zones, creating and targeting liquidity at higher and lower levels through Relative Equal Highs and Lows. A strong upward movement into the deeper level of the Premium Zone captures high-side liquidity (with a notable reaction at the FVG on the left), forming a secondary 30m IBDR. After this liquidity sweep, the remaining liquidity is on the low side. Price then reverses downward toward it. Here, the 30m IBDR would suggest a confirmation for a potential sell entry by targeting the IBDR lows.
The relationship between the broader 1h IBDR, the more detailed 30m IBDR, and all related levels creates a powerful analytical framework. The larger timeframe provides context, while the smaller one reveals specific trading opportunities by providing entry confirmations.
✨ SETTINGS
IBDR Metrics: Adjust the timeframe and sensitivity for calculating the IBDR so traders can adapt the indicator to both short-term intraday movements and longer-term trends.
Premium/Discount Zones: Customize the levels such as 0, 0.5, 1, and other levels like 0.25 and 0.75 by default and their displayed colors and associated labels.
Alerts: Configure the alerts for Premium/Discount zones, High/Low breaks, and new IBDR, ensuring traders are kept up to date on key market events.
🎯 CONCLUSION
The Market Environment indicator serves as a powerful tool for analyzing and navigating market structure through liquidity zones. It helps identify optimal buy and sell areas while aligning with the institutional logic of major market players. While its features provide a valuable edge, it’s essential to remember that none should be used on its own, and many more factors go into being a profitable trader.

Yakloft Support and Resistance LevelsYakloft Support and Resistance Levels Indicator
The Yakloft Support and Resistance Levels indicator is a powerful tool designed to help traders identify key support and resistance levels on a price chart. By leveraging advanced pivot point calculations and customizable settings, this indicator provides clear visual cues for potential price reversals and market trends.
Key Features
Automatic Support and Resistance Levels:
Dynamic Calculation: The indicator automatically identifies and plots significant support and resistance levels based on pivot highs and lows.
Customizable Strength: Adjust the S/R Strength parameter to filter levels according to their significance. Higher values display fewer but more robust levels.
Zones Around Levels:
Support and Resistance Zones: Create zones around each support and resistance level to highlight areas of interest rather than exact price points.
High/Low Zones: Plot zones around the highest and lowest price levels within a specified period, providing additional context for potential breakouts or reversals.
Zone Width Adjustment: Customize the width of the zones using the Zone Width % parameter, calculated as a percentage of the price range over the last 300 bars.
Line Styles and Fills:
Customizable Appearance: Modify line colors, styles (Solid, Dotted, Dashed), and widths to match your chart preferences.
Line Fills: Enhance visual clarity by filling zones with semi-transparent colors, making it easier to distinguish between support and resistance areas.
Dynamic Line Management:
Automatic Line Removal: To keep your chart uncluttered, the indicator removes a support or resistance line after the price crosses it twice. This feature helps you focus on the most relevant and current levels.
Expandable Lines:
Line Extension: Choose to extend lines both forward and backward in time with the Expand S/R Lines option, providing a comprehensive view of historical support and resistance.
How It Works
The indicator analyzes price data to identify pivot highs and lows over a specified lookback period. These pivot points are potential areas where the price may reverse or experience significant support or resistance. By filtering these points based on the S/R Strength parameter, the indicator ensures that only the most significant levels are displayed.
Once the levels are identified:
Support Levels: Plotted when the price shows potential to stop falling and possibly start rising.
Resistance Levels: Plotted when the price may stop rising and potentially start falling.
The indicator enhances these levels by:
Adding Zones: By creating a buffer around each level, traders can see areas where the price might interact with support or resistance, rather than focusing on a single price point.
Line Fills: The zones are filled with a semi-transparent color corresponding to support or resistance, improving visual distinction.
Input Parameters
Enable Support & Resistance: Toggle the entire indicator on or off.
Support Color: Choose the color for support lines and fills.
Resistance Color: Choose the color for resistance lines and fills.
S/R Strength: Set the sensitivity of level detection. Higher values result in fewer, more significant levels.
Line Style: Select the style of the support and resistance lines (Solid, Dotted, Dashed).
S/R Line Width: Adjust the thickness of the support and resistance lines.
Enable Zones: Toggle the display of zones around each level.
Enable High/Low Zones: Toggle the display of zones around the highest and lowest price levels.
Zone Width %: Define the width of the zones as a percentage of the price range over the last 300 bars.
Expand S/R Lines: Choose whether to extend the lines across the entire chart or limit them to recent data.
Using the Indicator
Identifying Key Levels:
Use the plotted support and resistance levels to identify potential entry and exit points.
Pay attention to the zones, as they represent areas where the price is more likely to react.
Monitoring Price Interaction:
Observe how the price behaves around the support and resistance levels.
The automatic removal of lines after two crossings helps focus on active levels.
Customizing for Clarity:
Adjust the visual settings to match your trading style and improve chart readability.
Experiment with the S/R Strength and Zone Width % to fine-tune the indicator to different market conditions.
Best Practices
Combine with Other Analysis Tools:
Use the indicator alongside other technical analysis tools like trend lines, moving averages, and oscillators for a more comprehensive market view.
Adjust for Different Timeframes:
The indicator works on various timeframes. Adjust the parameters when switching between short-term and long-term charts to maintain effectiveness.
Stay Updated with Market Conditions:
Market volatility can affect the significance of support and resistance levels. Regularly adjust the S/R Strength parameter to align with current market dynamics.
Limitations
Not a Standalone Solution:
While the indicator provides valuable insights, it should not be used in isolation. Always consider broader market analysis and risk management practices.
Historical Data Dependency:
The accuracy of the levels depends on the availability of sufficient historical data. Ensure your chart includes enough data for the indicator to perform effectively.

Session RangeThis Pine Script™ code is subject to the terms of the Mozilla Public License 2.0 at mozilla.org
This script plots the high and low price ranges for up to four customizable trading sessions directly on your chart. It is designed to help traders visualize price activity during specific trading hours.
Features
Customizable Sessions: Define up to four distinct trading sessions using the input.session parameter.
Visual Highlights: Each session range is highlighted with customizable colors for top and bottom lines as well as a fill between them.
Historical Ranges: Option to show historical session ranges with adjustable opacity.
Toggle Sessions: Enable or disable the display of specific trading sessions to tailor your analysis.
Overlay on Chart: The script works as an overlay, ensuring your analysis stays on the main chart.
How It Works:
Session Setup: Input the start and end times for each session in the Session 1, Session 2, Session 3, and Session 4 fields.
Dynamic Range Calculation: The script automatically calculates the high and low during active sessions, updating the range as new data comes in.
Customizable Colors: Adjust the colors for lines, fills, and historical ranges to match your charting style.
Clean Presentation: The script is designed to avoid clutter by limiting overlays to active and relevant sessions only.
Identify price action trends during key trading hours.
Compare ranges between multiple sessions for market behavior analysis.
Highlight significant session overlaps or range extensions.
Disclaimer :
This script is intended for educational purposes and should not be considered financial advice. Trading involves risks, and past performance does not guarantee future results.

Support & Resistance AI LevelScopeSupport & Resistance AI LevelScope
Support & Resistance AI LevelScope is an advanced, AI-driven tool that automatically detects and highlights key support and resistance levels on your chart. This indicator leverages smart algorithms to pinpoint the most impactful levels, providing traders with a precise, real-time view of critical price boundaries. Save time and enhance your trading edge with effortless, intelligent support and resistance identification.
Key Features:
AI-Powered Level Detection: The LevelScope algorithm continuously analyzes price action, dynamically plotting support and resistance levels based on recent highs and lows across your chosen timeframe.
Sensitivity Control: Customize the sensitivity to display either major levels for a macro view or more frequent levels for detailed intraday analysis. Easily adjust to suit any trading style or market condition.
Level Strength Differentiation: Instantly recognize the strength of each level with visual cues based on how often price has touched each one. Stronger levels are emphasized, highlighting areas with higher significance, while weaker levels are marked subtly.
Customizable Visuals: Tailor the look of your chart with customizable color schemes and line thickness options for strong and weak levels, ensuring clear visibility without clutter.
Proximity Alerts: Receive alerts when price approaches key support or resistance, giving you a heads-up for potential market reactions and trading opportunities.
Who It’s For:
Whether you're a day trader, swing trader, or just want a quick, AI-driven way to identify high-probability levels on your chart, Support & Resistance AI LevelScope is designed to keep you focused and informed. This indicator is the perfect addition to any trader’s toolkit, empowering you to make more confident, data-backed trading decisions with ease.
Upgrade your analysis with AI-powered support and resistance—no more manual lines, only smart levels!

Fibonacci Buy /Sell SignalsHere is a Fibonacci-based Buy/Sell Indicator using retracement levels for potential support and resistance zones. This indicator plots Fibonacci levels and provides buy/sell signals based on price interaction with these levels.
Fibonacci Levels:
Highest high and lowest low over the lookback period.
Key levels: 38.2% (retracement), 50% (midpoint), 61.8% (strong retracement).
Buy Signal: When the price crosses above the 61.8% Fibonacci level (bullish).
Sell Signal: When the price crosses below the 38.2% Fibonacci level (bearish).

Weekly OHLC LevelsWeekly OHLC Levels Indicator
This indicator plots the previous week's open, high, low, and close (OHLC) levels on the chart for the entire duration of the current week. These levels can be critical for identifying key support and resistance zones, as they often represent psychological levels that traders watch closely.
Features:
Plots previous week’s High (green), Low (red), Open (blue), and Close (purple).
Levels remain visible throughout the current week, providing consistent reference points.
Helps in visualizing how current price action interacts with last week’s important levels.
How to Use:
Use these levels to gauge potential support and resistance areas.
Monitor price reactions around these levels, especially during the beginning of the week, as they can serve as pivot points.
This indicator is suitable for all markets and timeframes, providing valuable insight into price structure relative to weekly market behavior.

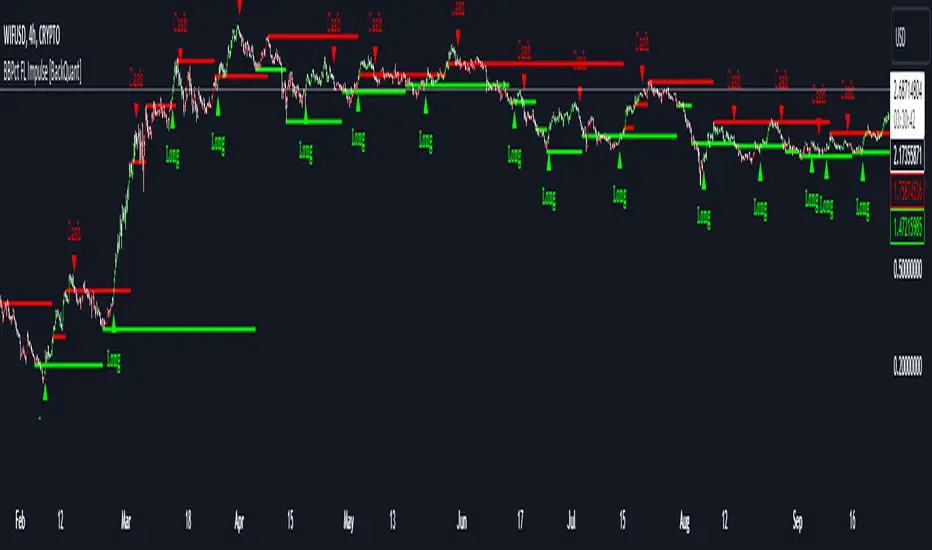
BBPct FL Impulse [BackQuant]BBPct FL Impulse
Introducing BackQuant's BBPct FL Impulse — a powerful and unique trading indicator designed to detect impulse moves and exhaustion points in the market. This leading indicator combines Bollinger Band Percentage (BBPct) calculations with a for-loop system to generate clear long and short signals. Additionally, it plots support and resistance exhaustion levels directly on the chart, providing traders with a visual representation of key market levels.
The BBPct FL Impulse is designed for traders who want to anticipate price movements rather than react to lagging indicators. By utilizing the Bollinger Band Percentage, this indicator identifies moments when the price is pushing toward extremes, signaling the likelihood of impulse moves. It goes a step further by providing exhaustion levels where the market may reverse or pause, helping traders identify potential entries and exits.
Core Concept: Bollinger Band Percentage (BBPct)
The BBPct is the primary calculation driving this indicator. It measures where the price is relative to its Bollinger Bands, allowing traders to gauge overbought or oversold conditions. Bollinger Bands are a well-known tool used to define high and low points based on standard deviation from a moving average. The BBPct takes this one step further by showing how far the price is within the bands, as a percentage.
In this script, the BBPct is calculated using the closing price over a customizable BBPct Length (default set to 70) and a Multiplier that defines the width of the bands based on standard deviation. This helps detect when price pushes toward its upper or lower boundaries, indicating potential breakouts or pullbacks.
For-Loop Scoring Mechanism
The for-loop scoring system adds a layer of sophistication to this indicator. It evaluates the BBPct over a range of periods (defined by the Start and End parameters) and generates a score that measures the direction and strength of the price movement.
Long Signals: A long signal is triggered when the score surpasses the Long Threshold (default set at 40), indicating a strong bullish impulse.
Short Signals: A short signal (labeled as "Cash" in this script) is triggered when the score crosses under the Short Threshold (default set at -10), suggesting the price has lost momentum and a bearish move may be coming.
These signals are highlighted on the chart with green triangles for Long and red triangles for Cash, giving traders clear visual cues for potential buy and sell points.
Key Feature: Exhaustion Levels (Support and Resistance)
One of the standout features of this script is the automatic plotting of Exhaustion Support and Resistance Levels. These levels represent points in the market where the price is likely to exhaust its movement and potentially reverse.
Support is plotted when the price shows signs of bullish exhaustion (low price points).
Resistance is plotted when the price shows signs of bearish exhaustion (high price points).
This dynamic support and resistance system uses a custom function based on price swings, analyzing exhaustion patterns to detect significant levels. The indicator allows traders to visualize key market zones where potential reversals or slowdowns may occur, helping to refine trade entries and exits.
Customization & Visualization
This indicator comes with a range of customizable settings, giving traders full control over how the signals are generated and displayed on the chart:
Calculation Source: Choose the price data used for the BBPct calculation (default is the closing price).
BBPct Length: Set the lookback period for the BBPct calculation, adjusting how smooth or reactive the indicator is to price changes.
Multiplier: Adjust the multiplier for the Bollinger Band calculation, controlling how wide or narrow the bands are and thereby affecting sensitivity.
Thresholds for Signals: Customize the thresholds for long and short signals, allowing you to fine-tune the sensitivity to different market conditions.
Show Long and Cash Signals: Toggle the display of long and short signals on the chart.
Exhaustion Levels: Toggle the display of support and resistance levels, adjusting the length of swings and the thickness of the lines to suit your preferences.
Trading Applications
The BBPct FL Impulse indicator is a versatile tool designed to help traders identify impulse moves and exhaustion points. Some of its key applications include:
Breakout Trading: By using the BBPct to detect when price moves toward the extremes of the Bollinger Bands, traders can anticipate potential breakouts and catch the beginning of strong price moves.
Reversal Trading: The exhaustion support and resistance levels provide key areas where price may reverse, allowing reversal traders to identify potential entries as the market shows signs of exhaustion.
Trend Following: The for-loop scoring system helps quantify the strength of price moves, enabling trend-following traders to stay in winning trades as long as the impulse remains strong.
Risk Management: By providing clear support and resistance levels, the indicator helps traders manage risk more effectively by highlighting zones where price may pause or reverse, allowing for better stop-loss placement.
Final Thoughts
The BBPct FL Impulse is an advanced indicator that combines the precision of Bollinger Band Percentage calculations with the power of a for-loop scoring system and dynamic exhaustion levels. Whether you're looking to trade breakouts, reversals, or trends, this indicator offers the tools to help you make informed decisions in the market.
As always, it's important to backtest the indicator and adapt it to your specific trading style and market. No indicator is infallible, and it should be used as part of a broader trading strategy that includes sound risk management practices.
Chandelier Exit Pro w/ExtensionsChandelier Exit Pro w/Extensions
The Chandelier Exit Pro w/Extensions indicator is designed to assist traders in managing risk and identifying trend reversals. The strategy is based on the Chandelier Exit concept, originally created by Charles Le Beau. It uses the Average True Range (ATR) to calculate dynamic stop levels that adjust based on market volatility. This script not only implements the standard Chandelier Exit, but also introduces extension levels and alerts to enhance decision-making.
Key Features:
➡️Dynamic Stop Levels: The indicator calculates stop levels for both long and short positions based on an ATR multiple. This allows traders to determine exit points by monitoring when the price crosses above or below these levels. These levels adapt in real-time based on price volatility, making them a versatile tool for trend-following strategies.
➡️Extension Levels: In addition to the primary stop levels, the script includes extension levels for more advanced stop-loss management. Traders can view active and extension levels separately, providing more flexibility in their exit strategies.
➡️Labels and Visual Cues: The indicator provides dynamic labels that automatically update and follow the plotted stop levels. Labels include the ATR multiplier value (e.g., "2.5" or "2.5ext"), clearly showing the significance of each level. When price crosses below or above a level, the corresponding label is highlighted, aiding traders in quickly identifying the most relevant stop level.
➡️Bar Confirmation and Alerts: The script includes an "await bar confirmation" option to ensure that the stop levels and alerts only trigger after the bar has closed. Alerts are customizable and will notify traders when price crosses critical levels, helping to make timely decisions without the need to constantly monitor charts.
➡️Multiple ATR Levels for Enhanced Precision: The indicator supports up to four different ATR levels, each with customizable multipliers. This allows traders to set different thresholds for exits based on varying degrees of volatility. For example, Level 1 (2.5x ATR) might represent a tighter stop, while Level 4 (10x ATR) could serve as a wider stop for long-term positions.
➡️Calc_bars_count: Improves efficiency of the indicator by reducing the on-chart calculations in to the past. This input can be found at the bottom of the INPUTS tab.
How it Helps Traders:
💥Trend Identification: By using the Chandelier Exit levels, traders can identify when the trend is likely to reverse. When the price crosses below the stop level in a long trade or above the stop level in a short trade, it signals a potential exit point.
💥Volatility-based Adjustments: Unlike static stop-loss methods, the ATR-based stop levels dynamically adjust based on the market’s volatility. This means tighter stops during low volatility periods and wider stops during high volatility periods, reducing the chance of being stopped out prematurely.
💥Risk Management: The dynamic stop levels and extension levels provide a structured way to manage risk. Traders can set tighter stops for short-term trades and wider stops for longer-term trades. The script's visual labels make it easy to track these levels in real-time.
💥Automation with Alerts: The built-in alert system ensures that traders are notified when key levels are crossed. This helps to avoid emotional decision-making and allows for better execution of trading strategies.
Confluence and Price Fluidity:
One of the powerful ways to enhance the effectiveness of the Chandelier Exit indicator is by using it in conjunction with other technical analysis tools to create confluence. Confluence occurs when multiple indicators or price action signals align, providing stronger confirmation for a trade decision. For example:
🎯Support and Resistance Levels: Traders can use the Chandelier Exit levels in combination with key support and resistance zones. If the price is nearing a support level and the Chandelier Exit signals a bullish reversal, this alignment strengthens the case for entering a long position.
🎯Moving Averages: When the Chandelier Exit signals a trend reversal and this is confirmed by a crossover in moving averages (such as a 50-day and 200-day moving average), traders gain additional confidence in the trade direction.
🎯Momentum Indicators: Traders can also look for momentum indicators like RSI or MACD to confirm the strength of a trend or potential reversal. For instance, if the Chandelier Exit triggers a short signal and the RSI also shows overbought conditions, this could provide stronger confirmation to exit a long trade or enter a short position.
🎯Candlestick Patterns: Price fluidity can be monitored using candlestick formations. For example, a bearish engulfing pattern near a Chandelier Exit resistance level offers confluence, adding confidence to the signal to close or short the trade.
By combining the Chandelier Exit with other tools, traders ensure that they are not relying on a single indicator. This layered approach can reduce the likelihood of false signals and improve overall trading accuracy.
Practical Use Case:
Imagine a trader enters a long position, and the price moves favorably. Using the Chandelier Exit, the trader sets the initial stop level at 2.5x ATR below the highest close. As the price continues to rise, the stop level follows the price, locking in profits. If the market suddenly turns, the price crossing below the stop level signals an exit, helping the trader preserve gains. With extension levels, the trader can further refine exits, adjusting based on their risk tolerance and market conditions.
Good luck and I hope that you can find a place in your tool bag to use this dynamic indicator 🙏

Liquidity Pools [LuxAlgo]The Liquidity Pools indicator identifies and displays estimated liquidity pools on the chart by analyzing high and low wicked price areas, along with the amount, and frequency of visits to each zone.
🔶 USAGE
Liquidity Pools are areas where smaller participants are likely to place stop-limit orders to manage risks at reasonable swing points. These zones attract institutional traders who use the pending orders as liquidity to enter larger positions, aiming to influence price movements. By monitoring these zones, traders can anticipate market movements and potentially benefit from these dynamics.
Beyond general liquidity theory, identifying zones consistently visited by price aids in using them as support and resistance zones. By analyzing these areas, we can assess how effectively participants enter or exit these zones, helping to gauge their importance.
In the screenshots below, we will explore both sides of the same chart in more detail to display how each zone could be viewed from a bullish and bearish perspective.
Bullish Zones Example:
Bearish Zones Example:
🔶 DETAILS
The method behind this indicator focuses on identifying a swing point and tracking future interactions with it. It adaptively identifies high and low "potential zones". These zones are monitored over time; if a zone meets the user-defined criteria, the script marks and displays these zones on the chart.
🔹 Identification
The method to identify Liquidity Pools in this indicator revolves around 3 main parameters. By utilizing these settings, the indicator can be tailored to produce zones that fit the specific strategic needs of each trader.
Zone Identification Parameters
Zone Contact Amount: This setting determines the number of times each zone must be in contact with the price (and bought or sold out of) before being identified by the indicator as a Liquidity Pool.
For example: When a zone is first displayed, it is considered as having been reached 1 time. When the zone is re-tested for the first time, this is considered the 2nd contact, since the price has seen the zone a total of 2 times.
Bars Required Between Each Contact: This is used to rule out (or in) consecutive candles reaching each zone from the calculation, adding a separation length between zone contact points to refine the zones produced.
For example: When set to "2", the first contact point (first re-test) will be ignored by the script if it is not at least 2 bars away from the initial zone proposal point.
Confirmation Bars: After a zone has reached the desired Contact Amount, this setting will cause the script to wait a specified number of bars before identifying a zone. While this might initially seem counterintuitive, by waiting, we are able to watch the market's reaction to the proposed zone and respond accordingly. If the price were to continue through the potential liquidity zone Immediately, it would not be logical to consider this area as a valid Liquidity Pool.
Displayed in this screenshot, you will see the specific points we are looking for in order to identify these zones.
🔹 Display
After a Liquidity Pool is identified, its boundary line is extended to the current price to keep it in view for reference. This extension will continue until the zone is mitigated (price has closed above or below the zone), after which it will stop extending.
Candles can optionally be colored when returning to the most recent Liquidity Pool if it is still unmitigated, and will only color after the zone is displayed on the chart. Because of this, if a candle is colored within a zone, then its color comes from being inside a previously unmitigated zone.
🔹 Volume
Each time a candle overlaps an Unmitigated Zone, a percentage of its volume will be accumulated to the total for each specific zone. The volume total is displayed on the right end of the extended boundary lines.
This volume data could help to determine the importance of specific zones based on the amount of volume traded within.
Note: This volume is fractional to the percentage of candles that are contained within the zone. If a candle is 50% within a zone, The zone will receive 50% of the candle's volume added to its current total.
🔶 SETTINGS
See above for a more detailed explanation of the "Zone Identification" parameters.
Zone Contact Amount: The number of times the price must bounce from this zone before considering it as a liquidity pool.
Bars Required Between Each Contact: The number of bars to wait before checking for another zone contact.
Confirmation Bars: The number of bars to wait before identifying a zone to confirm validity.
Display Volume Labels: Toggles the display for the volume readout for each Liquidity Pool.
Fill Candles Inside Zones: Toggles the display of colored candles within Liquidity Pools.