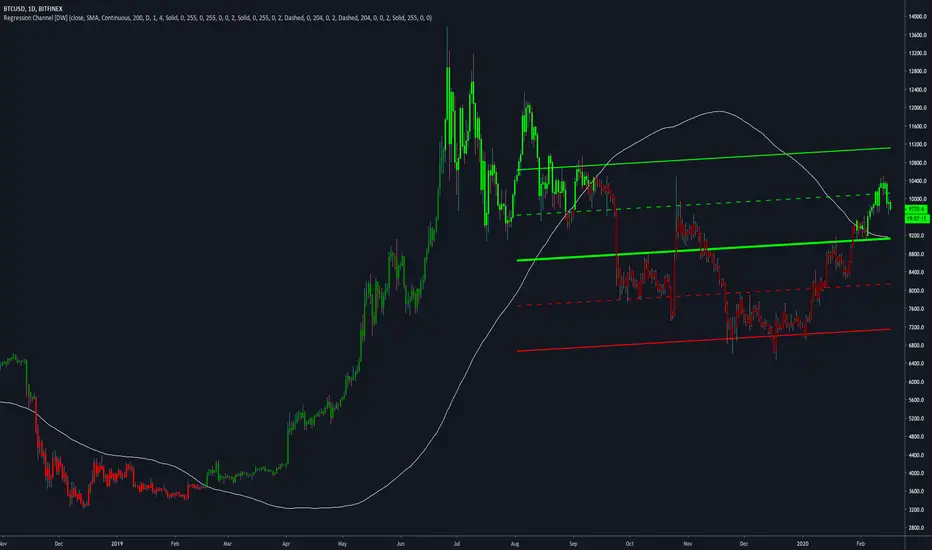
Regression Channel [DW]This is an experimental study which calculates a linear regression channel over a specified period or interval using custom moving average types for its calculations.
Linear regression is a linear approach to modeling the relationship between a dependent variable and one or more independent variables.
In linear regression, the relationships are modeled using linear predictor functions whose unknown model parameters are estimated from the data.
The regression channel in this study is modeled using the least squares approach with four base average types to choose from:
-> Arnaud Legoux Moving Average (ALMA)
-> Exponential Moving Average (EMA)
-> Simple Moving Average (SMA)
-> Volume Weighted Moving Average (VWMA)
When using VWMA, if no volume is present, the calculation will automatically switch to tick volume, making it compatible with any cryptocurrency, stock, currency pair, or index you want to analyze.
There are two window types for calculation in this script as well:
-> Continuous, which generates a regression model over a fixed number of bars continuously.
-> Interval, which generates a regression model that only moves its starting point when a new interval starts. The number of bars for calculation cumulatively increases until the end of the interval.
The channel is generated by calculating standard deviation multiplied by the channel width coefficient, adding it to and subtracting it from the regression line, then dividing it into quartiles.
To observe the path of the regression, I've included a tracer line, which follows the current point of the regression line. This is also referred to as a Least Squares Moving Average (LSMA).
For added predictive capability, there is an option to extend the channel lines into the future.
A custom bar color scheme based on channel direction and price proximity to the current regression value is included.
I don't necessarily recommend using this tool as a standalone, but rather as a supplement to your analysis systems.
Regression analysis is far from an exact science. However, with the right combination of tools and strategies in place, it can greatly enhance your analysis and trading.
Regresi Linear
Function : Linear Regression Bands
Used with Pearson Correlation. It can be used to make sense of the trends. Very successful results can be obtained with a MACD style indicator and volume indicator that gives Buy and Sell orders.Open for adaptive and mutable variable periods of moving averages. Best regards!

Auto Trend Channel [Anan]Hello Friends..
This is Auto Trend Channel using linear regression ,,
So helpful and smart !
Play with the options to adjust the precision.
*Note that the selected time frame in options must be > your current time frame (logic) to draw lines.

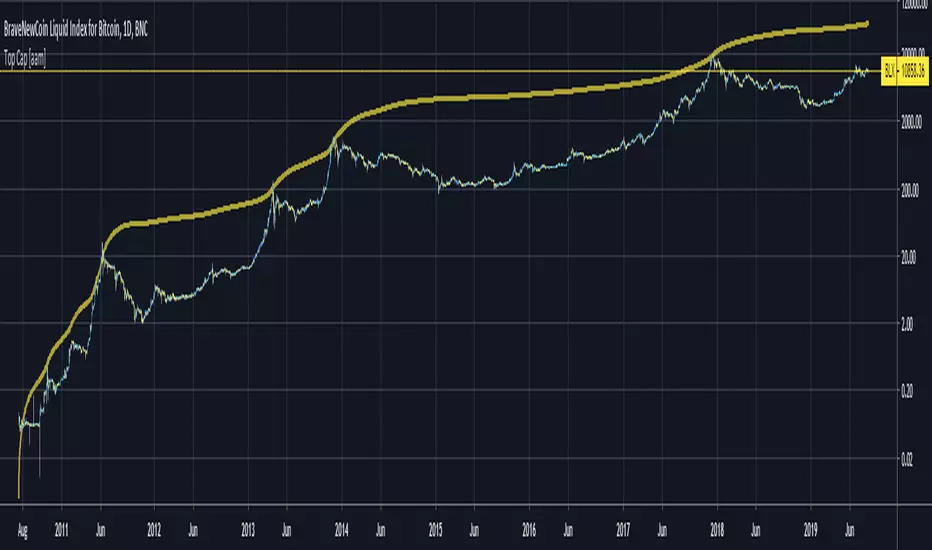
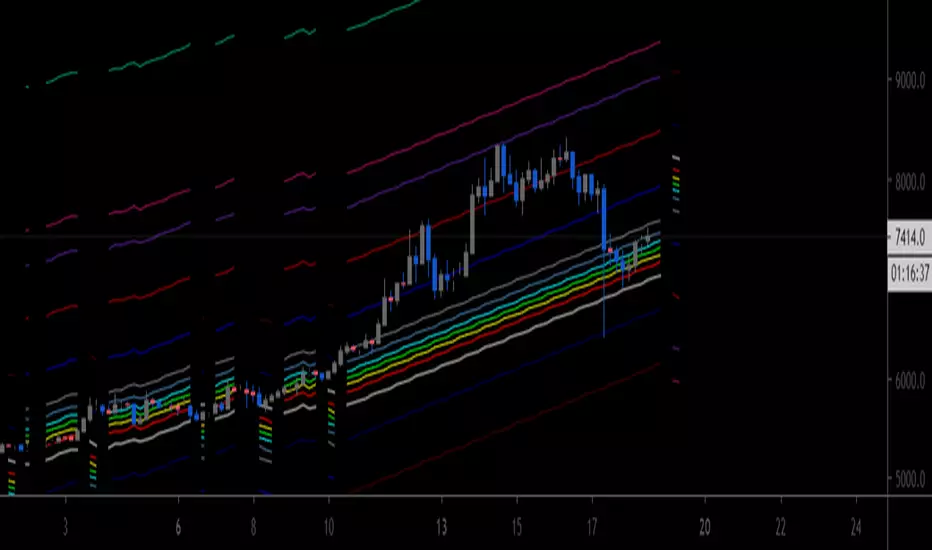
Top Cap [aamonkey]Historically matched market tops for BTC.
It's the Average Cap (see my other indicator) multiplied by 35.
The default settings are for BTC.
If you want to test this indicator on another chart you have to change the launch date settings (and maybe play around with the multiplier).
Some Interesting Launch dates:
- BTC: 3 JAN 2009
- ETH: 30. JUL 2015
- LTC: 7. OCT 2011
LTIThis is a customised indicator which assists us to easily identify strong linear bullish or bearish trends. It gives us the opportunity to enter only the strongest looking trends which results in potentially faster profits.

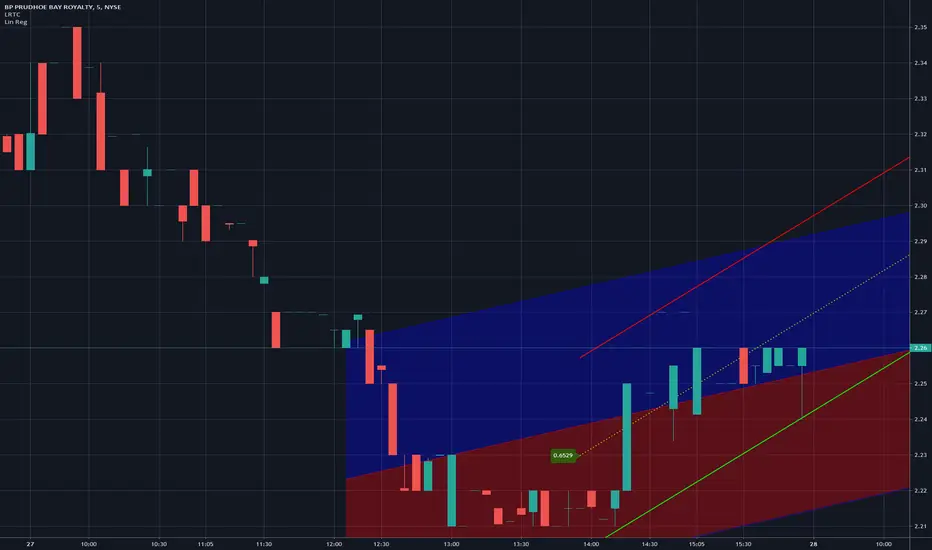
Linear Regression Trend ChannelThis is my first public release of indicator code and my PSv4.0 version of "Linear Regression Channel", as it is more commonly known. It replicates TV's built-in "Linear Regression" without the distraction of heavy red/blue fill bleeding into other indicators. We can't fill() line.new() at this time in Pine Script anyways. I entitled it Linear Regression Trend Channel, simply because it seems more accurate as a proper description. I nicely packaged this to the size of an ordinary napkin within 20 lines of compact code, simplifying the math to the most efficient script I could devise that fits in your pocket. This is commonly what my dense intricate code looks like behind the veil, and if you are wondering why there is no notes, that's because the notation is in the variable naming. I excluded Pearson correlation because it doesn't seem very useful to me, and it would comprise of additional lines of code I would rather avoid in this public release. Pearson correlation is included in my invite-only advanced version of "Enhanced Linear Regression Trend Channel", where I have taken Linear Regression Channeling to another level of fully featured novel attainability using this original source code.
Features List Includes:
"Period" adjustment
"Deviation(s)" adjustment
"Extend Method" option to extend or not extend the upper, medial, and lower channeling
Showcased in the chart below is my free to use "Enhanced Schaff Trend Cycle Indicator", having a common appeal to TV users frequently. If you do have any questions or comments regarding this indicator, I will consider your inquiries, thoughts, and ideas presented below in the comments section, when time provides it. As always, "Like" it if you simply just like it with a proper thumbs up, and also return to my scripts list occasionally for additional postings. Have a profitable future everyone!
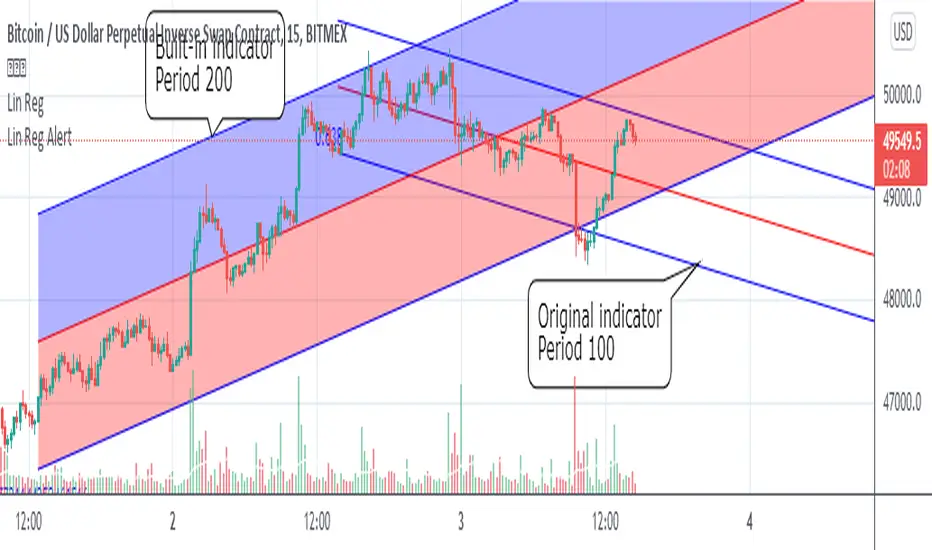
Enhanced Linear Regression Trend ChannelThis is my PSv4.0 enhanced version of "Linear Regression Channel", as it is more commonly known. I entitled it Enhanced Linear Regression Trend Channel, simply because it seems more accurate as a proper description. However, this is actually a dual linear regression channel all-in-one Swiss army knife, nicely packaged within 104 lines of code. The primary one tracks in real-time, while the secondary, with an enabled "time warp" setting, is displayed monitoring the linear regression channel in the past for comparison, providing fully adjustable tandem tracking capabilities. It seemed like a superb novel idea to me to add this capability for super analytical approaches. The Pearson correlation displays in the rear middle of the primary linear regression trend channel. I did this because during a steep uptrend zoomed in, it often moves off the chart being placed on the bottom and is no longer visible for a while. Additionally, for the second time, I am releasing my "Neon Source" plot feature in a bright stunning yellow corona. Charts these days have so many plots on them, so I devised a unique way to resolve any confusion by emulating neon light. You may still easily use candles with this neon line too, or just simply disable it if you wish.
Features List Includes:
Enable/disable dark background for enhanced visibility
Dual "Source" selections
Dual "Period" adjustments
Dual "Deviation(s)" adjustments
Dual "Time Warp" adjustments
Dual selectable line extension method
"Pearson Correlation" color change selection for enhancing visual acuity amongst other indicators
Secondary "Linear Regression Trend Channel" time warped with enable/disable capability
"Neon Source" has a brightness control with an enable/disable capability
This is not a freely available indicator, FYI. To witness my Pine poetry in action, properly negotiated requests for unlimited access, per indicator, may ONLY be obtained by direct contact with me using TV's "Private Chats" or by "Message" hidden in my member name above. The comments section below is solely just for commenting and other remarks, ideas, compliments, etc... regarding only this indicator, not others. If you do have any questions or comments regarding this indicator, I will consider your inquiries, thoughts, and ideas presented below in the comments section, when time provides it. When my indicators achieve more prevalent use by TV members, I will implement more ideas when they present themselves as worthy additions. As always, "Like" it if you simply just like it, and also return to my scripts list occasionally for additional postings. Have a profitable future everyone!

Linear Regression Channel CloneClone of tradingview Linear Regression Channel
Honorable Mentions:
jwammo12 for the Deviation code
ballofpaper for making me write it.
Time Series ForecastIntroduction
Forecasting is a blurry science that deal with lot of uncertainty. Most of the time forecasting is made with the assumption that past values can be used to forecast a time series, the accuracy of the forecast depend on the type of time series, the pre-processing applied to it, the forecast model and the parameters of the model.
In tradingview we don't have much forecasting models appart from the linear regression which is definitely not adapted to forecast financial markets, instead we mainly use it as support/resistance indicator. So i wanted to try making a forecasting tool based on the lsma that might provide something at least interesting, i hope you find an use to it.
The Method
Remember that the regression model and the lsma are closely related, both share the same equation ax + b but the lsma will use running parameters while a and b are constants in a linear regression, the last point of the lsma of period p is the last point of the linear regression that fit a line to the price at time p to 1, try to add a linear regression with count = 100 and an lsma of length = 100 and you will see, this is why the lsma is also called "end point moving average".
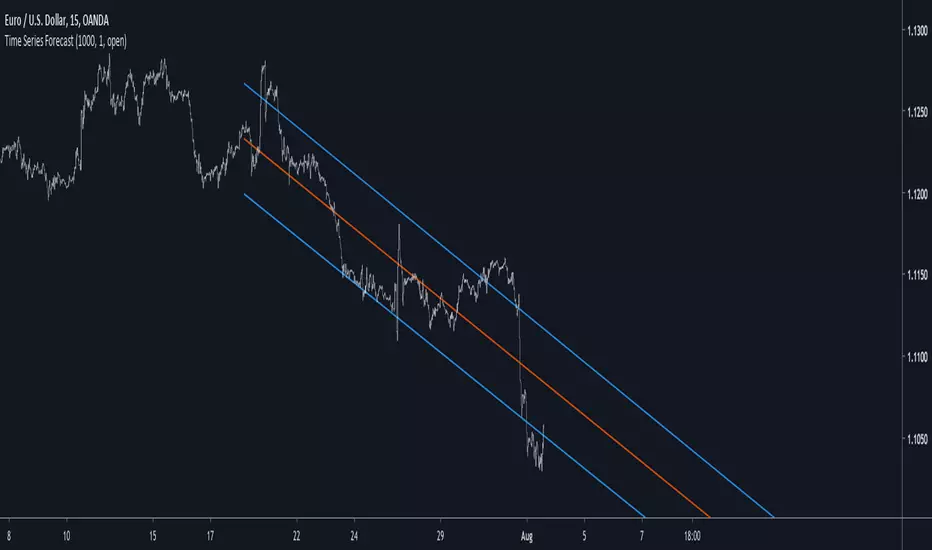
The forecast of the linear regression is the linear extrapolation of the fitted line, however the proposed indicator forecast is the linear extrapolation between the value of the lsma at time length and the last value of the lsma when short term extrapolation is false, when short term extrapolation is checked the forecast is the linear extrapolation between the lsma value prior to the last point and the last lsma value.
long term extrapolation, length = 1000
short term extrapolation, length = 1000
How To Use
Intervals are create from the running mean absolute error between the price and the lsma. Those intervals can be interpreted as possible support and resistance levels when using long term extrapolation, make sure that the intervals have been priorly tested, this mean the intervals are more significants.
The short term extrapolation is made with the assumption that the price will follow the last two lsma points direction, the forecast tend to become inaccurate during a trend change or when noise affect heavily the lsma.
You can test both method accuracy with the replay mode.
Comparison With The Linear Regression
Both methods share similitudes, but they have different results, lets compare them.
In blue the indicator and in red a linear regression of both period 200, the linear regression is always extremely conservative since she fit a line using the least squares method, at the contrary the indicator is less conservative which can be an advantage as well as a problem.
Conclusion
Linear models are good when what we want to forecast is approximately linear, thats not the case with market price and this is why other methods are used. But the use of the lsma to provide a forecast is still an interesting method that might require further studies.
Thanks for reading !
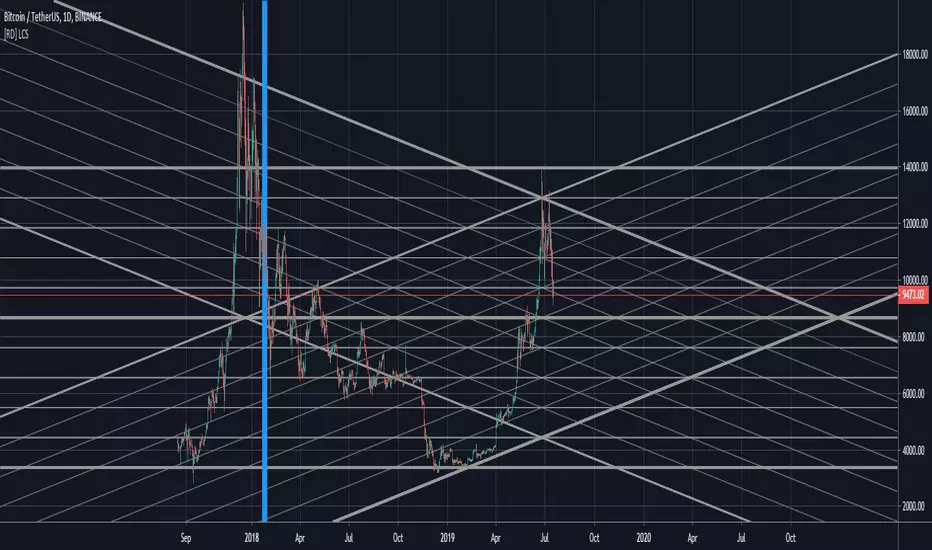
[RD] LCS - line channels (basic) v3 - [republish]==================================================================
July 18 2019 - LCS - line channels (basic) by RootDuk
Version : v3 - read the notes
==================================================================
Easy script to draw channels based on ie. GANN using the following
input params
- ibback : barsback to search for high and low
- ffactor : factor to up/downscale the lines
- oextend : extend lines, left, right, both, none
- bshowline : show horizontal lines yes/no
- bsshowdown : show diag down lines yes/no
- bsshowup : show diag up lines yes/no
- bshowindm : show index marker, where is you current ibback
===================================================================
Notes
===================================================================
When you use this code, pls let me know where and how you used it
as iam always curious what some can do with it. Thanks!
===================================================================
Updates
===================================================================
v1
v2 - July 17 2019
- Removed support wallets from source code. I think the source
- has been deleted because of this, find no other clue.
v3 - July 18 2019
- Republish

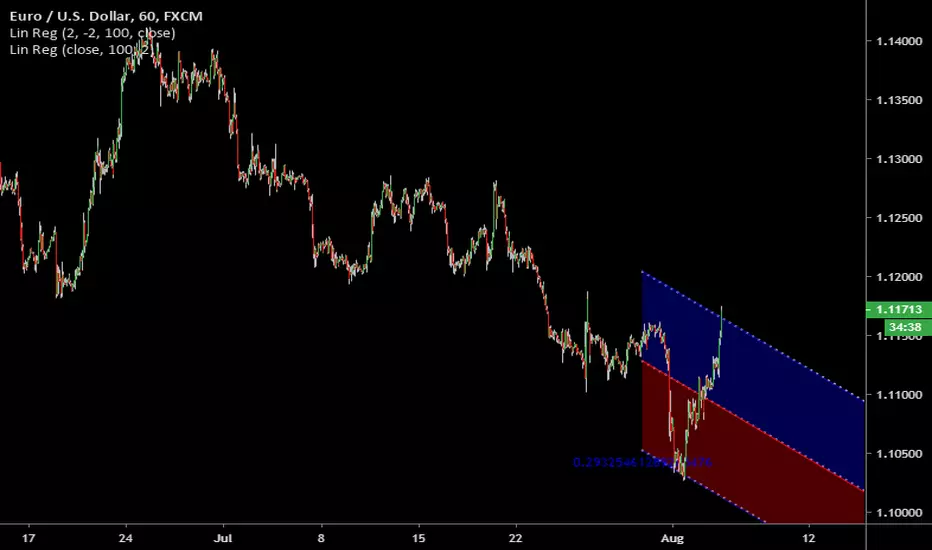
Linear Regression Channel with AlertNote: I use Google Translate.
Added alert function to "Linear regression" of built-in indicator.
I use Pine script version 4.
The basic behavior is the same as the built-in indicator,
The following points are different.
1. Fills between line objects are only lines because they do not correspond in Version 4.
2. The "Use Deviation" switch can not be reproduced, so it is displayed or hidden.
3. Line color and line width can not be changed.
4. You can use 3 types of alerts: "upper and lower channel line", "center line" and "all lines".
I get a warning of repainting, but I think there is no problem.
Please contact me if there is something wrong.
内臓インジケーターの「線形回帰」にアラート機能を追加しました。
Pineスクリプト Version4を使用しています。
基本的な挙動は内臓インジケーターと変わりませんが、
以下の点が異なります。
1.ラインオブジェクト間の塗りつぶしは、Version4で対応していないようなので線のみです。
2.「偏差を使う」の切り替えは再現できていないので、表示か非表示かになっています。
3.線色、線の太さの変更はできません。
4.「上下のチャネルライン」、「センターライン」、「すべてのライン」の3種類のアラートを使うことができます。
リペイントのWarningが出ますが、特に問題ないと思います。
何か問題があればご連絡ください。
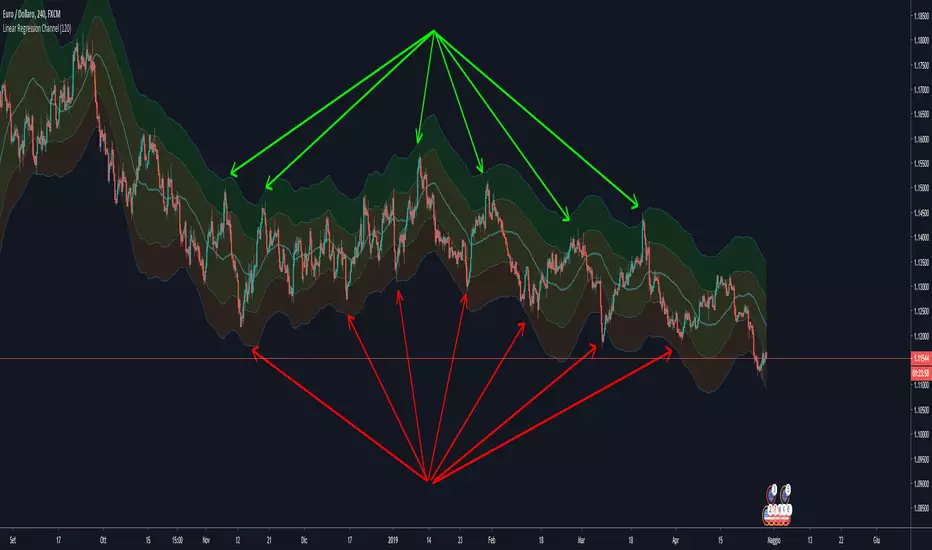
linear and Bollingers Bands and Fibonacci ratios This model give us the following
1 .linear regression channel
2.dynamic upper and lower fibs
3. upper and lower bollinger bands
each specific to the time frame that you use
So by using all 3 in one indicator it easy to see ressistance and support level


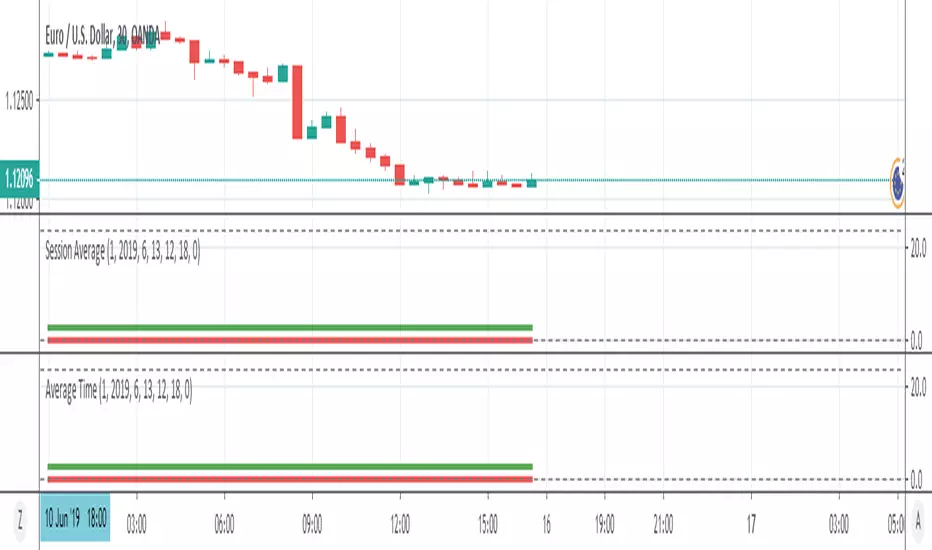
Session AverageThis indicator finds the average time of High or Low formed in sessions.
This is a request from trader @Salmanmahmood15 . You need permission from him to fully use it
Slices of Bitcoin
A very simple indicator that shows how many times a currency fits into Bitcoin. In other words, the higher the value, the weaker the currency against Bitcoin.
You can easily see that since the beginning of 2019 Stellar Lumen (XLM) lost half of its BTC-value while the USD-value was constant.

[AU] Fibonacci Fractal Regression ChannelFibonacci Fractal Regression Channel v01
Based upon:
Fractal Regression Channel V0 () by @RicardoSantos
Note: For use on 4H charts and lower intervals/timeframes
Fractal Regression Channel V0.1Port of @RicardoSantos' Fractal Regression Channel V0 from pinescript 2 to pinescript 3.
// Source:
// Original Author: @RicardoSantos

BB Forecast PrototypeExperiment to try apply @atrader2's MA Forecast () to bollinger bands - didn't exactly work out how I expected it to, especially with the Upper/Lower forecast projections.


Sniper & Strategy SniperTrading permite detectar los momentos exactos de compra y venta obteniendo un buen rendimiento.
Como aplicarlo:
* Realice una compra cuando el indicador de COMPRA aparezca en la pantalla.
* Realice una venta cuando el indicador de VENTA aparezca en la pantalla.

linear regression channelThe linear regression indicator is used for trend identification and trend following in a similar fashion to moving averages.
Best time frames to use the indicator: H1/H4
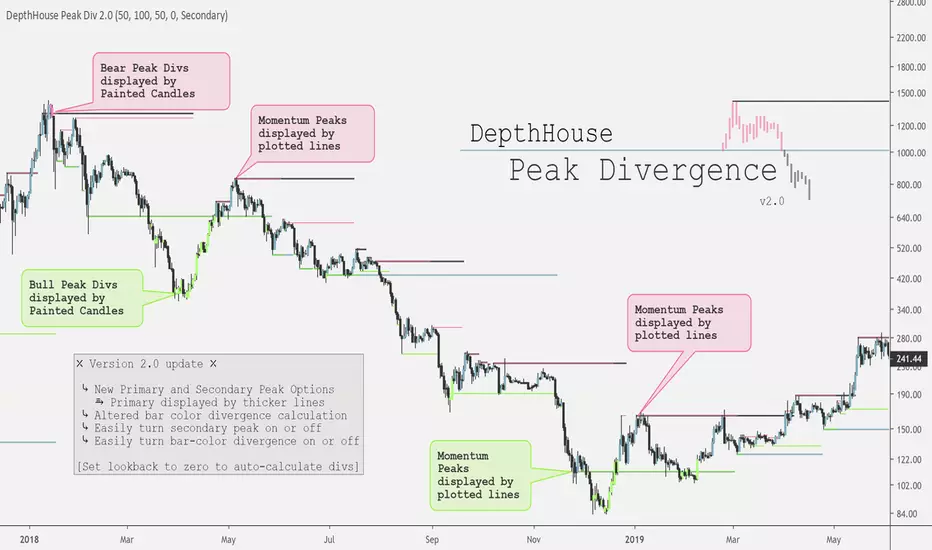
DepthHouse - Peak DivergenceDepthHouse - Peak Divergence indicator uses the same linear regression calculation as my Peak Momentum Oscillator to help determine and plot peak momentum points.
These peak levels are then plotted by either red or green lines above or below the candle.
Red lines represent a peak in bear momentum while green represents peaks in bull momentum.
These levels are then used to determine momentum divergence in the displayed market.
If divergence is present the bars colors will change represent either bull or bear div.
Important Notes:
If the price crosses a peak line and the bar color does not change; it means momentum has increased/decreased with the price and the divergence has been canceled.
If divergence is present, and then the following candle is not colored then momentum has increased to cancel the previously present divergence.
By default, the look-back period is set to zero , which automatically calculates the distance for the peak levels to look-back. However this number can be set to whatever look-back period you would like.
At time of release this indicator is in its early stages. So please leave feedback on how it can be improved!