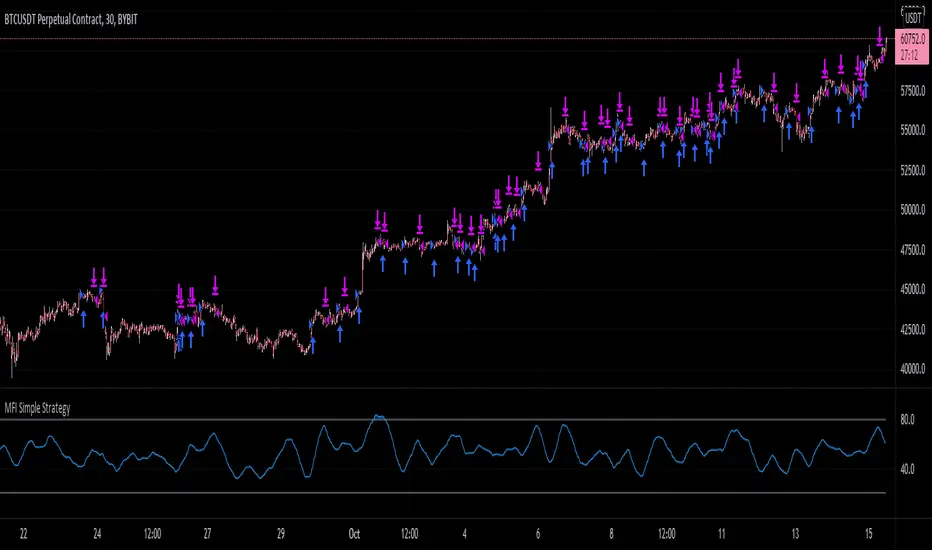
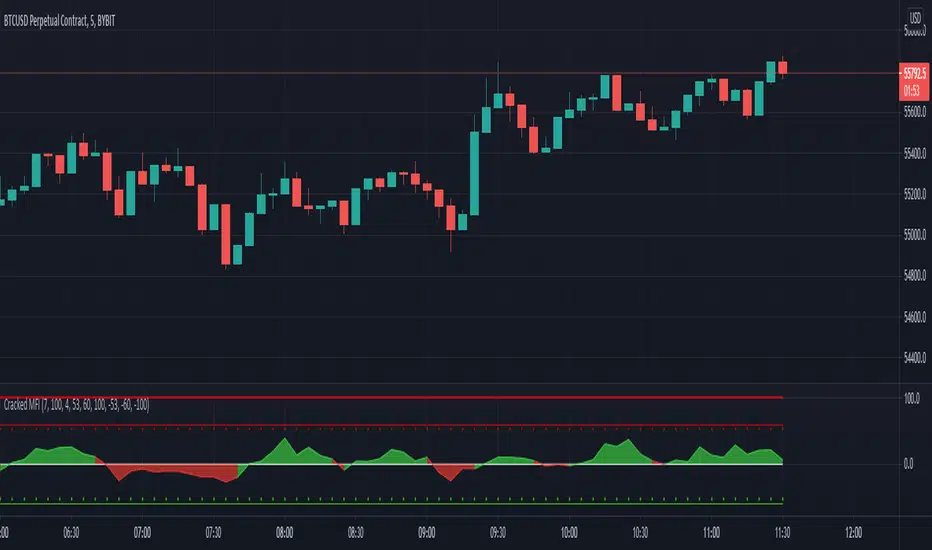
Money Flow Index (MFI)
RedK_AvgMoneyFlow Oscillator v1This is a compact & simple study that tracks the short-term average price change and the (average) volume associated with it, to generate a very clear signal when a change of buying/selling flow is detected. these buy/sell cycles can happen within a longer "demand / trend-up" or "supply / trend down" phases as we know.
this concept is a bit different from MFI or CMF. The math we use here is simpler, and more "relative" and short-term focused, deliberately.
how does it work
===============
once the average price change and the average volumes are calculated for the specified length, we then turn that into a +100/-100 oscillator format - using the stoch() function - which helps to generate a clearly identifiable unambiguous signal (crossing the zero line up or down) that help traders (mainly with entries)
-- the stoch() function also makes the oscillator "relative" to the specified period length, meaning, we can be in a uptrend (demand mode) and the MFO is showing flow "out" (negative) - that's specific to the short-term period - and that's exactly what i was trying to see
- the thinking here is that the best spot to go long is when the existing selling has been depleted and no more supply exists (during an uptrend), and vice verca.
- other stuff: i use WMA() throughout the script -- and we apply a smoothing for the final plot. keep smoothing to a minimum to avoid unnecessary lag in the signals
- the signal should be considered *after* a bar is fully closed.
Suggested Use
==============
i suggest you use this in combination with other indicators that can show the overall short-term and long-term bias (for example, i use the Ribbon here for that) - and take only entry signals in the same direction - a signal to go long, for example, would be when the bias / trend is up *and* the MFO crosses the zero line *going up* .. you may need to wait for that setup to show before you hit the trigger.
another benefit here, is that MFO will also detect strengths and weaknesses - when we see diversion with price movement. this shows couple of times in the example below
Please Note
============
i do not do short-term trading / scalping - those who do, i hope may find this useful - if you decide to use it and you do find it useful, please post feedback here for the common learning
Good luck!
CCU MFI + RSI + STOCH RSIThis demonstrates the accuracy of entry signal of the MFI + RSI + STOCH RSI strategy
Stoch.RSI+RSI+MFI+CM_Williams_Vix_Fix_V3An update of my previous code "Stoch.RSI+RSI+DoubleStrategy+CMWilliamsVixFix+MFI".
Updates:
- Script converted to v4 and to study version
- Removed the "Double strategy" code because it doesn't work much well
- Replaced the "CM_Williams_Vix_Fix" (by ChrisMoody) code with its updated version "CM_Williams_Vix_Fix_V3" that also features custom filtered alerts directly onto candlesticks (don't forget to check its author's profile)
- Other minor graphical adjustments
The MFI Directive: B-RiskThe MFI Directive: B-Risk is an invite only indicator that is based on the Money Flow Index but disregards the bias of green and red. Therefore allowing you to make the correct decisions of shorting the top of the money flow and longing the bottom. Specialized shaded zones have been added to showcase possible better areas of interest within the outlined Money Flow. Additional zones have been added, however they come with significantly more risk. With more risk comes more opportunities and/or reward. Now with the right thinking cap on your head, you can achieve possible better entries on each trade long or short, with The MFI Directive: B-Risk.
If you want to gain access to The MFI Directive: B-Risk, please message me using the discord contact below or PM me on TradingView for how to obtain access. Thank you.
The MFI Directive V2The MFI Directive is a protected indicator that is based on the Money Flow Index but disregards the bias of green and red. Therefore allowing you to make the correct decisions of shorting the top of the money flow and longing the bottom. Specialized shaded zones have been added to showcase possible better areas of interest within the outlined Money Flow . Now with the right thinking cap on your head, you can achieve possible better entries on each trade long or short, with The MFI Directive V2.
If you want to gain access to The MFI Directive V2, please message me using the discord contact below or PM me on TradingView for how to obtain access. Thank you.
MFI SMA CrossA simple cross strategy. Designed to help you enter at starts of trends and exit and short when it reverses.
This script works well for ETFs and trending stocks. It does decent on the hourly chart.
Tested on QQQ, SPY, VTI, BAC, GE.
SpiralGrinder Ultimate Trading System SpiralGrinder Ultimate Trading System
SpiralGrinder Ultimate (SGU) is a unique type of Trading System dedicated for leverage-trading BTC on Bitmex platform. Since it's highly customized to give statistically reliable signals based exclusively on BTC/USD Perpetual Swaps BITMEX chart BITMEX:XBTUSD , using it with other BTC charts will give usable, but less reliable signals!
SpiralGrinder’s Ultimate first iteration was SpiralSwinger V1 indicator released in march 2019, since then much has been changed, different algos were developed and then thrown into the bin, until after 6 months of intensive work current version was developed, backtested on XBT/USD Perpetual Inverse Swap Contract chart from Bitmex exchange on whole chart history from late 2015 until January 2020, on these timeframes – 1d, 12h, 8h, 6h, 4h, 3h, 2h, 90m, 1h.
Indicator algo is based on idea of price being a so called "fractal" - when same price action patterns occur over and over from time to time on different timeframes be it 1D, 4h, 1h or even 15m! Every time a particular timeframe (TF) has suitable volatility and price action is exhibiting wave structure with distinct highs and lows there will be a situations when high probability trade setups are possible. To predict those recurrent situations SGU tracks more than 30 parameters (godmode oscillator and some it’s experimental derivatives, historical volatility coefficients, some time-based variables, ATR-based Trend lines, regular divergences… etc) comparing them against each other, so when “all stars are aligned” based on statistical model built into its algo and when price has enough potential to move in particular direction reaching some measured move target a SIGNAL to enter position is generated.
Theoretical True Winrate of this indicator is around 60%, while practical is somewhat under 50%. True Winrate is a percentage of trades that reached PREDICTED target be it 1R or 20R prediction, instead of just being a common winrate (used by most traders) - percentage of all profitable trades even though many of them didn’t reach initially predicted targets. True WinRate is tied to a signal generating algo implemented in SGU and cannot be changed unless a new more sophisticated algo is found by the developer of this indicator and is implemented in future updates!
Main User Interface of SGU consists of many elements that are developed to help manage trades more efficiently without any emotional impact on decision making process. Apart from obvious Long/Short signals there are also predicted targets that should be hit with some probability for every given signal, suggested stop loss levels corresponding to predicted RR. There are 4 ATR-based trendlines that help determine trend bias on current timeframe and to set intermediate take profit points on the way toward target, also there are indicators of regular divergences to show us weakness during uptrends and downtrends, also there are special warnings included when price closes behind particularly important ATR line with strength enough to continue further it’s movement in initial direction. Also there are 2 candle color-based systems available: one of monitoring how overbought or oversold is price on current TF, second is created to tell us overall trend sentiment - how strong is movement of price in particular direction.
Since price could move in the same fashion during prolonged periods of time there could be a particular TF when signals will be absent till price volatility and oscillator readings doesn’t change its character and become favorable (become synchronized with price action) for signals to be generated. That’s why this indicator should be monitored on multiple TFs at once – you’ll never know on which TF next signal will appear. There will be a multiple signals going on parallel at the SAME TIME, simultaneously in DIFFERENT DIRECTIONS: for example swing long trade based on signal from 12h TF, while having a scalp short at the same time based on 1h chart. Exploring this kind of optimized multi-tasking could be done only by splitting bankroll on multiple accounts registered on Bitmex platform.
Suggested timeframes to monitor for potential signals are empirically chosen that their round multiples should give 24H or 1440m=(24h x 60m) : 12h x 2 = 24h, 3h x 8 = 24h, 144m x 10 = 1440m=24h.
Therefore main timeframes are: 1D, 12h, 8h, 6h, 4h, 3h, 2h, 90m and 1h.
Additional timeframes to watch are: 288m, 144m, and 72m.
Timeframes under 1h aren’t tested yet, but could be traded with additional caution: 45m, 36m and 30m.
To track effectively all signals generated by SGU one should have at least PRO subscription plan paid on TradingView as this allows to use non-standard timeframes and maximum of 10 server-side alerts on price/indicators necessary to work with this indicator.
To do in near future: add volume weighted macd with custom settings as an additional confluence in algo to increase average win rate of signals.
Attention! Past performance of this indicator is not indicative of future results!
For those interested to dig deeper into logic behind using SGU a full 20-page pdf user manual is available for download here: drive.google.com
To gain free test access just write me a DM.
UVOL DVOL Strength and Stagnant HistogramI liked the style of one of Noldo's scripts pertaining to Put/Call ratio so I adapted my existing UVol / DVol ratio script using his code from
I am also reducing the number of securities referenced to only Nasdaq which speeds up displaying
The yellow bars are meant to represent stagnant volume, with green / red representing strong up or down volume.
Note the indicator will display the same no matter which individual stock you are watching since it uses UVol and DVol from the whole Nasdaq exchange NOT the stock or security you are currently viewing.
MFI + RSI + stoch RSI + ema RSIMFI + RSI + stoch RSI + ema RSI
Standard indicators combined in to one.
Bulls vs BearsThe script measures relative strenth of bull bars vs bear bars that complete the next rules:
1) rising price with rising volume calculates as bullish only if the next candle is higher
2) falling price with falling volume calculates as bullish only if the next candle is higher
3) rising price with falling volume calculates as bearish only if the next candle is lower
4) falling price with rising volume calculates as bearish only if the next candle is lower
examples
ethusdt
shitperp
bsvusdt
btcusdt
Market Waves Omega All-In-One IndicatorMarket Waves Omega Indicator consists of 5 separate indicators wrapped into one display area, which makes it easy to see all the information in one go.
Momentum waves
The main area of Market Waves Omega Indicator are the momentum waves, this shows bear and bull divergence as shown on the diagram below:
The idea here is that you are looking for a big momentum wave, followed by a smaller trigger wave. At that point, the price will move accordingly. Note the lighter blue peaks, when these light blue peaks cut in, it’s the end of that trend and the actual trigger point. The wave is not complete until the close of that candle.
The best way to use Market Waves Omega Indicator is to work on the higher time frames first, to get a bigger picture of where the market is moving. So on the daily, if it looks bullish, then you should be looking for bull triggers on the smaller time frames to trade.
VWAP
The next indicator that needs to be considered is the VWAP, shown on the diagram above in yellow. VWAP is volume-weighted average price and shows where the volume is on a positive or negative position. This is typically used by traders on the smaller time frames but gives the user an idea of where the main buyers or sellers are at that point.
RSI
Another indicator within Market Waves Omega Indicator is the RSI, which every trader uses to get an idea of whether the price is overbought or oversold:
Money Flow
The Money Flow Index (MFI) is a technical oscillator that uses price and volume for identifying overbought or oversold conditions in an asset. It can also be used to spot divergences which warn of a trend change in price:
Stoch RSI
Stochastic RSI oscillator was developed to take advantage of both momentum indicators in order to create a more sensitive indicator that is attuned to a specific security's historical performance rather than a generalized analysis of price change.
Green Dots
One of the biggest indicators use to trade off the Market Waves Omega Indicator are green dots :
The green dots are showing when the RSI is super low and therefore should spark some buying pressure due to market being oversold.
One great thing about Market Waves Omega Indicator is that all the data is in one place, and you can see a lot of information, making it easier to scroll through the different time frames at speed and understand the general market position.
The MFI DirectiveThe MFI Directive is a protected indicator that is based on the money flow index but disregards the bias of green and red. Therefore allowing you to make the correct decisions of shorting the top of the money flow and longing the bottom. Now with the right thinking cap on your head, you can achieve better entries on each trade long or short, with The MFI Directive.
Created and developed by: Kite, Ceph, TheDarkHarbinger
Minkovski Distance Period DVOGThis script was created by building my Dependent Variable Odd Generator script on the Minkovski Distance Adaptive Period.
I have tried this on MACD before.
Script related to MACD :
I used an older version that does not use Dow Factor to suit multi timeframe analysis.
In this way, market situations provide the opportunity to see histograms in an adaptive period as a Multi Timeframe.
Minkowski Distance Function Original Script by RicardoSantos :
Regards.
ALTS-Trend
ALTS-Trend
Altcoins-Trend is a technique that shows how much Altcoins is dominating the Marketcap and it's effect over the whole Crypto Market ,and that will show you alts season in each time frame because trend is relative .
*** Features
* Color grading to show you the Increase of domination effect (Green).
* Color grading to show you the Decrease of domination effect (Red) .
* Better understanding to the market ,and that will help you with a very good timed trades at the best trading times for altcoins .
/////////////////////////////////////////////
*Note
Special thanks for Lazybear for his momentum algorithm .
MFI - Money Flow Index [UTS]Money Flow Index (MFI) is the technical indicator, which indicates the rate at which money is invested into a security and then withdrawn from it.
Construction and interpretation of the indicator is similar to Relative Strength Index with the only difference that volume is important to MFI.
Usage:
When analyzing the money flow index one needs to take into consideration the following points:
divergences between the indicator and price movement. If prices grow while MFI falls (or vice versa), there is a great probability of a price turn;
Money Flow Index value, which is over 80 or under 20, signals correspondingly of a potential peak or bottom of the market.
Common known variants of this type of indicator are the On Balance Volume, Chaikin Oscillator or Chaikin Money Flow.
Based on www.metatrader5.com
FearsAndHopesA strategy based on the assumption that if you buy in a panic and sell on the euphoria of the crowd, then in the long run you get a profit. The strategy is symmetrical, that is, we assume that FOMO and FUD have an equal impact on the crowd. Never make different paired parameters. Do not try to get a perfect result on the backtest. The setup is symmetrical, the program does not use EMA, requests to larger timeframes, and other things that can cause repaintings. However, if you use the value 1 in the Fast Sma Length field, repaintings is possible, use with caution. This algorithm makes me profit 2600% profit per year, which, of course, does not mean that the next year will bring the same. API history on Bitmex on request in PM. Use it as an indicator with pleasure. Access to the script and help in setting up costs 0.5 btc
yutas_Money_Flow_Index_TrendVer1.0
Visually understand the initial movement of MFI trends.
The background color changes when the value is greater or less than the specified value.
This should be seen together with ADX etc.
MFIのトレンド発生の初動を視覚的に分かりやすくしました。
指定数値以上・以下で背景の色が変わります。
これはADX等と合わせて見る必要があります。
Hashem Helper -TwoHashem Helper Two
This Indicator contains many indicators and mixture of them.
RSI+MFI = Green and Red Cloud (Above 0 is Green, Below 0 is Red)
StochRSI (K = Aqua, D = Purple)
WaveTrend (Not shown directly but used in the bigger Aqua and Purple Cloud Waves)
VWAP (Volume-Weighted Average Price) = Yellow Cloud Around 0 Line.
The Blue WaveCloud ( which is a Fast Momentum ) and the Purple WaveCloud ( which is Slow Momentum ) is the result of the mixture.
Basically when Fast Wave crosses the Slow Wave, It's a setup and the price momentum is probably going to follow the wave as a "Probable Signal". (when cross happen, a Red or Green Circle is plotted on the 60 or -60 Line)
The idea here is that you are looking for a big momentum wave( Purple Cloud ), followed by a smaller trigger wave ( Blue Cloud ).
In addition the Divergences on StochRSI and RSI and WaveCloud are analyzed. This indicator shows Normal Divergences (R) and Hidden Divergences (H) on itself. But the point is YOU with your TA should must that. So it's NOT an "Absolute Signal". Human eye is needed to interpret the false and true signals.
Divergences on StochRSI and WaveClouds are shown with actual Green/Red Lines (R/H) and on RSI are shown with Shapes on the its line.
Bullish Divergence = Aqua Triangle
Hidden Bullish Divergence = Aqua Circle
Bearish Divergence = Purple Triangle
Hidden Bearish Divergence = Purple Circle
When you see these shapes on the RSI , it tells you: Hey, Watch the RSI and Price, A Divergence could be there but it's not confirmed. you need to confirm it with your own TA.
Note that this is a Helper Indicator, NOT a Short/Long Signal Indicator. This should be used alongside with your TA.
Open Interest Stochastic Money Flow IndexThis is the improved version of Stochastic Money Flow Index script that uses Open Interest instead of volume in Future markets.
I think it will make a difference especially in Future and CFD markets.
Since the system will pull data from Quandl, CFTC reports may cause repaint when disclosed.
So if you use it during the weekly time frame (1W), it will definitely not repaint.
You can also use the volume by selecting "Others" from the menu.This option applies to each instrument, you can use it on any financial instrument with or without COT data.
Bitcoin is included in the "Futures" option.
In Futures, you can observe the difference of Open Interest's success by comparing, since it counts exchanges between the two parties singularly, it reacts more firmly to speculative movements.
This script also includes alerts and bar color options, you can use from the menu.
It is also suitable for mutable variables.This script was freed from the integer loads.You can modify it in any adaptive or fractional period.
I hope it will help your analyzes, regards .
14-RSI minus 36-MFI (weekly)On the weekly chart of BTC/USD, the difference between the 14-RSI and the 36-MFI, combined with the 14-RSI alone, gives good buy and sell signals.
JK-HSIC1(TQ)-1D-CandleThis script uniquely and creatively get daily data on HSI futures from third party sources, so that it display the regular hours trading of HSI data and ignore after hours trading ( AHT ) data, which HSIC1! currently does not allow excluding AHT data.
This script shows candle.
MFI/RSIThis is a simple study that combines MFI and RSI and provides buy/sell alerts.
The red lines are MFI.
the blue lines are RSI.
Boundries are colored as the indicators and are user configurable.
Black triabgles are buy/sell points when both MFI and RSI are overbought/sold.