UVOL DVOL Strength and Stagnant HistogramI liked the style of one of Noldo's scripts pertaining to Put/Call ratio so I adapted my existing UVol / DVol ratio script using his code from
I am also reducing the number of securities referenced to only Nasdaq which speeds up displaying
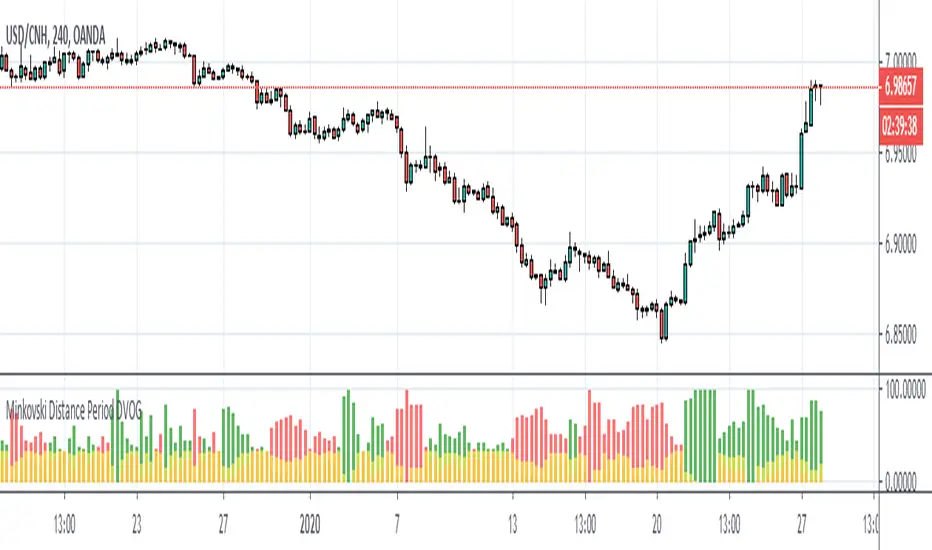
The yellow bars are meant to represent stagnant volume, with green / red representing strong up or down volume.
Note the indicator will display the same no matter which individual stock you are watching since it uses UVol and DVol from the whole Nasdaq exchange NOT the stock or security you are currently viewing.
Penunjuk Pine Script®