Versatile Moving AverageThe Versatile Moving Average (VMA) is a comprehensive, all-in-one tool for trend analysis. It is designed to act as a central hub for advanced MA calculations by combining a wide selection of average types, calculation modes, and a multi-timeframe engine.
Key Features:
Comprehensive MA Selection: Provides a wide variety of moving average types (e.g., EMA, SMA, WMA, HMA, and their volume-weighted counterparts). Allows full customization of length, source, and offset.
Advanced Calculation Modes:
Volume Weighting: Optionally weights the selected MA calculation by volume, making it more responsive to market participation.
Normalization (Geometric Average): A key feature is the optional 'Normalize' mode. When enabled, the indicator calculates a Geometric Moving Average by averaging the logarithms of the source price. This measures the average compound growth rate, making it well-suited for analyzing assets with exponential price behavior.
Multi-Timeframe (MTF) Engine: The indicator includes an MTF conversion block. When a Higher Timeframe (HTF) is selected, advanced options become available: Fill Gaps handles data gaps, and Wait for timeframe to close prevents repainting by ensuring the indicator only updates when the HTF bar closes.
Integrated Alerts: Comes with built-in alerts for the source price crossing over or under the calculated VMA, allowing for timely notifications.
DISCLAIMER
For Informational/Educational Use Only: This indicator is provided for informational and educational purposes only. It does not constitute financial, investment, or trading advice, nor is it a recommendation to buy or sell any asset.
Use at Your Own Risk: All trading decisions you make based on the information or signals generated by this indicator are made solely at your.
No Guarantee of Performance: Past performance is not an indicator of future results. The author makes no guarantee regarding the accuracy of the signals or future profitability.
No Liability: The author shall not be held liable for any financial losses or damages incurred directly or indirectly from the use of this indicator.
Signals Are Not Recommendations: The alerts and visual signals (e.g., crossovers) generated by this tool are not direct recommendations to buy or sell. They are technical observations for your own analysis and consideration.
Moving Averages

Multi-Day SMAmade this script due to the frustration of not having the 5 day SMA added with the 10 20 and 50. I need the 5 SMA for my type of trading to determine when to sell with stocks showing exponential growth.
so heres this: Multi SMA
5 day SMA pink
10 day SMA white
20 day SMA blue
50 day SMA red
200 day SMA green

MA strategyBuy / sell on MA cross. Use ATR or Swing for stop
Option for moving stop after second SwL / SwH
Knock yourself out modifying.

MA 44 moving averages.
There is nothing more to it, but I have to write this otherwise TV wont let me publish.
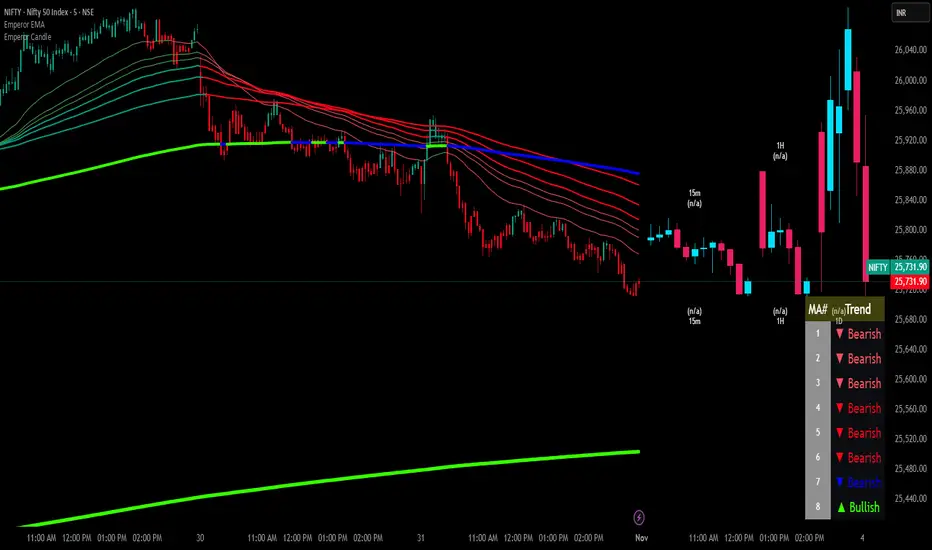
Emperor Moving Averages📘 Description: Emperor Moving Averages — Smart Trend Strength System
Emperor Moving Averages (EMA) is a next-generation trend tracking and confirmation system designed for traders who demand clarity, structure, and actionable precision.
It goes beyond traditional moving averages — combining multi-length dynamic trend analysis, color-coded slope momentum, trend strength visualization via table, and smart crossover alerts.
This indicator is ideal for scalpers, swing traders, and position traders who want to stay aligned with the dominant market momentum without cluttering the chart.
⚙️ Core Features
🧠 1. Dynamic Multi–Moving Average System
Plot up to 8 customizable MAs (EMA, SMA, WMA, or HMA).
Each line dynamically reflects short to long-term trend behavior — perfect for spotting confluence zones and directional bias.
🎨 2. Auto Slope Coloring
Each moving average is automatically colored based on slope direction:
🟢 Bullish (Up Slope) — Trend gaining strength upward
🔴 Bearish (Down Slope) — Trend losing strength or reversing
The slope logic helps identify momentum shifts far earlier than crossover-based signals.
🌫️ 3. Clean Chart Toggle
Toggle all MA lines ON/OFF instantly using
“Show Moving Average Lines?”
for a clutter-free chart — view only the Trend Strength Table when you want a quick macro snapshot.
📊 4. Trend Strength Table
The heart of the indicator — the Trend Strength Table displays every MA’s direction in real-time.
It instantly tells you:
Which MAs are bullish or bearish
How many are aligned in one direction
Whether the overall bias is strengthening or weakening
You can move this table anywhere on your chart — including:
Top / Middle / Bottom + Left / Center / Right positions
This makes it ultra-flexible for any chart layout or resolution.
🔔 5. Intelligent Cross Alerts
Built-in alerts notify you whenever a faster MA crosses over or under a slower MA.
Crossover Up: Fast MA breaks above slow MA → Bullish signal
Crossunder Down: Fast MA breaks below slow MA → Bearish signal
You can adjust the cross sensitivity for tighter or wider detection.
📈 How to Use
Choose your MA type (EMA / SMA / WMA / HMA).
Set the number of MAs (up to 8) and their lengths.
Turn “Show Moving Average Lines” on or off based on preference.
Use the Trend Table to instantly gauge trend strength alignment across all MAs.
Turn on Cross Alerts to get notified on key trend shifts.
🧩 Recommended Setups
Short-term traders (Scalping):
Use smaller MA lengths (e.g., 9, 21, 34) to capture micro-trends.
Swing traders:
Combine 20, 50, 100, 200 to analyze structure shifts and retracements.
Institutional confluence:
Use all 8 MAs together for high-confidence directional bias.
⚡ Advantages
✅ Trend visualization made intuitive
✅ No lagging repainting elements
✅ Adjustable table positioning
✅ Lightweight performance
✅ Perfect companion to price action strategies
💬 Alerts
MA Crossover Up: Fast MA > Slow MA
MA Crossover Down: Fast MA < Slow MA
Use these alerts for automated trend confirmation and entry management.
👑 Final Words
Emperor Moving Averages isn’t just another MA indicator —
it’s a visual intelligence tool that helps traders see market structure clearly, without noise.
Built for clarity, precision, and professional-grade usability.
⚔️ Perfect Combination — Emperor RSI Candle + Emperor Moving Averages
🔸 Emperor RSI Candle
Detects internal candle momentum and RSI power zones
Identifies early exhaustion or entry zones
Great for timing precise entries and exits
🔹 Emperor Moving Averages
Confirms directional trend and slope strength
Validates macro structure and overall momentum direction
Great for staying aligned with the dominant trend flow
✅ Together they create a complete Emperor Trend System:
Use RSI Candle for entry timing and momentum confirmation.
Use Emperor MA Trend Table to confirm overall trend strength.
Enter trades when both align — for maximum accuracy and confidence.
📢 Credits
Developed by Live Trading Emperor — Creator of the Emperor Series for advanced market analysis.
Follow for more premium-grade, scalper-friendly, and MTF-enhanced tools.
MA Cloud + Linha Média🧠 Description of “MA Cloud + Average Line” Indicator
This Pine Script indicator combines multiple moving averages (MAs) into a dynamic visualization that helps traders identify market trends, momentum shifts, and trend strength. It creates a colored cloud between the fastest and slowest moving averages, and also plots an average line representing the mean of all active MAs.
⚙️ 1. Core Features
Multiple Moving Averages (MAs)
Supports up to four customizable moving averages (MA1, MA2, MA3, MA4).
Each MA can use different types:
SMA (Simple Moving Average)
EMA (Exponential Moving Average)
WMA (Weighted Moving Average)
VWMA (Volume-Weighted Moving Average)
RMA (Smoothed Moving Average)
Hull MA (Hull Moving Average)
LSMA (Least Squares Moving Average)
The trader can define each MA’s period, color, and choose whether it’s active or not.
Trend Color Coding
Each MA changes color based on its slope:
Green (or chosen “Up Color”) when rising
Red (or chosen “Down Color”) when falling
This gives instant visual feedback on short-term direction.
MA Cloud (Trend Zone)
When the “Cloud” is active, the area between the minimum and maximum of all active MAs is shaded.
The cloud changes color based on alignment:
🟩 Green Cloud – all MAs are aligned upward (strong bullish trend).
🟥 Red Cloud – all MAs are aligned downward (strong bearish trend).
⚪ Gray Cloud – mixed alignment (no clear trend / consolidation).
Average Line (Mean of All MAs)
Calculates the average of all active MAs and plots it as a central “mean” line.
Serves as a dynamic trend guide — when price is above it, the market tends to be bullish; below it, bearish.
The color of the line follows the current cloud color for consistency.
📈 2. How It Helps Identify Trends
This indicator provides multiple layers of trend confirmation:
Visual Element Interpretation Trend Insight
MA Slope Color Green (Up) / Red (Down) Short-term momentum direction
MA Cloud Color Green / Red / Gray Overall trend alignment across timeframes
Average Line Mean of all MAs Acts as a “trend equilibrium” line
Price vs. Average Line Above = Bullish / Below = Bearish Confirms trend bias
🔍 3. Example Use Cases
Trend Following
Enter long trades when all MAs are aligned (Cloud = Green) and price is above the average line.
Enter short trades when the Cloud is Red and price is below the average line.
Trend Strength Confirmation
The wider the distance between MAs (thicker cloud), the stronger the ongoing trend.
A narrowing cloud or color shift (green → gray → red) can warn of trend reversal or consolidation.
Dynamic Support and Resistance
The MA Cloud acts as a support zone in uptrends and resistance zone in downtrends.
Traders can use the edges of the cloud to identify possible pullback entry zones.
Multi-Timeframe Analysis
By using fast MAs (e.g., 20/50) and slow MAs (100/200), traders can visualize short-term vs. long-term trend interaction, similar to “Golden Cross” and “Death Cross” setups.
🧩 4. How to Use It Practically
Step 1: Enable only the MAs you need (e.g., 20, 50, 200).
Step 2: Observe the cloud color:
🟩 Green → Favor long trades
🟥 Red → Favor short trades
⚪ Gray → Wait for confirmation
Step 3: Use the average line as a filter:
Trade only in the direction of the average line’s slope.
Step 4: Combine with volume, RSI, or price action to refine entries.
💬 Summary
Indicator Name: MA Cloud + Average Line
Purpose: Visual trend detection and confirmation
Best For: Swing and trend-following traders
Signals Provided:
Trend alignment (via color-coded cloud)
Momentum shifts (via MA color changes)
Dynamic support/resistance (via cloud zones)
Overall trend bias (via average line)

iulifx EMAThe indicator is built on an 8-period moving average that closely follows price action.
When a candle closes completely beyond the moving average, it’s a signal to be cautious, as this may indicate a potential trend reversal.
If only the wick of the candle reaches the moving average and then gets absorbed, it can be interpreted as a retest, suggesting an opportunity to enter the market in the current trend direction.
Additionally, candle colors reflect market volume conditions:
Blue candles indicate an overbought zone, showing strong buying pressure — a potential start of a bullish move.
Black candles indicate an oversold zone, reflecting strong selling pressure.
If one of these colored candles breaks the moving average with strength and momentum, it strongly suggests that a trend reversal is likely underway.

Breakout FinderFindling possible breakouts.. works well when you use short SL and High Risk to Reward Ratio

7 MM colored 3 BB clouded + MACD + RSI Zones7 MM colored
3 BB clouded
MACD flèches rouges et vertes
RSI Zones sur vente étoile jaune

Teknik Aritmetik Ortalama )Mira)-1*Finds the best places to buy.
*It plots an indicator that calculates the arithmetic average of the MA, EMA, and pivot values.
*Uses the same weight for all values in the calculation.
*Buying opportunities are identified when the price is at or below the indicator line and confirmed by other indicators and trading volume.
*Average values are customizable via the indicator's settings.
*It is not investment advice. It is designed to provide an idea for determining the best entry points.

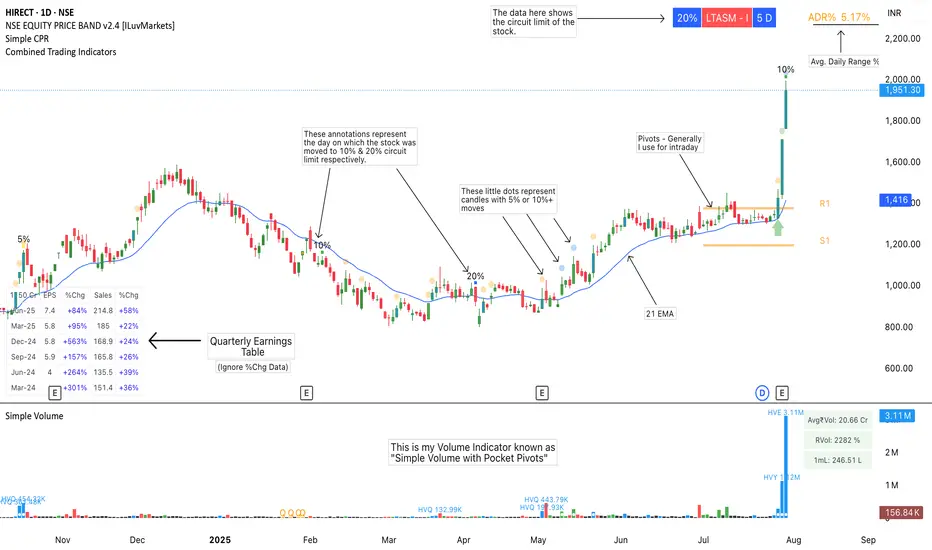
Combined Trading IndicatorsThis indicator is a combination of EMAs (4 Editable EMAs), Quarterly Earnings, OOPs Reversal day, Burst Power Indicator, RS Rating, ADR% Settings and a few more to come.
Basically it is designed for swing traders who are using TradingView's Basic or Essential Program.
Please ignore the %Chg data in QE Table.
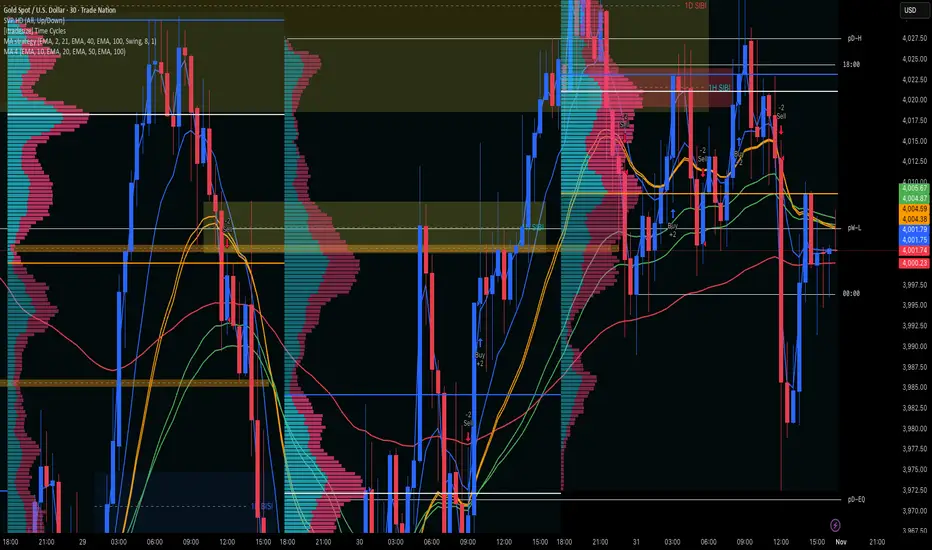
Gold $25 line + CDCGold Trading CDC + option line
trading with ema to see trendline + Option strike price

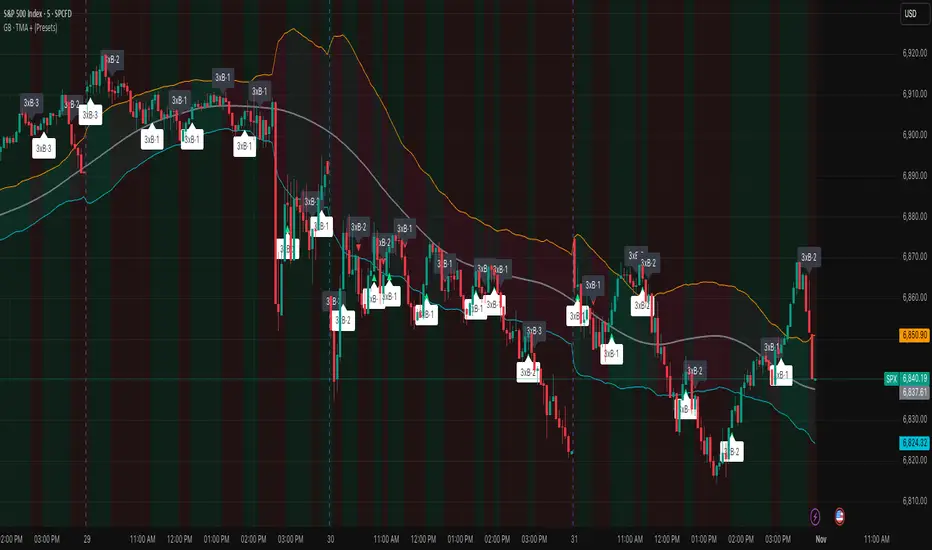
Grizzly Brahman · PRO SCALPERGrizzly Brahman TMAX 4 is a fourth-generation Trend-Momentum-Adaptive Crossover system built to identify true intraday direction and volatility alignment before price acceleration begins.
It combines adaptive moving-average bands, momentum filtration, and trend-fill logic to produce crystal-clear long/short zones directly on the chart.
Preset Modes
“Aggressive / Balanced / Disciplined” presets optimize responsiveness for scalping, intra-day, or swing conditions.
Session Shading & ORB Levels
Optional overlays for Opening Range Breakout, Pre-Market High/Low, and Previous Day High/Low to frame liquidity targets.
Heikin Ashi Compatibility
Optimized to read momentum flow cleanly on Heikin Ashi charts for false-breakout filtering.
Momentum Bands
Adaptive outer bands act as over-extension or “take-profit” zones — similar to ATR channels but smoothed for consistency.
How to Use
Identify Trend Zone — watch for color fill change and TMA alignment.
Enter on Marker Confirmation — green triangle = long momentum confirm, red triangle = short.
Manage Risk around outer TMA/ATR band touches or when color intensity fades.
Combine with GB Set-Up & Confirmation (lower pane) for dual-signal entry validation.

EMA/SMA The EMA/SMA indicator is a comprehensive moving-average suite designed for traders who rely on layered exponential and simple moving averages for trend confirmation, crossover analysis, and long-term market structure.
It plots a full set of EMAs (5 → 377) along with key SMAs (200 & 377) to help identify both short-term momentum and long-term directional bias. The color scheme is carefully curated for visual clarity across light and dark chart themes.
Key Highlights:
🧩 12 EMAs — from 5-period up to 377-period for multi-speed trend visualization.
📊 2 SMAs (200 & 377) — industry-standard long-term trend filters.
🎯 Dynamic Labels — auto-display the latest 200 EMA, 200 SMA, 377 EMA, and 377 SMA values for quick reference.
⚙️ Customizable Inputs — adjust source, line width, and toggle labels.
🌈 Optimized Color Palette — professional and easily distinguishable tones for trend separation.
Use Cases:
Identify dynamic support/resistance from clustered EMAs.
Spot early trend shifts as short EMAs cross longer ones.
Confirm macro trend direction using the 200 EMA/SMA and 377 EMA/SMA confluence.
Build higher-timeframe trading confluence setups.
Ideal For:
Scalpers, swing traders, and long-term investors who prefer visually clean, multi-layered moving average systems with institutional-grade references.
VWMA Series (Dynamic) mtf - Dual Gradient Colored"VWMA Series (Dynamic) mtf - Dual Gradient Colored" is a multi-timeframe (MTF) Volume-Weighted Moving Average (VWMA) ribbon indicator that plots up to 60 sequential VWMAs with arithmetic progression periods (e.g., 1, 4, 7, 10…). Each VWMA line is dual-gradient colored: Base hue = Greenish (#2dd204) if close > VWMA (bullish), Magenta (#ff00c8) if close < VWMA (bearish)
Brightness gradient = fades from base → white as period increases (short → long-term)
Uses daily resolution by default (timeframe="D"), making it ideal for higher-timeframe trend filtering on lower charts.Key FeaturesFeature
Description
Dynamic Periods
Start + i × Increment → e.g., 1, 4, 7, 10… up to 60 terms
Dual Coloring
Bull/Bear + Gradient (short = vivid, long = pale)
MTF Ready
Plots daily VWMAs on any lower timeframe (1H, 15M, etc.)
No Lag on Long Sets
Predefined "best setups" eliminate repainting/lag
Transparency Control
Adjustable line opacity for clean visuals
Scalable
Up to 60 VWMAs (max iterations)
Recommended Setups (No Lag)Type
Example Sequence (Start, Inc, Iter)
Long-Term Trend
1, 3, 30 → 1, 4, 7 … 88
93, 3, 30 → 93, 96 … 180
372, 6, 30 → 372, 378 … 546
Short-Term Momentum
1, 1, 30 → 1, 2, 3 … 30
94, 2, 30 → 94, 96 … 152
1272, 5, 30 → 1272, 1277 … 1417
Key Use CasesUse Case
How to Use
1. Multi-Timeframe Trend Alignment
On 1H chart, use 1, 3, 30 daily VWMAs → price above all green lines = strong uptrend
2. Dynamic Support/Resistance
Cluster of long-term pale VWMAs = major S/R zone
3. Early Trend Change Detection
Short-term vivid lines flip from red → green before longer ones = early bullish signal
4. Ribbon Compression/Expansion
Tight bundle → consolidation; fanning out → trend acceleration
5. Mean Reversion Entries
Price far from long-term VWMA cluster + short-term reversal = pullback trade
6. Volume-Weighted Fair Value
Long-period VWMAs reflect true average price paid over weeks/months
Visual Summary
Price ↑
████ ← Short VWMA (vivid green = close > VWMA)
███
██
█
. . . fading to white
█
██
███
████ ← Long VWMA (pale = institutional average)
Green lines = price above VWMA (bullish bias)
Magenta lines = price below VWMA (bearish bias)
Gradient = shorter (left) → brighter; longer (right) → whiter
Ribbon thickness = trend strength (wide = strong, narrow = weak)
Best For Swing traders using daily trend on intraday charts
Volume-based strategies (VWMA > SMA)
Clean, colorful trend visualization without clutter
Institutional fair value anchoring via long-period VWMAs
Pro Tip:
Use Start=1, Increment=3, Iterations=30 on a 4H chart with timeframe="D" → perfect daily trend filter with zero lag and beautiful gradient flow.

Murrey Math SMA up to 32s Murrey Math SMA up to 32s is a highly advanced Pine Script v5 indicator that combines Murrey Math Lines (MML) with a customizable moving average (MA) — including a non-repainting Rolling VWAP (RVWAP) — and dynamic color-coded support/resistance bands up to 1/32 subdivisions. It projects octave-based geometric price levels (like Gann) centered on your chosen MA, with adaptive scaling, angle-based trend coloring, and absolute/extended MML bands. Includes 1/8, 1/16, and 1/32 grid lines, shaded zones, labels, and a live increment display.Core FeaturesFeature
Description
MA Types
SMA, VWMA, VWAP, Period VWAP, RVWAP (rolling VWAP over fixed or adaptive time window)
Murrey Math Grid
Auto-scaled 0/8 to 8/8 + extensions (±3/8), with 1/16 & 1/32 subdivisions
Dynamic Coloring
Bands colored by MA slope angle (bullish/bearish) or absolute MML shift
RVWAP Engine
Non-repainting volume-weighted average over user-defined or adaptive time steps
Wick Filtering
Optional ignore wicks for cleaner MML framing
Resolution Support
Works with higher timeframe data via request.security()
Key Use Cases Use Case
How to Use
1. Precision Support & Resistance
Treat 4/8 (mid) as pivot, 0/8 & 8/8 as extremes. Price often reverses or accelerates at these levels.
2. Mean Reversion Trades
Buy near 0/8–1/8 (oversold), sell near 7/8–8/8 (overbought) when MA is flat or sloping mildly.
3. Trend Continuation
When MA angle > threshold and price breaks 5/8, expect move to 8/8. Confirm with volume.
4. Breakout Entries
Watch for close beyond 8/8 or 0/8 + MA angle steep → strong momentum breakout.
5. Scalping with 1/32 Grid
Use 1/32 lines as micro-targets in ranging markets or after news spikes.
6. Volume-Weighted Fair Value
RVWAP = true average price paid over time → anchor for institutional fair value.
Visual Layout (MA-Centered)
+3/8 ───┐
+2/8 ───┤ ← Strong resistance
+1/8 ───┤
8/8 ███┤ ← Overbought (red zone)
7/8 ───┤
6/8 ███┤
5/8 ───┤
4/8 ███┤ ← Midline (pivot)
3/8 ───┤
2/8 ███┤
1/8 ───┤
0/8 ███┤ ← Oversold (green zone)
-1/8 ───┤
-2/8 ───┤
-3/8 ───┘
Shaded: 0/8–1/8 (buy), 7/8–8/8 (sell), 3/8–5/8 (neutral/consolidation)
MA Line: Orange (RVWAP) or hidden
Labels: Bottom, 1/4, Mid, 3/4, Top (offset to the right)
Table: Shows current Increment size
Best For Swing & scalp traders on stocks, forex, crypto
Volume-based strategies (RVWAP shines in high-volume moves)
Gann/Murrey Math enthusiasts wanting automation + modern MA anchoring

VMMA Ribbon + Q1/Q3 Echo Rayssimulates a series of vwma lines in a wave. Basically puts them in an array and calculates highest lowest values among other things ... The VMMA Ribbon + Q1/Q3 Echo Rays is a Pine Script v5 indicator that combines a dynamic Volume-Weighted Moving Average (VWMA) ribbon with interactive support/resistance "echo rays" based on the ribbon’s inner quartiles (Q1 and Q3). The ribbon is built from multiple VWMAs of increasing lengths, forming a band with an upper edge, lower edge, midline, and Q1/Q3 lines (representing the 25th and 75th percentiles of the band).
Edges are colored by slope (bullish = green, bearish = red) or use a default color.
Echo rays extend horizontally from recent swing lows in Q1 and swing highs in Q3, acting as dynamic support/resistance levels that "echo" past extremes until broken or surpassed.
Key Use CasesUse Case
Description
1. Trend Strength & Direction
Ribbon expansion = volatility; compression = consolidation. Slope-colored edges show momentum shifts early.
2. Dynamic Support & Resistance
Q1/Q3 echo rays mark high-probability reversal zones. Price respecting rays = continuation; break = reversal.
3. Mean Reversion Entries
Buy near Q1 ray in uptrend (oversold within band); sell near Q3 ray in downtrend.
4. Breakout Confirmation
Price breaking upper/lower edge + Q3/Q1 ray termination confirms strong breakout.
5. Volume-Weighted Context
Uses VWMA → more reactive to volume spikes than SMA → better for stocks/crypto with sudden volume surges.

Uptrick: Volume Weighted BandsIntroduction
This indicator, Uptrick: Volume Weighted Bands, overlays dynamic, volume-informed trend channels directly on the chart. By fusing price and volume data through volume-weighted and exponential moving averages, the script forms a core trend line with adaptive bandwidth controlled by volatility. It is designed to help traders identify trend direction, breakout entries, and extended conditions that may warrant take-profits or pullback re-entries.
Overview
The Volume Weighted Bands system is built around a trend line calculated by averaging a Volume Weighted Moving Average (VWMA) and an Exponential Moving Average (EMA), both over a configurable lookback period. This hybrid trend baseline is then smoothed further and expanded into dynamic upper and lower bands using an Average True Range (ATR) multiplier. These bands adapt with market volatility and shift color based on prevailing price action, helping traders quickly identify bullish, bearish, or neutral conditions.
Originality and Unique Features
This script introduces originality by blending both price and volume in the core trend calculation, a technique that is more responsive than traditional moving average bands. Its multi-mode visualization (cloud, single-band, or line-only), combined with selective buy/sell signals, makes it flexible for discretionary and algorithmic strategies alike. Optional modules for take-profit signals based on z-score deviation and RSI slope, as well as buy-back detection logic with cooldown filters, offer practical tools for managing trades beyond simple entries.
Explanation of Inputs
Every user input in this script is included to give the trader control over behavior and visual presentation:
Trend Length (len): Defines the lookback window for both the VWMA and EMA, controlling the sensitivity of the core trend baseline. A lower value makes the bands more reactive, while a higher value smooths out short-term noise.
Extra Smoothing (smoothLen): Applies an additional EMA to the blended VWMA/EMA average. This second-level smoothing ensures the central trend line reacts gradually to shifts in price.
Band Width (ATR Multiplier) (bandMult): Multiplies the ATR to create the width of the upper and lower bands around the trend line. Larger values widen the bands, capturing more volatility, while smaller values narrow them.
ATR Length (atrLen): Sets the length of the ATR used in calculating band width and signal offsets. Longer values produce smoother band boundaries.
Show Buy/Sell Signals (showSignals): Toggles the primary crossover/crossunder entry signals, which are labeled when the close crosses the upper or lower band.
Visual Mode (visualMode): Allows selection between three display modes:
--> Cloud: Shows both bands and the central trend line with a shaded background.
--> Single Band: Displays only the active (upper or lower) band depending on trend state, with gradient fill to price.
--> Line Only: Shows only the trend line for a minimal visual profile.
Take Profit Signals (enableTP): Enables a z-score-based profit-taking signal system. Signals occur when price deviates significantly from the trend line and RSI confirms exhaustion.
TP Z-Score Threshold (tpThreshold): Sets the z-score deviation required to trigger a take-profit signal. Higher values reduce the frequency of signals, focusing on more extreme moves.
Re-Entries (enableBuyBack): Enables logic to signal when price reverts into the band after an initial breakout, suggesting a possible re-entry or pullback setup.
Buy Back Cooldown (bars) (buyBackCooldown): Defines a minimum bar count before a new buy-back signal is allowed, preventing rapid retriggering in choppy conditions.
Buy Offset and Sell Offset: Hidden inputs used to vertically adjust the placement of the Buy ("𝓤𝓹") and Sell ("𝓓𝓸𝔀𝓷") labels relative to the bands. These use ATR units to maintain proportionality across different instruments and timeframes.
Take-Profit Signal Module
The take-profit module uses a z-score of the distance between price and the trend line to detect extended conditions. In bullish trends, a signal appears when price is well above the band and RSI indicates exhaustion; the opposite applies for bearish conditions. A boolean flag is used to prevent retriggering until RSI resets. These signals are plotted with minimalist “X” markers near recent highs or lows, based on whether the market is extended upward or downward.
Re-Entry Logic
The re-entry system identifies instances where price momentarily dips or spikes into the opposite band but closes back inside, implying a continuation of the prevailing trend. This module can be particularly useful for traders managing entries after brief pullbacks. A built-in cooldown period helps filter out noise and prevents signal overloading during fast markets. Visual markers are shown as upward or downward arrows near the relevant candle wicks.
How to Use This Indicator
The basic usage of this indicator follows a directional, signal-driven approach. When a buy signal appears, it suggests entering a long position. The recommended stop loss placement is below the lower band, allowing for some breathing space to accommodate natural volatility. As the position progresses, take partial profits—typically 10% to 15% of the position—each time a take-profit signal (marked with an "X") is shown on the chart.
An optional feature is the buy-back signal, which can be used to re-enter after partial exits or missed entries. Utilizing this can help reduce losses during false breakouts or trend reversals by scaling in more gradually. However, it also means that in strong, clean trends, the full position may not be captured from the start, potentially reducing the total return. It is up to the trader to decide whether to enter fully on the initial signal or incrementally using buy-backs.
When a sell signal appears, the strategy advises fully exiting any long positions and immediately switching to a short position. The short trade follows the same logic: place your stop loss above the upper band with some margin, and again, take partial profits at each take-profit signal.
Visual Presentation and Signal Labels
All signals are plotted with clean, minimal labels that avoid clutter, and are color-coded using a custom palette designed to remain clear across light and dark chart themes. Bullish trends are marked in teal and bearish trends in magenta. Candles and wicks are also colored accordingly to align price action with the detected trend state. Buy and sell entries are marked with "𝓤𝓹" and "𝓓𝓸𝔀𝓷" labels.
Summary
In summary, the Uptrick: Volume Weighted Bands indicator provides a versatile, visually adaptive trend and volatility tool that can serve multiple styles of trading. Through its integration of price, volume, and volatility, along with modular take-profit and buy-back signaling, it aims to provide actionable structure across a range of market conditions.
Disclaimer
This indicator is for educational purposes only. Trading involves risk, and past performance does not guarantee future results. Always test strategies before applying them in live markets.

MoneyPlant-Auto Support Resistance V2.0
🧭 Overview
MoneyPlant – Auto Support Resistance is a professional-grade indicator designed to automatically detect dynamic Support and Resistance levels using real-time market structure.
It combines trend confirmation, structure analysis, and momentum logic to identify high-probability trading zones in all market conditions.
⚙️ Core Concept
This indicator uses a unique combination of classic and proprietary logic to filter only the most relevant S/R levels:
• Dynamic Support/Resistance Mapping: Detects strong reaction levels based on price structure, candle rejection points, and breakout validation.
• EMA & WMA Trend Filter: Uses a triple-moving-average model (default EMA 18, EMA 25, and WMA 7) to confirm current market bias.
• MACD Momentum Filter: Confirms trend strength and helps avoid false breakouts.
• Smart Alignment Logic: Generates signals only when structure, trend, and momentum all align in the same direction.
🧠 How It Works
1. Buy Setup:
When price breaks above a resistance level with bullish EMA/WMA alignment and positive MACD momentum → Buy Signal triggers.
2. Sell Setup:
When price breaks below a support level with bearish EMA/WMA alignment and negative MACD momentum → Sell Signal triggers.
3. Auto-Refreshing Zones:
Support and Resistance zones update dynamically as market structure evolves.
🎯 Best Use Cases
• Works effectively on Stocks, Indices, Forex, and Commodities (e.g., XAUUSD, NIFTY, BANKNIFTY ).
• Ideal for Intraday & Swing Trading (15 min – 1 hour timeframes).
• Fully compatible with TradingView alerts and automation tools.
💡 Key Features
✅ Automatic Support/Resistance detection
✅ Adaptive EMA + WMA + MACD trend logic
✅ Real-time Buy/Sell alerts
✅ Multi-timeframe compatibility
✅ Optimized for clean chart visuals
⚖️ Recommended Settings
• EMA Fast: 18
• EMA Slow: 25
• WMA Filter: 7
• MACD: Default parameters
(Users may adjust EMA/WMA settings according to their own trading style.)
🔒 How to Get Access
To get access to this invite-only script, please send me a private message on TradingView or use the link in my profile.
Once your username is added via Manage Access, you’ll be able to use the indicator.
🧾 Notes for Traders
This tool does not repaint, and it’s meant for educational and analytical purposes only.
Each license is valid for one TradingView username — no resale or redistribution is permitted.
Developed by MoneyPlant
Smart Automation for Professional Traders

Smart Moving Average Dynamics [ChartNation]Smart Moving Average Dynamics (SMAD) — by Chart Nation
What it does:
SMAD maps how far price deviates from a chosen moving average and normalizes that distance into a bounded oscillator (−100…+100). It detects extreme expansions and prints non-repainting dots when the move exits an extreme. Price-level rails are drawn from those events (with optional fade/expiry) to highlight likely reaction zones. The MA line is colored by bias. A slim gauge summarizes the current oscillator percentile; a compact info panel shows TF, Trend, Volume rank, and Volatility rank.
How it works (high-level, closed-source)
Core signal: diff = price – MA(type, length) where MA can be SMA/EMA/RMA/WMA/VWMA.
Normalization (choose one):
Highest Abs (N): scales diff by the highest absolute excursion over N bars (fast, adaptive).
Z-Score: scales by stdev(diff, N) and maps ±σ to ±100 via a user factor.
ATR-Scaled: scales by ATR * k, relating deviation to current volatility.
Percent Rank: ranks the magnitude of |diff| over N bars and reapplies the original sign.
All methods clamp to −100…+100 to keep visuals consistent across assets/TFs.
Extremes & confirmation: Dots print only when an extreme exits ±100 (optionally on bar close) and can be filtered by linger bars and short-term slope flip, reducing one-bar spikes.
Rails: When an extreme confirms, a rail is anchored at the corresponding price swing and can soft-fade and/or expire after X bars.
Trend color: MA color = Up (green) when oscillator > threshold and MA slope > 0; Down (magenta) for the opposite; Neutral otherwise.
Context panels:
Slim Gauge: current oscillator bucket (0–20) with the exact normalized reading.
Info Panel: TF, Trend, and 0–100 percent-ranks of Volume and ATR-based volatility grouped as Low / Medium / High.
SMAD isn’t a collection of plots; it’s a single framework that integrates:
a deviation-from-MA engine,
four interchangeable normalization models (selected per market regime),
a gated extreme detector (linger + slope + confirm-on-close), and
time-aware rails with soft fade/expiry, presented with a minimal gauge and info panel so traders can compare regimes across TFs without recalibrating thresholds.
How to use (examples, not signals)
Mean-revert plays: When price exits an extreme and prints a dot, look for reactions near the new rail. Combine with your S/R and risk model.
Trend continuation: In strong trends the oscillator will spend more time above/below zero; the colored MA helps keep you aligned and avoid fading every push.
Regime switching: Try Percent Rank or ATR-Scaled on choppy/alts; Z-Score on majors; Highest Abs (N) when you want fastest adaptation.
Risk ideas: Rails can be used as partial-take or invalidate levels. Always backtest on your pair/TF.
Key settings
Normalization: Highest Abs / Z-Score / ATR-Scaled / Percent Rank (with N & factors).
Filters: Extreme threshold, linger bars, slope lookback, confirm on close.
Rails: Expire after X bars; soft-fade step.
Panels: Slim gauge (bottom-right), Info panel (middle-right).
Notes & limits
Prints confirm after the extreme exits ±100; nothing repaints retroactively.
Normalization can change sensitivity—choose the one matching your asset’s regime.

All-in-One: EMA, ORB, PM, and Anchored VWAPAll-in-One: EMA, ORB, PM, and Anchored VWAP... ema 9/20/50/100/20 + opening range break + premarket high and lows + vwap all in one indicator enjoy.. all these can be turned on and off if you only want vwap and ema or pm and orb etc..

EMA & ORB/PM LevelsScript that combines EMA and opening range and Premarket high and low levels all in one so you can save using three indicators and just use this one.
