MSP Multi-Timeframe Trend & Momentum DashboardMulti-Timeframe Trend, Momentum, and Bias Dashboard
This indicator provides a multi-timeframe overview by evaluating several technical conditions across multiple timeframes simultaneously.
Its purpose is to help traders assess alignment or divergence between higher and lower timeframes before making trading decisions.
Rather than generating standalone signals, the dashboard summarizes trend, momentum, participation, and trend-strength metrics into a compact visual table.
What the Indicator Evaluates (Per Timeframe)
Each selected timeframe is analyzed independently using:
Trend context
Price position relative to fast and slow moving averages
Momentum
RSI position relative to user-defined thresholds
Directional confirmation
MACD line relative to its signal line
Participation
Current volume compared to its recent average
Trend strength
ADX value to distinguish trending from non-trending conditions
These components are combined to form a directional bias assessment for each timeframe.
Dashboard Overview
The dashboard displays:
Directional bias per timeframe
Aggregate bias across all selected timeframes
Momentum and trend readings
Relative volume strength
Trend-strength values
Alignment status when multiple timeframes agree
This allows users to quickly identify whether market conditions are aligned, mixed, or conflicting across timeframes.
Visual Encoding
Cells within the table are color-coded to improve readability:
Bullish bias
Bearish bias
Neutral or mixed conditions
Color intensity reflects relative strength, helping distinguish weak alignment from stronger confluence.
Optional chart-level visuals can highlight periods of broad alignment or disagreement across timeframes.
Customization Options
Users may adjust:
Timeframes included in the dashboard
Thresholds for momentum, volume, and trend strength
Table size, position, and visual appearance
Alert conditions based on alignment criteria
These settings allow the indicator to be adapted to different instruments, timeframes, and trading styles.
Intended Use
Style: Multi-timeframe analysis and confirmation
Markets: Forex, crypto, equities, index futures
Purpose:
Assess higher-timeframe bias
Improve directional context before entries
Avoid trades against broader trend conditions
The indicator is most useful as a contextual filter, rather than a standalone decision tool.
Important Notes
This script is provided for educational and analytical purposes only.
It does not predict price movement and should be used alongside independent analysis and appropriate risk controls.
Moving Averages

SMA MAD Trend [Alpha Extract]A sophisticated trend identification system that combines Simple Moving Average with Mean Absolute Deviation methodology to create adaptive Super Trend-style bands with advanced strength filtering and gradient visualization. Utilizing ADX-based trend strength validation and slope analysis for signal quality enhancement, this indicator delivers institutional-grade trend detection with dynamic ATR-based ribbon visualization and comprehensive strength measurement. The system's dual-filter architecture eliminates false signals during weak or choppy market conditions while maintaining sensitivity to genuine trend establishment and reversal events.
🔶 Advanced SMA-MAD Band Construction
Implements innovative Mean Absolute Deviation calculation around Simple Moving Average baseline to create volatility-adaptive bands with ratcheting logic for trend persistence. The system calculates MAD by measuring absolute price deviations from the mean, then applies configurable multipliers to generate upper and lower bands that adjust to changing market conditions while preventing premature band violations.
// Core SMA-MAD Framework
SMA_Value = ta.sma(close, SMA_Length)
Mean = ta.sma(close, MAD_Length)
Abs_Deviation = abs(close - Mean)
MAD_Value = ta.sma(Abs_Deviation, MAD_Length)
// Adaptive Bands
Upper_Band = SMA_Value + MAD_Factor * MAD_Value
Lower_Band = SMA_Value - MAD_Factor * MAD_Value
🔶 Intelligent Dual-Filter System
Features comprehensive trend validation using ADX strength measurement and slope analysis to eliminate low-conviction signals during ranging or consolidating markets. The system calculates normalized slope strength using ATR scaling and combines with ADX threshold analysis, generating filtered trend states that distinguish genuine trends from temporary price fluctuations.
🔶 Dynamic Trend Strength Engine
Implements sophisticated strength calculation combining slope intensity and ADX readings to produce normalized 0-100% strength scores with gradient colour intensity modulation. The system normalizes slope by minimum threshold and ADX by configurable level, multiplying factors to create composite strength measurement that drives visual feedback intensity across all indicator elements.
🔶 Super Trend-Style Direction Logic
Utilizes classic Super Trend methodology adapted for SMA-MAD bands, where trend direction flips occur on opposite band violations with persistent state maintenance. The system tracks previous band levels with ratcheting behaviour that adjusts bands only when price movement or new calculations warrant changes, preventing oscillation during normal volatility.
🔶 ATR-Based Ribbon Visualization
Provides dynamic ribbon overlay using ATR-scaled width around the trend line with opacity modulation based on trend strength for intuitive conviction assessment. The system creates upper and lower ribbon bounds at configurable ATR multiples, filling the channel with gradient-adjusted transparency that increases during strong trends and fades during weak conditions.
🔶 Multi-Dimensional Visual Architecture
Provides complete chart integration through trend line overlay, ATR ribbon fills, candle colouring, background glow, and transition signal labels with configurable visibility toggles. The system enables traders to customize display density from minimal (trend line only) to comprehensive (all visual elements) while maintaining consistent colour scheme and strength-based intensity across components.
🔶 Slope Strength Validation
Calculates ATR-normalized slope over configurable lookback periods to measure trend line momentum and filter sideways price action. The system compares absolute slope against minimum threshold requirements, preventing trend signals when price movement relative to the trend line lacks sufficient directional conviction regardless of band position.
🔶 Signal Generation Framework
Generates trend change signals when filtered direction state transitions from bearish to bullish or vice versa, with label placement and alert integration. The system implements state persistence that maintains previous trend until both ADX and slope filters confirm directional change, reducing whipsaw signals while capturing genuine reversals with minimal lag.
🔶 Performance Optimization Framework
Utilizes efficient calculation methods with optimized variable management and configurable parameters for balance between responsiveness and stability. The system includes intelligent state tracking with NA handling for initial bars and smooth gradient calculations that maintain performance across extended historical periods and real-time updates.
This indicator delivers sophisticated trend identification through Mean Absolute Deviation methodology combined with dual-strength filtering for superior signal quality. Unlike traditional Super Trend indicators that rely solely on ATR bands, the SMA-MAD approach uses statistical deviation measurement while incorporating ADX strength and slope validation to eliminate false signals during choppy conditions. The system's gradient-based visual feedback, ATR ribbon visualization, comprehensive dashboard, and multi-dimensional filtering make it essential for traders seeking reliable trend-following approaches with clear conviction measurement across cryptocurrency, forex, and equity markets. The combination of adaptive bands, strength-based transparency, and intelligent filtering creates an institutional-grade trend system suitable for systematic trading strategies.

Custom EMA/SMA Ribbon [TheScalpingAnt]Overview
Custom EMA/SMA Ribbon is a premium market trend framework designed to simplify trend recognition, improve timing, and provide clearer structure during both trending and corrective environments. Unlike traditional moving-average indicators, this ribbon focuses on visual clarity, hierarchy, and actionable interpretation — delivering institutional-style trend information directly on your chart.
It is engineered for traders who demand reliability, precision, disciplined decision support, and a clean visual experience without laggy oscillators or noisy signals.
Core Concepts
This indicator is built on three fundamental professional trading concepts:
Trend Structure
Multiple layered moving averages allow traders to instantly understand whether the market is aligned, compressing, transitioning, or breaking down.
Hierarchy & Visual Priority
Short-term MAs are always plotted in front of longer-term averages. This ensures decision-critical structures remain visible and readable, even during market volatility.
True Trend Validation (Not Slope Noise)
Color logic is based on structural dominance rather than temporary slope changes.
A line turns bullish only when it is above the next slower MA, and bearish when below it.
This prevents misleading color flips, maintains logical consistency, and improves confidence in interpretation.
Key Features
• Selectable EMA or SMA mode
• 6-layer ribbon trend architecture
• Correct priority stacking (MA1 always front → MA6 always back)
• Professional bullish / bearish dominance color logic
• Clean and readable premium visual design
• Works on crypto, forex, stocks, and indices, any market.
• Zero repainting
• Lightweight and highly efficient performance
This ensures instant clarity whether trading intraday or analyzing macro market structure.
Customization
Users retain full analytical power and flexibility without losing structure:
• Choose EMA or SMA
• Fully configurable MA lengths
• Individual line style (solid, dashed, dotted)
• Independent line thickness per MA
• Works seamlessly on any symbol and timeframe
This makes the ribbon suitable for swing traders, intraday traders, position traders, and strategy/system builders.
Usage Guidance
This ribbon functions as a market regime detector and structural trend guide, not a simple “buy/sell” tool.
Common professional use cases:
• Identify trend continuation vs structural breakdown
• Confirm market alignment before entering positions
• Validate pullbacks without losing macro perspective
• Avoid trading against dominant bias
• Detect accumulation, consolidation, and expansion phases
Interpretation logic
• Green alignment → structured bullish trend environment
• Red alignment → structural weakness / bearish regime
• Compression → potential volatility, transition, or trend shift area
Example Interpretation
Bearish → Bullish transition example:
• Shorter MAs recover first
• They cross back above slower averages
• Each line turns green only when structural control is truly regained
• A fully green staircase indicates confirmed bullish trend structure
During pullbacks:
Price may retrace, but if hierarchy remains intact, the ribbon stays green — preventing unnecessary panic exits.
Only when structural dominance truly breaks does the ribbon shift red, warning traders to reduce exposure, re-evaluate bias, or reposition.
Settings (Defaults & Logic)
Default optimized configuration:
• Lengths: 10 / 20 / 50 / 100 / 150 / 200
• Type: EMA
• Styles: Solid
• Thickness: 2
Users may customize thickness, style, and calculation type without losing conceptual integrity.
Conclusion
The Custom EMA/SMA Ribbon delivers:
• Higher clarity
• Reduced chart noise
• Stronger confidence in execution
• Superior trend comprehension
• A disciplined, structured trading perspective
Built for serious traders, this tool transforms raw market movement into clear structural intelligence.
Disclaimer
This indicator is a technical analysis tool for educational and analytical purposes only. It does not guarantee profits, does not constitute financial advice, and should not be used as the sole decision-making method. Trading involves risk; users remain responsible for their decisions.

Adoptive Conditional range High/Low MA Crossover StrategyDeveloped from the doctoral research of Abu-Kadunagra at ****** University's in Australia, this strategy implements a "Campaign-Based Adaptive Execution" framework. It moves beyond simple entries and exits by treating each market engagement as a multi-phase campaign with distinct operational states. The system intelligently identifies cyclical turning points, then employs a feedback-driven approach to capital allocation—reinforcing successful momentum with pyramiding while deploying controlled defensive averaging during temporary setbacks. By anchoring its exit mechanism to dynamically updated market structure rather than static profit targets, the algorithm seeks to capture cyclical momentum while maintaining disciplined risk parameters. This research-driven approach represents an evolution toward state-aware algorithmic systems that adapt their tactics in real-time based on market phase recognition.

Conditional-range High/Low adoptive-MA Crossover StrategyDeveloped from the doctoral research of Abu-Kadunagra at ****** University on topic of Digital Finance and Crypto in Australia, this strategy implements a "Campaign-Based Adaptive Execution" framework. It moves beyond simple entries and exits by treating each market engagement as a multi-phase campaign with distinct operational states. The system intelligently identifies cyclical turning points, then employs a feedback-driven approach to capital allocation—reinforcing successful momentum with pyramiding while deploying controlled defensive averaging during temporary setbacks. By anchoring its exit mechanism to dynamically updated market structure rather than static profit targets, the algorithm seeks to capture cyclical momentum while maintaining disciplined risk parameters. This research-driven approach represents an evolution toward state-aware algorithmic systems that adapt their tactics in real-time based on market phase recognition.

Bli-Rik - IndicesIndices - uses : EMA Stack + RSI (Strong & Soft Signals) to predict buy and sell in Indian indices

MA-breakout signal (Skull).V1
MA-breakout signal (이평선 돌파 시그널) - V1
역배열에서 정배열 돌파시 -그린 스컬
정배열에서 역배열 돌파시 -레드 스컬
일목구름 완전 돌파시 - 배경 스컬
Moving average line breakout signal
/GREEN Skull /RED Skull
Ichimoku Cloud completely - Background Skull

HaP MACDHaP MACD - Advanced DEMA Assisted Signal Indicator
Overview
The HaP MACD is an evolution of the classic MACD, designed for traders who demand faster response times and clearer trend visualisations. By integrating DEMA (Double Exponential Moving Average) logic into the standard MACD framework, this indicator filters out noise and highlights momentum shifts with a unique color-coded dot system.
How It Works
The indicator calculates two types of MACD: a standard one for the main lines and a DEMA-based one for signal generation. This dual approach ensures you stay in the trend while being alerted the moment the momentum starts to fade.
Visual Guide & Color Logic
The signal dots are placed directly on the MACD line to guide your decisions:
🔵 Blue Dot: The Entry Signal. Appears when DEMA conditions first align for a bullish move.
🟢 Green Dot: Strong Momentum. The trend is active and the MACD value is increasing.
🟠 Orange Dot: Warning Signal. The bullish trend is still active, but the momentum is slowing down (MACD is lower than the previous bar).
🔴 Red Dot: Exit Signal. The bullish condition has ended. It’s time to consider closing the position or tightening stops.
Key Features
Reduced Lag: DEMA integration provides earlier signals than standard EMA-based MACDs.
Trend Monitoring: Easily distinguish between a healthy trend (Green) and a tiring trend (Orange).
Customizable: Choose between EMA and SMA for both the oscillator and signal calculations.
Crossover Markers: Optional triangle markers for classic MACD crossovers (can be enabled in settings).

My multiple MAs📈 My Multiple MAs — Multi-Timeframe Adaptive Moving Average
MY-MA is a multi-timeframe moving average indicator designed to help traders clearly identify trend direction, market cycles, and dynamic support & resistance using advanced MA logic.
This indicator combines Higher Timeframe Moving Averages with adaptive curve visualization, making it especially useful for swing trading, trend following, and market structure analysis.
🔹 Key Features
✅ Multi-Timeframe Moving Averages
- Plot moving averages from higher timeframes (e.g. 4H, 1D) directly on your current chart
- See the real trend context without switching timeframes
✅ Advanced MA Types
- Supports LMA (Least Moving Average) for smoother trend tracking
- Optional HIG / custom MA logic for cycle detection and turning points
✅ Market Cycle Visualization
- Curved MA behavior helps highlight trend expansion, exhaustion, and reversals
- Color-coded curves make bullish vs bearish phases easy to read
✅ Dynamic Price Labels
- Automatically displays MA price levels on the chart
- Helps identify key reaction zones and confluence areas
✅ Highly Customizable
- Control timeframe, MA length, source price, and offsets
- Toggle labels and lines independently for a clean chart
🔹 How to Use
- Above MA & rising → Bullish trend bias
- Below MA & falling → Bearish trend bias
- Price reacting near higher-TF MA → Potential support/resistance
- Curve flattening or bending → Possible trend exhaustion or reversal
- Best used together with price action, volume, or structure confirmation.
⚠️ Disclaimer
This indicator is a technical analysis tool only and does not provide financial advice. Always use proper risk management and confirmation before entering trades.


cd_VW_CxOverview
The cd_VW_Cx is a sophisticated trend analysis tool designed to quantify market momentum using Multi-Period VWAP (Volume Weighted Average Price). Unlike standard indicators, this script evaluates the current price relationship across multiple historical VWAP anchors to generate a real-time "Confidence Score" ranging from -100 to +100.
💡 Key Features
• Dynamic Anchoring: Seamlessly switch between Daily, Weekly, or Monthly open anchors to align with your trading style (Scalping, Day Trading, or Swing).
• Algorithmic Scoring (The Score Box): The indicator compares the current VWAP against historical periods.
o Score > +70: Strong Bullish Momentum.
o Score < -70: Strong Bearish Momentum.
• Polyline Rendering: Utilizes Pine Script v6’s advanced polyline architecture for high-performance, sleek visual plotting that doesn't clutter your chart.
• Institutional Support/Resistance: Historical VWAP levels are color-coded, often acting as "invisible" magnetic zones where institutional orders are clustered.
🛠 How to Trade with cd_VW_Cx
1. Momentum Confirmation: Look for the Score Box to turn Teal (Bullish) or Red (Bearish). This indicates that the current trend has statistical backing from multiple previous sessions.
2. The Breakout Signal: The script tracks price crossovers of the current VWAP. A "Bullish Breakout" combined with a high score is a high-probability entry signal.
3. Visual Guidance: Use the custom labels to identify which specific day/week/month’s VWAP is currently being tested as support or resistance.
⚙️ Customizable Settings
• Anchor Selection: Choose the calculation basis (Daily, Weekly, Monthly).
• Thresholds: Adjust the sensitivity of the Bullish/Bearish alerts (Default is +/- 70).
• Visuals: Full control over table positioning, font sizes, and color palettes to match your chart theme.
📢 cd_VW_Cx: Multi-Period VWAP Scoring & Analysis Guide
🔍 Overview & Visual Logic
The labels next to the VWAP levels dynamically change based on your Anchor selection:
• Daily Open: Displays the Day Name (e.g., Monday, Tuesday).
• Weekly Open: Displays the Week Number (1 – 52).
• Monthly Open: Displays the Month Number (1 – 12).
•
General View:
________________________________________
🚦 How to Filter & Track Your Assets
You can monitor your favorite assets using two powerful methods:
1. Real-Time Alerts
Stay updated with TradingView notifications:
• Per Asset: Track a single pair.
• Watchlist Basis: Monitor your entire list at once. Alert Setup Guide:
2. Pine Screener Integration
Filter the market effortlessly using the Pine Screener. Pine Screener View:
________________________________________
⚙️ Settings & Configuration
• Timeframe Selection: Your chart timeframe must be lower than the selected Anchor timeframe. (e.g., If "Daily Open" is selected, the timeframe should be lower than 1D).
• Anchor Choice: Select Daily, Weekly, or Monthly opens.
• Source Selection: Default value is set to ohlc4. Source Settings:
Filtering Criteria Examples:
• Bullish Filtering: Find assets with high momentum scores.
• Bullish Breakout (Single Criteria): Filters assets that have closed above the current VWAP level.
• Combined Strength (Score + Breakout): Filters assets that have a Score > 70 AND a fresh VWAP Breakout simultaneously.
________________________________________
⚠️ Important Notes & Warnings
• Calculation Logic: The indicator calculates levels and scores on timeframes lower than the anchor. It is best used on timeframes that are close to but lower than the anchor.
• Avoid Extreme Gaps: Using a very low timeframe (e.g., 1m) with a very high anchor (e.g., Monthly) increases the risk of erroneous results.
• Optimization: The default score threshold of 70 is a starting point; I recommend adjusting it based on your own trading experience.
• The Power of Confluence: VWAP levels are naturally strong. Their significance increases when they coincide with institutional levels like PDH (Previous Day High), Session H/L, or HTF FVG.
• Experience Matters: A high score alone is not enough for an entry. Always combine this data with your personal strategy.
________________________________________
💬 Community & Feedback
I would love to hear your suggestions regarding the scoring logic or visual improvements! Feel free to share your thoughts in the comments.
Happy Trading! 🚀

ATR + Moving AverageThis indicator shows a manually calculated Average True Range (ATR) along with a moving average of the ATR.
The ATR measures current candle volatility.
The ATR Moving Average shows the average candle size over the selected period.
Both can use different smoothing types (RMA, SMA, EMA, WMA) for flexibility.
It’s useful for seeing when price is stretched, volatility is expanding or contracting, and for higher-timeframe mean-reversion analysis.

BBMA by RWBTradeLabBBMA by RWBTradeLab
A clean, non-repainting BBMA indicator built for traders who combine Bollinger Bands with Linear Weighted Moving Averages and EMA to track volatility expansion, price extremes, and confirmed breakout behavior using closed candles only.
What this indicator does
This script combines Bollinger Bands (20, 2) with Linear Weighted Moving Averages (LWMA) and a 50 EMA to help traders identify high-probability price extension zones and confirmed BBMA break conditions—without repainting.
All calculations and alerts are based strictly on closed candles (no running-bar signals).
Core components
Bollinger Bands
*Period: 20
*Deviations: 2
*Apply to: Close
*Visual shift supported (default 0)
*Clean white band structure for clarity
Linear Weighted Moving Averages (LWMA)
*LW MA 5 Low
*LW MA 10 Low
*LW MA 5 High
*LW MA 10 High
These weighted averages react faster to recent price action and help define dynamic BBMA zones.
Exponential Moving Average
*EMA 50
*Apply to: Close
*Method: Exponential
Used as a higher-timeframe trend and structure reference.
BBMA alert logic (closed candle only)
Lower BBMA Break
Triggered when:
*LW MA 5 Low crosses below the Lower Bollinger Band
*The candle closes below the Lower Bollinger Band
*LW MA 5 Low remains below the Lower Bollinger Band after close
Upper BBMA Break
Triggered when:
*LW MA 5 High crosses above the Upper Bollinger Band
*The candle closes above the Upper Bollinger Band
*LW MA 5 High remains above the Upper Bollinger Band after close
⚠️ No alerts are generated on running candles—only on confirmed bar close.
Visuals on chart
*Bollinger Bands plotted in clean white
*LW MAs color-coded for easy distinction
*EMA 50 plotted in green
*Optional show/hide toggles for BB, LW MAs, and EMA
Alerts
Built-in alerts trigger only on candle close:
*BBMA Lower Break (confirmed)
*BBMA Upper Break (confirmed)
Designed for reliable discretionary trading and automation without repainting issues.
Key settings
*BB Period & Deviations
*LW MA periods (5 & 10, High / Low)
*EMA period
*Visual shift for Bollinger Bands
*Individual visibility toggles
Non-repainting confirmation
All calculations, plots, and alerts are based on confirmed candles only.
No running-bar logic → no repainting.
Disclaimer
This indicator is a technical analysis tool, not financial advice.
Trading involves risk—always use proper risk management and confirm signals with your own analysis.
Creator: RWBTradeLab
If you find this indicator useful, please leave a like ⭐ and share your feedback.

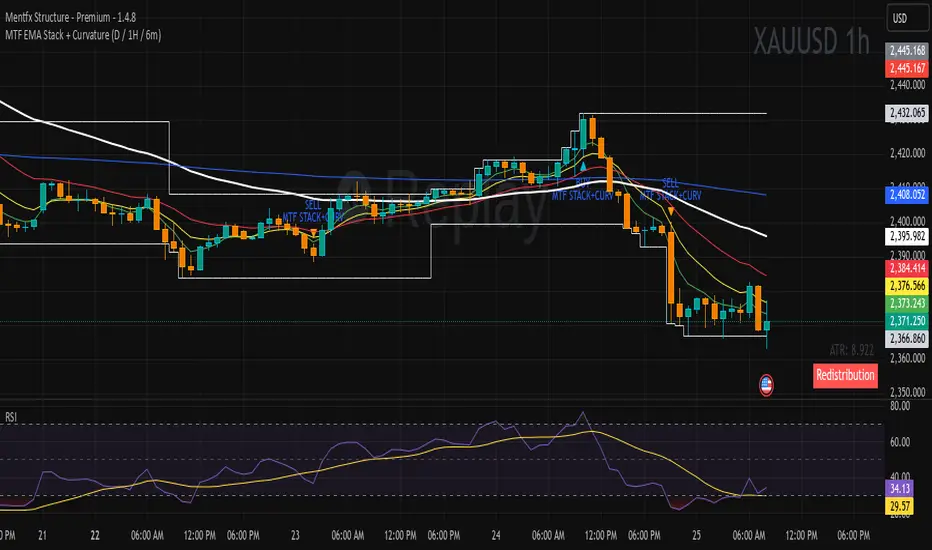
MTF EMA Stack + Curvature (D / 1H / 6m)Purpose of the Indicator
The MTF EMA Stack + Curvature Indicator is a trend-alignment confirmation tool.
Its goal is to identify high-probability trend continuation setups by requiring all of the following to agree:
Trend direction (EMA stacking)
Trend strength / acceleration (EMA curvature)
Multi-timeframe alignment (Daily, 1-Hour, and 6-Minute) with you can change to your preference
Instead of reacting to short-term noise, the indicator only signals when institutional-style trend structure is aligned across time frames.
ARDO (v2.4.7) Moving Averages v1.1ARDO Moving Averages v1.1 (Overlay)
Companion overlay that recreates ARDO driver states (Spreads A/B, LinReg state + slope/gradient, tiers/MK tiers, gate pass/block) and maps those states onto up to 5 moving average overlays + one optional MA-to-MA fill.
ARDO v2.4.6 (original indicator)
What this overlay does
Computes ARDO “driver states” internally (no external source required): Spread A, Spread B, LinReg (4-state), LinReg slope/accel → gradient opacity, quartile/tier regimes, MK tiers, and Gate pass/block.
Paints MA overlays using selectable “Color Modes” (Spread A, Spread B, ARDO LinReg, MK Tier, Quartile Background, Gate Pass, Bull/Bear A vs B, or Fixed).
Optional Fill between two overlay MAs using a selected color mode (intended for regime/bull-bear shading between MA lines).
Core concepts (quick read)
Baseline / MA A / MA B define Spread A and Spread B (% distance vs baseline).
LinReg is a regression of a selected source (Spread A, Spread B, or Spread(A+B)).
LinReg State (4 colors) is derived from slope sign and acceleration (trend speeding up vs slowing down): Green / Orange / Red / Gray.
Gradient Opacity scales line opacity based on slope magnitude (strong vs weak).
Tier / Quartile maps current regime into bins (Q0–H4) using rolling percentiles (or manual thresholds).
MK Tier is an alternate tier engine (Standard / Asymmetric / Mirror BG).
Gate is a boolean pass/block that can combine spread and trend requirements (optional).
How to set it up (recommended workflow)
Pick ARDO Core MAs (Baseline, MA A, MA B) and your main LinReg Source.
Tune LinReg Length + Gradient Scale to match your timeframe (shorter = faster flips, longer = smoother).
Decide Tier mode (Standard vs Asymmetric) and whether tiers use All Bars or Pivots Only .
Set up Gate (or leave off): use it as a “permission layer” for entries.
Configure your overlay MAs (1–5) and assign each a Color Mode aligned to its job:
MA1 = fast impulse (often Spread A)
MA2 = trend state (often ARDO LinReg)
MA3 = slower confirmation (often Spread B)
MA4 = gate/permission readout (Gate Pass)
MA5 = regime (MK Tier)
Enable Fill only if you want regime shading between two MAs (keep it simple: one fill only).
Inputs explained (by group)
1) Sources & Moving Averages (ARDO Core)
Price Source : price used for MA calculations (default close).
Baseline MA Type/Length : reference MA for spreads.
MA A Type/Length : “A” spread driver (usually faster).
MA B Type/Length : “B” spread driver (often slower fast MA).
EMA Fast / EMA Slow : used only if the EMA gate toggle is enabled.
2) Linear Regression & Gradient
LinReg Length : lookback used by regression.
LinReg Source : Spread A, Spread B, or Spread(A+B).
Slope Lookback : bars used to compute slope as (linreg - linreg ) / n.
Adaptive Opacity Scale : derives slope “cap” from a rolling percentile (reduces volatility-regime distortion).
Fixed Scale Cap : used if adaptive scaling is off.
Min/Max Opacity : clamps gradient range.
3) Tiers & Population
Tier Mode : Standard vs Asymmetric (changes percentile boundary logic).
Tier Population : All Bars vs Pivots Only.
Manual Thresholds : if enabled, uses user cutoffs instead of computed percentiles.
Auto-Percentile Window : rolling window size for percentiles.
4) Region Rendering (BG / regime palette)
BG colors for Q0/Q1/Q2/Q3/Q4/H4 : the palette used for “Quartile Background” color mode and MK “Mirror BG”.
Pivot Sensitivity : relevant only for Pivots Only population.
5) Gate (Pass/Block)
Gate: SpreadA > LinReg (toggle)
Gate: EMA Fast > EMA Slow (toggle)
Min Spread A (%)
Min |LinReg Slope|
Gate PASS/BLOCK colors : also used by Gate Pass color mode.
6) Overlay Moving Averages (MA1–MA5)
MA Len / Type : SMA, EMA, WMA, Wilder, Triangular, HMA, Adaptive.
Color Mode :
Fixed
ARDO Spread A
ARDO Spread B
ARDO LinReg (4-state + gradient opacity)
MK Tier
Quartile Background (Q0–H4 palette)
Gate Pass
Bull/Bear (A vs B)
Base Color : used for Fixed (and as fallback).
Line Width
Style (if present): line / stepline / markers depending on the MA slot.
Bull/Bear (A vs B) definition
Bull when MA A > MA B
Bear when MA A < MA B
Alerts (built-in alertconditions in v1.1)
Spread A State
State changed (any change)
Turned Green / Orange / Red / Gray
LinReg State
State changed (any change)
Turned Green / Orange / Red / Gray
LinReg Gradient
Gradient High (slope strength high)
Gradient Low (slope strength low)
Gate
Gate Pass ON
Gate Pass OFF
Bull/Bear Flip
Bullish flip (A crosses above B)
Bearish flip (A crosses below B)
Tier / Quartile
Entered Q0
Entered Q1
Entered H3
Entered H4
Simple Alignment
LinReg Green AND SpreadA Green (basic “momentum aligned” condition)
How to use Gate (and how to loosen/tighten it)
Use Gate as a filter , not as the entire strategy: it’s best as “permission to trade” plus your own trigger.
If Gate is too strict :
Disable EMA Fast > EMA Slow gate (trend filter) OR disable SpreadA > LinReg gate (structure filter).
Lower Min Spread A threshold.
Lower Min |LinReg Slope| threshold.
Increase LinReg Length slightly to reduce noisy flips (sometimes helps pass stability).
If Gate is too loose :
Enable both gate components (SpreadA>LinReg AND EMA Fast>Slow).
Raise Min Spread A and/or Min |LinReg Slope|.
Shorten LinReg Length to react faster (but can increase chop).
Practical “read” using the default overlay roles
MA1 (fast, Spread A mode) : impulse / early acceleration cues.
MA2 (trend, LinReg mode) : regime + momentum state; opacity tells you strength.
MA3 (confirmation, Spread B) : slower confirmation; helps avoid “one-candle impulse traps”.
MA4 (Gate Pass) : permission layer; reduces counter-trend entries.
MA5 (MK Tier) : regime band; helps distinguish “deep OS/OB context” vs mid-zone noise.
Notes
This is an overlay; it’s designed to complement the original ARDO oscillator pane.

Shock Wave: EMA9 Slope / ATR (Normalized) for SPYShock Wave – EMA9 Slope Normalized by ATR (Fragility Gauge)
This indicator measures trend fragility, not direction.
Instead of relying on visual trendline angles (which change with zoom and chart scaling), this tool normalizes the slope of the 9-EMA by ATR, producing a scale-independent steepness metric that remains consistent across timeframes and zoom levels.
The goal is to identify late-stage acceleration and liquidity vulnerability — conditions where price is advancing faster than inventory can rebalance and the market becomes sensitive to forced liquidation.
What this indicator shows
Normalized EMA9 slope (ATR per bar)
An angle-like degree value derived from the normalized slope (for intuition only)
Background shading to highlight trend maturity / fragility
A compact table showing live readings on the chart
How to interpret
Green / low values (< ~0.30 ATR/bar): Healthy, sustainable trend
Orange / mid values (~0.30–0.40 ATR/bar): Late-stage acceleration
Red / high values (≥ ~0.45 ATR/bar): Fragile / liquidation-prone conditions
These thresholds are empirically derived from historical index behavior (e.g., SPY prior to 2018, 2020, 2022 volatility events).
Important notes
This is not a buy or sell signal
Red does not mean “short”
The indicator highlights risk asymmetry, not timing
Best used on higher timeframes (weekly) in conjunction with liquidity, inducement, and higher-timeframe structure analysis
Why use this
Markets often fail after strong trends, not because they are weak, but because they are crowded. This tool helps quantify when a trend has become structurally vulnerable, providing context for liquidity-based frameworks and macro risk management.

TRS (Trend Readiness System)TRS – Trend Readiness System
TRS (Trend Readiness System) is a trend-aligned trading framework designed to help you identify stocks that are becoming ready for entry , not just those already breaking out.
Instead of producing noisy buy/sell signals, TRS evaluates trend quality, pullback structure, momentum rebuilding, and market context , and converts them into clear scores, states, and timing awareness — both on the chart and inside the TradingView Screener.
---
Core Philosophy
Strong trends don’t start at the breakout — they start when conditions quietly align.
TRS focuses on:
• Primary trend alignment
• Healthy pullbacks above long-term support
• Early momentum recovery
• Market regime confirmation
• Entry timing (fresh vs late)
---
What TRS Measures
1. Setup Score (Trend Quality)
Answers the question: “Is this stock structurally worth watching?”
Based on:
• Price position relative to MA150
• Long-term trend direction
• Higher-low structure
• Distance from MA150 (overextension control)
• Market regime (bullish / bearish)
---
2. Entry Score (Timing Quality)
Answers the question: “Is the timing right — or still early?”
Based on:
• Short and mid-term moving averages
• Pullback behavior
• Momentum stabilization
• Volume confirmation
---
3. General Score
A combined readiness score used for ranking in the TradingView Screener:
General Score = Setup Score + Entry Score
---
Entry State Tracking (Key Feature)
TRS tracks the full entry lifecycle , not just signals:
• Valid Entry
• Pending Entry (almost ready)
• Bars Since Valid Entry
• Entry Window (Fresh / Expired)
• Entry Still Valid (Yes / No)
This helps avoid chasing late or already-played setups.
---
Market Regime Filter
Signals automatically adapt to overall market conditions:
• Market trend confirmation (e.g. SPY / QQQ)
• Reduced false signals during weak markets
• Clear explanation when setups are blocked
---
Visual Dashboard (Optional)
The on-chart dashboard can display:
• General Score
• Market state
• Setup quality
• Entry status
• Entry window
• Bars since entry
• Blocking reason (if any)
You can switch between:
• Minimal mode – essential info only
• Full table mode – detailed diagnostics
---
Screener Integration
TRS exposes clean numeric outputs for the TradingView Pine Screener:
• Setup Score
• Entry Score
• General Score
• Pending Entry (1 / 0)
• Valid Entry (1 / 0)
• Bars Since Valid Entry
• Market Bullish (1 / 0)
Example Screener Filters:
• Setup Score ≥ 50
• Pending Entry = 1
• Bars Since Valid Entry ≤ 3
• Market Bullish = 1
---
How to Use TRS (Daily Routine)
Step 1 – Scan
• Look for high Setup Score
• Prefer Pending Entry = 1
Step 2 – Review
• Confirm pullback quality
• Check MA150 support
• Observe momentum rebuilding
Step 3 – Act
• Enter only on Valid Entry
• Avoid expired entry windows
• Skip setups blocked by market regime
---
What TRS Is NOT
• Not a breakout chaser
• Not a day-trading system
• Not signal spam
TRS is a decision-support system for swing and position traders who value structure, context, and timing.
---
Best Used On
• Daily timeframe (1D)
• Liquid stocks & ETFs
• Trend-following strategies
• Portfolio-level screening
---

EAOverview
The provided Pine Script code implements a technical analysis indicator known as the UT Bot Alerts. It is a volatility-based trend-following system designed to generate Buy and Sell signals. It uses the Average True Range (ATR) to calculate a dynamic trailing stop line, which helps identify trend reversals.
Key Components & Logic
1. Inputs (User Settings):
• Key Value (a): A sensitivity multiplier. A lower value makes the signals more frequent (sensitive), while a higher value filters out noise (less sensitive).
• ATR Period (c): The timeframe used to calculate the Average True Range (volatility). Default is 10.
• Heikin Ashi (h): A boolean switch (True/False) that allows calculations to be based on Heikin Ashi candles (smoother price action) instead of standard candlesticks.
2. Core Mechanism (ATR Trailing Stop):
• The script calculates an ATR Trailing Stop (xATRTrailingStop).
• Uptrend: If the price is rising, the stop line moves up but never moves down, acting as dynamic support.
• Downtrend: If the price is falling, the stop line moves down but never moves up, acting as dynamic resistance.
3. Signal Generation:
• Buy Signal: Generated when the price (specifically a 1-period EMA) crosses above the Trailing Stop line. This indicates a shift to an uptrend.
• Sell Signal: Generated when the price crosses below the Trailing Stop line. This indicates a shift to a downtrend.
4. Visuals & Alerts:
• Labels: It plots "Buy" (Green) and "Sell" (Red) labels on the chart at the point of the signal.
• Bar Colors: It colors the candlesticks Green during an uptrend and Red during a downtrend.
• Alerts: It creates alert conditions (UT Long and UT Short) that can be hooked into TradingView's alarm system for real-time notifications.
Summary
In short, this script is a Trend Reversal Indicator. It helps traders stay in a trade as long as the price remains on the correct side of the volatility-adjusted trailing stop, and it alerts them immediately when the trend direction changes.

MTF TPSL Scalper System TP/SL Integration [TheScalpingAnt]MTF TPSL Scalper System TP/SL Integration
Credit: Aballard11 (Original Moving Average Shaded Fill Area Crossover Concept & Foundation) Developed / Implemented by: The Scalping Ant
OVERVIEW
MTF-TPSL Enhanced is a professional multi-timeframe TradingView indicator engineered to align macro market bias with micro execution timing, while simultaneously delivering visual trade management via integrated Take-Profit and Stop-Loss projections.
It is a complete execution framework:
• Macro context before entry
• Clean directional bias
• Precision entry timing
• Disciplined risk visualization
Built using an advanced dual-EMA fill model, MTF-TPSL filters noise, aligns directional momentum, and helps traders execute only high-probability opportunities. Whether you are scalping, day trading, or swing trading, this tool delivers the clarity and confidence required for professional-grade decision making.
Works on Forex, Crypto, Indices, Stocks, and Futures on any liquid market.
CORE CONCEPTS
MTF-TPSL is structured around three professional trading pillars:
1) Macro Bias (Higher-Timeframe Context)
A customizable higher-timeframe moving average defines directional bias:
• Bullish macro → long focus
• Bearish macro → short focus
This reduces counter-trend trades and improves directional consistency.
2) Micro Structure (Execution Layer)
On your trading timeframe, the system uses two EMA fill zones:
• EMA Fill 2 → Trend confirmation layer
• EMA Fill 1 → Precision entry timing layer
Signals are generated only when momentum, structure, and macro bias align, significantly improving execution quality.
3) Integrated TP/SL Visualization
Built-in trade projection tools allow you to:
• Input a manual entry price
• Visualize structured Stop-Loss placement
• Project one or multiple Take-Profit levels
This encourages planned trades, not emotional trades.
KEY FEATURES
Multi-Timeframe Intelligence
• Independent Macro and Micro engines
• Adjustable Macro MA length & type (SMA / EMA / WMA / VWMA)
• Dynamic higher-timeframe background bias visualization
Advanced Entry Logic
• Standard EMA alignment + crossover confirmation
• Optional Early Reversal Detection (captures momentum shifts before lagging crossovers)
• Optional Wait-For-Candle-Close confirmation filter
Trade earlier when aggressive. Trade later when conservative. You decide.
Signal Matrix (Optional Professional HUD)
• Real-time validation of Macro + Micro conditions
• Explains why a signal prints or does not
• Excellent for learning, strategy discipline, and confidence building
Signal Matrix – How to Read It
The Signal Matrix does not simply tell you if the market is bullish or bearish. It separates market context from execution timing, which prevents traders from entering too late or during weak signals.
The matrix has two roles:
1️⃣ Market Context (Trend Alignment)
• Macro Trend = Higher-timeframe bias
• EMA Fill 2 = Micro trend confirmation
• EMA Fill 1 = Short-term execution layer
If these are Bullish, the market has bullish structure.
If these are Bearish, the market has bearish structure.
This tells you the environment, not the entry.
2️⃣ Result (Signal Decision)
“Result” only shows LONG or SHORT when a valid trade setup is actually triggered.
A signal requires:
• Macro Trend aligned
• EMA Fill 2 aligned
• EMA Fill 1 alignment
• PLUS a trigger event
o EMA crossover or
o EMA color-shift reversal (if enabled)
o and optionally, candle close confirmation if selected
So you may sometimes see:
• Macro Trend → Bullish
• EMA Fill 2 → Bullish
• EMA Fill 1 → Bullish
• Result → NO SIGNAL
This is correct and intentional.
It means:
The market is bullish, but there is no fresh trade entry yet.
The indicator avoids late entries and only signals when a new high-probability setup forms.
If “Wait for Candle Close” is enabled, signals will only confirm after the bar closes to reduce noise and false entries.
Interpretation Summary
• Bullish + NO SIGNAL = Market is bullish, wait for entry trigger
• Bearish + NO SIGNAL = Market bearish, wait for entry trigger
• LONG = Valid bullish entry setup detected
• SHORT = Valid bearish entry setup detected
This keeps trading disciplined, structured, and prevents emotional entries.
Visual Trade Management
• Dynamic TP/SL Projection System
• Automatically plots:
– Entry reference
– Stop Loss
– TP / TP1 / TP2 levels
• Professional clean color coding
• Works for both Long and Short execution
You do not just enter trades—you execute structured plans.
CUSTOMIZATION
MTF-TPSL adapts to any trading style.
Macro Settings
• Select timeframe (example: 4H or Daily)
• Choose MA type
• Adjust sensitivity
Micro Execution Settings
• Two EMA Fill systems
• Adjustable fast/slow lengths
• Precision momentum logic
Signal Behavior
• Enable Early Reversal Detection
• Enable Candle Close Confirmation
• Toggle entry labels
• Toggle background bias
Risk Settings
• Manual entry input
• Direction selection (Long / Short)
• TP %, TP1 %, TP2 %
• Stop Loss %
• Fully visualized execution roadmap
Everything is transparent. Everything is trader-controlled.
USAGE – HOW TO TRADE WITH IT
1️⃣ Identify Macro Bias
Background color instantly shows market context.
2️⃣ Wait for Micro Alignment
EMA Fill 2 confirms trend
EMA Fill 1 provides execution timing
3️⃣ Enter on Confirmed Signal
LONG or SHORT label appears only when rules align.
4️⃣ Manage Risk Professionally
Activate TP/SL projection
Plan targets
Control risk
This workflow promotes discipline, patience, and consistency.
EXAMPLE SCENARIO
Bullish Setup Example
• Macro timeframe closes above macro MA → bullish bias
• EMA Fill 2 turns bullish → structure confirmed
• EMA Fill 1 shifts bullish → execution timing
• LONG signal appears
• Entry, Stop Loss, TP, TP1, TP2 are automatically visualized
Result:
A clean, structured trade aligned with higher-timeframe direction and supported by visual risk structure.
SETTINGS SUMMARY
Macro Controls
• Timeframe
• MA length & type
Micro Controls
• EMA Fill configurations
• Sensitivity tuning
Signal Filters
• Early Reversal toggle
• Candle Close confirmation
Visual Tools
• Background bias
• Entry labels
• Signal Matrix
Risk Engine
• Entry price
• Direction
• TP / TP1 / TP2
• SL
CONCLUSION
MTF-TPSL Enhanced delivers:
• Higher-timeframe clarity
• Precise execution logic
• Professional trade management
• Customizable flexibility
• Clean presentation and usability
In a world full of distractions, MTF-TPSL provides a structured, disciplined, and professional trading framework. It merges Trend + Momentum + Risk Management into one seamless execution system.
If you want to trade with confidence, structure, and real strategic clarity, this indicator is built for you.
DISCLAIMER
This is an analytical tool, not financial advice.
Trading involves risk and no indicator guarantees results.
Always backtest, practice risk management, and never risk more than you can afford to lose.
Liquidity Maxing [JOAT]Liquidity Maxing - Institutional Liquidity Matrix
Introduction
Liquidity Maxing is an open-source strategy for TradingView built around institutional market structure concepts. It identifies structural shifts, evaluates trades through multi-factor confluence, and implements layered risk controls.
The strategy is designed for swing trading on 4-hour timeframes, focusing on how institutional order flow manifests in price action through structure breaks, inducements, and liquidity sweeps.
Core Functionality
Liquidity Maxing performs three primary functions:
Tracks market structure to identify when control shifts between buyers and sellers
Scores potential trades using an eight-factor confluence system
Manages position sizing and risk exposure dynamically based on volatility and user-defined limits
The goal is selective trading when multiple conditions align, rather than frequent entries.
Market Structure Engine
The structure engine tracks three key events:
Break of Structure (BOS): Price pushes beyond a prior pivot in the direction of trend
Change of Character (CHoCH): Control flips from bullish to bearish or vice versa
Inducement Sweeps (IDM): Market briefly runs stops against trend before moving in the real direction
The structure module continuously updates strong highs and lows, labeling structural shifts visually. IDM markers are optional and disabled by default to maintain chart clarity.
The trade engine requires valid structure alignment before considering entries. No structure, no trade.
Eight-Factor Confluence System
Instead of relying on a single indicator, Liquidity Maxing uses an eight-factor scoring system:
Structure alignment with current trend
RSI within healthy bands (different ranges for up and down trends)
MACD momentum agreement with direction
Volume above adaptive baseline
Price relative to main trend EMA
Session and weekend filter (configurable)
Volatility expansion/contraction via ATR shifts
Higher-timeframe EMA confirmation
Each factor contributes one point to the confluence score. The default minimum confluence threshold is 6 out of 8, but you can adjust this from 1-8 based on your preference for trade frequency versus selectivity.
Only when structure and confluence agree does the strategy proceed to risk evaluation.
Dynamic Risk Management
Risk controls are implemented in multiple layers:
ATR-based stops and targets with configurable risk-to-reward ratio (default 2:1)
Volatility-adjusted position sizing to maintain consistent risk per trade as ranges expand or compress
Daily and weekly risk budgets that halt new entries once thresholds are reached
Correlation cooldown to prevent clustered trades in the same direction
Global circuit breaker with maximum drawdown limit and emergency kill switch
If any guardrail is breached, the strategy will not open new positions. The dashboard clearly displays risk state for transparency.
Market Presets
The strategy includes configuration presets optimized for different market types:
Crypto (BTC/ETH): RSI bands 70/30, volume multiplier 1.2, enhanced ATR scaling
Forex Majors: RSI bands 75/25, volume multiplier 1.5
Indices (SPY/QQQ): RSI bands 70/30, volume multiplier 1.3
Custom: Default values for user customization
For crypto assets, the strategy automatically applies ATR volatility scaling to account for higher volatility characteristics.
Monitoring and Dashboards
The strategy includes optional monitoring layers:
Risk Operations Dashboard (top-right):
Trend state
Confluence score
ATR value
Current position size percentage
Global drawdown
Daily and weekly risk consumption
Correlation guard state
Alert mode status
Performance Console (top-left):
Net profit
Current equity
Win rate percentage
Average trade value
Sharpe-style ratio (rolling 50-bar window)
Profit factor
Open trade count
Optional risk tint on chart background provides visual indication of "safe to trade" versus "halted" state.
All visualization elements can be toggled on/off from the inputs for clean chart viewing or full telemetry during parameter tuning.
Alerts and Automation
The strategy supports alert integration with two formats:
Standard alerts: Human-readable messages for long, short, and risk-halt conditions
Webhook format: JSON-formatted payloads ready for external execution systems (optional)
Alert messages are predictable and unambiguous, suitable for manual review or automated forwarding to execution engines.
Built-in Validation Suite
The strategy includes an optional validation layer that can be enabled from inputs. It checks:
Internal consistency of structure and confluence metrics
Sanity and ordering of risk parameters
Position sizing compliance with user-defined floors and caps
This validation is optional and not required for trading, but provides transparency into system operation during development or troubleshooting.
Strategy Parameters
Market Presets:
Configuration Preset: Choose between Crypto (BTC/ETH), Forex Majors, Indices (SPY/QQQ), or Custom
Market Structure Architecture:
Pivot Length: Default 5 bars
Filter by Inducement (IDM): Default enabled
Visualize Structure: Default enabled
Structure Lookback: Default 50 bars
Risk & Capital Preservation:
Risk:Reward Ratio: Default 2.0
ATR Period: Default 14
ATR Multiplier (Stop): Default 2.0
Max Drawdown Circuit Breaker: Default 10%
Risk per Trade (% Equity): Default 1.5%
Daily Risk Limit: Default 6%
Weekly Risk Limit: Default 12%
Min Position Size (% Equity): Default 0.25%
Max Position Size (% Equity): Default 5%
Correlation Cooldown (bars): Default 3
Emergency Kill Switch: Default disabled
Signal Confluence:
RSI Length: Default 14
Trend EMA: Default 200
HTF Confirmation TF: Default Daily
Allow Weekend Trading: Default enabled
Minimum Confluence Score (0-8): Default 6
Backtesting Considerations
When backtesting this strategy, consider the following:
Commission: Default 0.05% (adjustable in strategy settings)
Initial Capital: Default $100,000 (adjustable)
Position Sizing: Uses percentage of equity (default 2% per trade)
Timeframe: Optimized for 4-hour charts, though can be tested on other timeframes
Results will vary significantly based on:
Market conditions and volatility regimes
Parameter settings, especially confluence threshold
Risk limit configuration
Symbol characteristics (crypto vs forex vs equities)
Past performance does not guarantee future results. Win rate, profit factor, and other metrics should be evaluated in context of drawdown periods, trade frequency, and market conditions.
How to Use This Strategy
This is a framework that requires understanding and parameter tuning, not a one-size-fits-all solution.
Recommended workflow:
Start on 4-hour timeframe with default parameters and appropriate market preset
Run backtests and study performance console metrics: focus on drawdown behavior, win rate, profit factor, and trade frequency
Adjust confluence threshold to match your risk appetite—higher thresholds mean fewer but more selective trades
Set realistic daily and weekly risk budgets appropriate for your account size and risk tolerance
Consider ATR multiplier adjustments based on market volatility characteristics
Only connect alerts or automation after thorough testing and parameter validation
Treat this as a risk framework with an integrated entry engine, not merely an entry signal generator. The risk controls are as important as the trade signals.
Strategy Limitations
Designed for swing trading timeframes; may not perform optimally on very short timeframes
Requires sufficient market structure to identify pivots; may struggle in choppy or low-volatility environments
Crypto markets require different parameter tuning than traditional markets
Risk limits may prevent entries during favorable setups if daily/weekly budgets are exhausted
Correlation cooldown may delay entries that would otherwise be valid
Backtesting results depend on data quality and may not reflect live trading with slippage
Design Philosophy
Many indicators tell you when price crossed a moving average or RSI left oversold. This strategy addresses questions institutional traders ask:
Who is in control of the market right now?
Is this move structurally significant or just noise?
Do I want to add more risk given what I've already done today/week?
If I'm wrong, exactly how painful can this be?
The strategy provides disciplined, repeatable answers to these questions through systematic structure analysis, confluence filtering, and multi-layer risk management.
Technical Implementation
The strategy uses Pine Script v6 with:
Custom types for structure, confluence, and risk state management
Functional programming approach for reusable calculations
State management through persistent variables
Optional visual elements that can be toggled independently
The code is open-source and can be modified to suit individual needs. All important logic is visible in the source code.
Disclaimer
This script is provided for educational and informational purposes only. It is not intended as financial, investment, trading, or any other type of advice or recommendation. Trading involves substantial risk of loss and is not suitable for all investors. Past performance, whether real or indicated by historical tests of strategies, is not indicative of future results.
No representation is being made that any account will or is likely to achieve profits or losses similar to those shown. In fact, there are frequently sharp differences between backtested results and actual results subsequently achieved by any particular trading strategy.
The user should be aware of the risks involved in trading and should trade only with risk capital. The authors and publishers of this script are not responsible for any losses or damages, including without limitation, any loss of profit, which may arise directly or indirectly from use of or reliance on this script.
This strategy uses technical analysis methods and indicators that are not guaranteed to be accurate or profitable. Market conditions change, and strategies that worked in the past may not work in the future. Users should thoroughly test any strategy in a paper trading environment before risking real capital.
Commission and slippage settings in backtests may not accurately reflect live trading conditions. Real trading results will vary based on execution quality, market liquidity, and other factors not captured in backtesting.
The user assumes full responsibility for all trading decisions made using this script. Always consult with a qualified financial advisor before making investment decisions.
Enjoy - officialjackofalltrades

EAOverview
The provided Pine Script code implements a technical analysis indicator known as the UT Bot Alerts. It is a volatility-based trend-following system designed to generate Buy and Sell signals. It uses the Average True Range (ATR) to calculate a dynamic trailing stop line, which helps identify trend reversals.
Key Components & Logic
1. Inputs (User Settings):
• Key Value (a): A sensitivity multiplier. A lower value makes the signals more frequent (sensitive), while a higher value filters out noise (less sensitive).
• ATR Period (c): The timeframe used to calculate the Average True Range (volatility). Default is 10.
• Heikin Ashi (h): A boolean switch (True/False) that allows calculations to be based on Heikin Ashi candles (smoother price action) instead of standard candlesticks.
2. Core Mechanism (ATR Trailing Stop):
• The script calculates an ATR Trailing Stop (xATRTrailingStop).
• Uptrend: If the price is rising, the stop line moves up but never moves down, acting as dynamic support.
• Downtrend: If the price is falling, the stop line moves down but never moves up, acting as dynamic resistance.
3. Signal Generation:
• Buy Signal: Generated when the price (specifically a 1-period EMA) crosses above the Trailing Stop line. This indicates a shift to an uptrend.
• Sell Signal: Generated when the price crosses below the Trailing Stop line. This indicates a shift to a downtrend.
4. Visuals & Alerts:
• Labels: It plots "Buy" (Green) and "Sell" (Red) labels on the chart at the point of the signal.
• Bar Colors: It colors the candlesticks Green during an uptrend and Red during a downtrend.
• Alerts: It creates alert conditions (UT Long and UT Short) that can be hooked into TradingView's alarm system for real-time notifications.
Summary
In short, this script is a Trend Reversal Indicator. It helps traders stay in a trade as long as the price remains on the correct side of the volatility-adjusted trailing stop, and it alerts them immediately when the trend direction changes.

JVT PERV Engine V1Its based on invite only. This is based on the moving averages and super trend signals for intraday trading. Its gives trend indicators and when to buy and when to sell. Use it at your risk. Exponential Moving Average (EMA) is a popular trend-following

EMA Ribbons
The Gray Ribbon (EMA 1–3) is designed for trend trading. When the market is trending, price tends to respect the ribbon and bounce off it. If price frequently chops through the ribbon, the market is likely ranging and the ribbon should be ignored.
The 100 EMA and 200 EMA (EMA 4 & 5) are commonly used as dynamic support and resistance levels.
EMA 6 & 7 are calculated from a higher timeframe to provide broader market context.
