Adaptive Bull Ratio Strategy█ Overview: Why This Strategy
Most option strategies fall into two traps:
They are too rigid: A "Call Ratio Spread" works great in slow markets but gets destroyed if the market rallies hard.
They are too simple: A simple "Buy Call" suffers from time decay (Theta) if the market chops sideways.
The Adaptive Bull Ratio Strategy solves both . It is a living strategy that "shifts gears" based on price action.
It is called "Adaptive" because it morphs its structure three times during a trade. It starts conservative to harvest Time Decay, but if the market explodes upwards, it "uncaps" itself to ride the trend aggressively.
█ The Entry Philosophy: Why Supertrend?
The default setting uses the Supertrend indicator as the trigger. This is intentional:
Volatility Awareness: Supertrend adapts to market noise using ATR. In high volatility, bands widen to prevent false entries.
Trend Confirmation: Since Phase 1 involves selling options, entering "too early" against a falling market is dangerous. Supertrend forces patience, waiting for a confirmed reversal (Close > Trend Line), ensuring the momentum is actually in your favor before you commit capital.
The "Drift" Benefit: This strategy excels in markets that "drift" upwards. Supertrend identifies these trends while filtering out short-term chop.
Flexibility with External Sources:
While Supertrend is the default, the strategy is designed to be flexible. You can enable the 'Enable External Source' option in the settings to plug in any custom indicator (e.g., Moving Averages, Parabolic SAR, or a proprietary trendline).
The Golden Rule for External Sources: The script interprets a Bullish Signal whenever your External Source line is below the Close price (Ext Source < Close).
Compatibility: As long as your custom indicator behaves like a support line in an uptrend (plotting below the candles), it will work seamlessly with this strategy's logic.
█ The "Long Only" Rationale: Avoiding the Volatility Trap
Why not trade this on the short side (Puts) during crashes?
The Volatility Trap (Vega Risk): In Bull markets, Implied Volatility (IV) usually drops, helping your sold options decay faster. In Bear markets, IV explodes (panic). Selling OTM Puts during a crash is dangerous as their value skyrockets, neutralizing gains.
Velocity Risk: Bear markets crash fast ("Elevator Down"). Prices can blow through adjustment levels faster than the strategy can safely roll down, causing slippage.
Structural Skew: OTM Puts are inherently more expensive. Buying expensive ITM Puts and selling expensive OTM Puts shifts the breakeven further away, making V-shape recoveries painful.
█ How It Works & Stands Out
This strategy actively transforms risk profiles based on market movement:
Phase 1: The "Safe" Start (Entry)
Setup: Initiates a Call Ratio Spread (Buy 2 ITM, Sell 4 OTM) + Protective Puts.
Logic: Profits from sideways drift or slow rallies via Time Decay (Theta). The sold options finance the trade.
Phase 2: The "Shift" (Adjustment Level 1)
Trigger: Market moves above Leg 2 (3 OTM Call).
Action: Rolls Up the position. Exits initial legs, enters new higher legs, and adds a Short Put to finance the roll.
Impact: Aggressive. You bet the trend is strong enough to support the added downside risk of the short put.
Phase 3: The "Uncap" (Adjustment Level 2)
Trigger: Market moves above Leg 3 (4 OTM Call).
Action: Exits all Sold Calls.
Impact: Uncaps profit potential. The trade becomes a Net Long position (Long Calls + Short Puts), allowing you to ride a massive rally without a ceiling.
Phase 4: The "Lock-In" (Optional Trail Adjustment)
Trigger: The market goes parabolic (price rises X levels above Leg 3, configurable in settings).
Action (If Enabled):
Call Adj: Exits the Phase 3 calls and buys fresh 1-OTM calls (Rolling Up to lock profits).
Put Adj: Exits all Put legs (Removing downside risk completely).
Impact: Maximum Safety. This phase is about "banking" the windfall from a massive rally and leaving a smaller, risk-free runner to capture any final extension.
█ How to Start: A Quick Setup Guide
Step 1: Map Expiry Dates
Manually input your trading expiry dates in Settings -> Expiry Management.
Format: YYYY-MM-DD (e.g., 2025-12-25). Strict adherence required for DhanHQ.
Step 2: Configure Symbol & Size
Exchange/Symbol: Enter NSE and NIFTY (or your ticker).
Lot Multiplier: Default is 1. Set to 2 to double all quantities (e.g., Buy 2 becomes Buy 4).
Step 3: Understand Visuals
Entry Window (Light Blue): Strategy is scanning for new trades.
Non-Entry Window (Dark Blue): Trading blocked (Day before Expiry & Expiry Day). Only management allowed.
Green Box: Valid Late Entry Zone.
Red Dashed Line: Invalidation Level (if price touches this, no late entry).
Fuchsia Line: Trigger level for Special Trail Adjustments (Phase 4).
IMPORTANT: Broker & Technology Heads-Up:
The alerts generated by this script ({"secret": "...", "alertType": "multi_leg_order"...}) are specifically formatted for the DhanHQ webhook structure.
Dhan Users: Plug-and-play.
Other Brokers: You need middleware (NextLevelBot, Quantiply) to parse the JSON.
█ Risk Disclaimer & Advice
Trading options involves substantial risk.
The Whipsaw Risk: In Phase 2, you are Long Calls and Short Puts. A sharp reversal causes losses on both sides.
Margin: Selling options requires significant margin. Keep a 15-20% cash buffer to handle adjustments instantly.
Testing: This strategy is optimized for NIFTY Weekly Options. Effectiveness on BankNifty or Stocks is untested and may require parameter tuning.
Advice:
Backtest: Use TradingView Replay.
Paper Trade: Run for at least one expiry cycle before live deployment.
Consult: Seek professional financial advice before trading.
Practical Tips for Smooth Execution
For a new trader deploying this system, these operational tips are vital:
Capital Buffer: Do not trade at your limit. Always keep 10-15% free cash in your broker account. Adjustments (specifically Phase 2, where you sell an extra Put) require additional margin instantly. If margin is short, the order fails, and your hedge breaks.
Liquidity Awareness : The script trades "Far Deep OTM" options (Leg 4) to reduce margin. On indices like Nifty/BankNifty, this is fine. On individual stocks, these deep strikes might be illiquid. Check the option chain volume before deploying on stocks.
Trust the Process (but Verify) : While the algo drives, you are the pilot.
Check your API connection every morning.
Ensure the "Entry Window" background color on the chart matches your real-world date.
Verify that your broker executed all legs of a multi-leg order (partial fills are rare but possible).
The "Human" Stop: If major news breaks (e.g., unexpected election results, war announcements), volatility can expand faster than any algo can react. It is acceptable—and smart—to pause the strategy during known "Black Swan" events or earnings releases.
█ Timeframe Selection: The 30-Minute Standard
Critical Requirement: This indicator must be applied to a 30-minute chart.
Why?
Noise Filtering: The Supertrend logic is tuned to capture multi-day trends. Lower timeframes (5m, 15m) are full of "noise"—random fluctuations that look like trend changes but aren't.
Execution Logic (The Hybrid Engine): The script has a built-in "Dual Timeframe" architecture.
Decision Layer (30m): Uses the chart timeframe to decide when to be Bullish or Bearish.
Execution Layer (5m): Internally fetches 5-minute data to manage the how (Adjustments, Late Entries, and precise invalidation).
The Risk of Lower Timeframes: If you run the main chart on 5-minutes, you destroy this hierarchy. You will get too many signals, pay too much brokerage, and the internal logic may behave erratically.
Recommendation: Always keep your TradingView chart interval at 30m. Do not switch to lower timeframes expecting "faster" signals; you will likely just get "false" signals.
█ Testing Scope, Feedback
⚠️ Important Note on Asset Classes:
This strategy logic and the associated strike step calculations have been rigorously tested ONLY on NIFTY Index Options with Weekly Expiry.
BankNifty / Sensex / FinNifty: The volatility characteristics (ATR) and strike intervals of these instruments differ significantly from NIFTY. The effectiveness of this strategy on these other scripts has not been verified and may require different parameter tuning (e.g., strike_step or ATR Length).
Stocks: Individual stock options often lack the liquidity required for the "Deep OTM" legs, leading to potential execution failures.
We encourage traders to backtest this logic on other indices and share their findings! If you find a robust parameter set for BankNifty or observe unique behaviors on other scripts, please let us know in the comments below so we can improve the algorithm for everyone. Your feedback is appriciated.
Options-strategy

Max Pain Options [QuantLabs] v5 (Balanced)Institutional Grade Options Analysis: Max Pain, Gamma & Pin Risk
For years, TradingView users have been flying blind without access to Options Chain data. QuantLabs: Max Pain & Gamma Exposure changes that. This is not just a support/resistance indicator—it is a sophisticated, algorithmic model that reverse-engineers the incentives of Market Makers using synthetic Black-Scholes logic.
This tool visualizes the "invisible hand" of the market: the hedging requirements of large dealers who are forced to buy or sell to keep their books neutral.
CORE FEATURES:
🔴 Max Pain Gravity Model The bright red line represents the "Max Pain" strike—the price level where the maximum amount of Options Open Interest (Calls + Puts) expires worthless.
Theory: As OpEx (Expiration) approaches, Market Makers maximize profits by pinning the price to this level.
Strategy: Use this as a mean-reversion target. If price is far away, look for a snap-back to the red line.
🟣 Gamma Exposure Profiles (The Purple Lines) These neon histograms show you the estimated "Gamma Walls."
Long Gamma: Dealers trade against the trend (stabilizing price).
Short Gamma: Dealers trade with the trend (accelerating volatility).
Visual: The larger the purple bar, the harder it will be for price to break through that level.
📦 Algorithmic "Pin Risk" Zones The dashed red box highlights the "Kill Zone." When price enters this area near expiration, volatility often dies as dealers pin the asset to kill retail premiums.
Warning: Do not expect breakouts while inside the Pin Zone.
📊 Institutional HUD A clean, non-intrusive dashboard provides real-time Greeks and risk analysis:
Pin Risk: High/Medium/Low probability of a pinned close.
Exp Mode: Detects if the market is in "Short Gamma" (Squeeze territory) or "Long Gamma" (Chop territory).
HOW IT WORKS (The Math): Since live options data is not available via Pine Script, this engine uses a proprietary Synthetic OI Distribution Model. It inputs Volume, Volatility (IV), and Time-to-Expiry into a modified Black-Scholes equation to probability-map where the heavy open interest likely sits.
SETTINGS & CUSTOMIZATION:
Responsiveness: Tuned for the "Goldilocks Zone" (Spread: 12, Decay: 22) to catch local liquidity walls without over-fitting.
Visuals: Designed for Dark Mode. High-contrast Neon aesthetics for maximum readability.

Smart Money Setup 08 [TradingFinder] Binary Options Gold Scalper🔵 Introduction
In the Smart Money methodology, the market is understood as a structure driven by liquidity flow. This structure forms through the movement of large orders, the accumulation of liquidity, and the reactions that occur around key price zones. The logic of Smart Money is based on the idea that price movement is not random and usually evolves with the intention of collecting liquidity and creating price inefficiencies known as imbalances.
Within this framework, several important stages including the liquidity sweep, the formation of a point of interest, the appearance of an imbalance and the transition of market structure play major roles and collectively define the broader direction of price.
In many bullish scenarios, the market begins by sweeping sell side liquidity and targeting important lows in order to collect the liquidity resting below them. This liquidity collection often becomes the starting point for creating a point of interest which usually marks the area where Smart Money begins to enter the market.
After price moves away from this point, it breaks a structural high and forms a change of character. This shift marks a transition in the balance of power between buyers and sellers and is considered the first clear signal that the market structure is changing.
After the change of character, new institutional order flow often creates a strong and rapid movement that leaves behind an imbalance. This imbalance is one of the most important elements in Smart Money analysis because price tends to return to this area in order to complete structure and restore balance.
The return into the imbalance becomes meaningful when it occurs together with the liquidity sweep, the presence of a validated point of interest and a confirmed structural transition. These conditions frequently mark the beginning of powerful movements within the Smart Money cycle.
Understanding the sequence of liquidity, point of interest, imbalance, change of character and market structure builds the foundation of Smart Money analysis and provides a clear view of the true direction of institutional strength.
Bullish Setup :
Bearish Setup :
🔵 How to Use
To use this framework effectively, the trader must analyze the market through the principles of Smart Money and observe how liquidity drives price. A trade becomes valid only when several essential components appear together in a clear and consistent order.
These components include the liquidity sweep, the formation of a point of interest, the confirmation of a change of character, the transition of market structure and the return of price into an imbalance. The method is built on the understanding that the market first collects liquidity, then shifts order flow and finally provides an entry opportunity inside an inefficient area or inside a point of interest.
For this reason, the trader must follow the path of liquidity from the moment the sweep occurs, through the point of interest and the change of character and finally into the return of price toward the imbalance. When applied correctly, this approach creates entries that are more precise, more structural and more aligned with the real behavior of the market rather than with superficial signals.
🟣 Long Position
A bullish setup in Smart Money structure begins with a liquidity sweep on the sell side. The market first targets the areas where sell side liquidity is located and collects the stops and resting liquidity under previous lows. This collection is the condition that Smart Money requires to begin creating a new order flow. After this liquidity has been taken, a point of interest forms which is usually the last bearish candle or the effective demand zone that initiated the upward movement.
Price then moves away from the point of interest and breaks a structural high which creates a change of character. This event confirms that the market structure has moved from a bearish state to a bullish one and that buying pressure has taken control of the order flow. Following this shift, a strong upward movement often occurs and creates an imbalance between candles. This imbalance reflects the entrance of strong Smart Money orders and is seen as an important confirmation of bullish strength.
When price returns to this imbalance after the displacement, the market enters a phase where Smart Money aims to complete the corrective movement and continue the upward direction. The reaction inside the imbalance when combined with the liquidity sweep, the confirmed point of interest and the change of character completes the bullish setup and forms a structure that often leads to a continuation of the bullish trend.
🟣 Short Position
A bearish setup follows the same Smart Money logic but in the opposite direction. The market begins by collecting buy side liquidity and targets the highs where buy side liquidity and resting stops are located. This liquidity sweep on the buy side becomes the starting phase for Smart Money to initiate a downward order flow. After the liquidity is collected, a bearish point of interest forms which is usually the last bullish candle or the supply zone that created the initial drop.
Price then moves away from this point and breaks the first structural low. This creates a change of character to the downside which confirms that the market structure has transitioned from bullish to bearish and that selling pressure has gained control. After this shift, a strong downward displacement appears and leaves behind a bearish imbalance that clearly shows the dominance of sellers.
As price returns to this imbalance and corrects the inefficient movement, the bearish setup becomes complete as long as the market structure remains bearish. The combination of the buy side liquidity sweep, the bearish point of interest, the change of character, the imbalance and the corrective return creates the ideal structure that Smart Money uses to continue the downward movement and develop a reliable selling opportunity.
🔵 Settings
🟣 Logic Settings
Pivot Period : Defines how many bars are analyzed to identify swing highs and lows. Higher values detect larger, slower structures, while lower values respond to faster patterns. The default value of 5 offers a balanced sensitivity.
🟣 Alert Settings
Alert : Enables alerts for SMS08.
Message Frequency : Determines the frequency of alerts. Options include 'All' (every function call), 'Once Per Bar' (first call within the bar), and 'Once Per Bar Close' (final script execution of the real-time bar). Default is 'Once per Bar'.
Show Alert Time by Time Zone : Configures the time zone for alert messages. Default is 'UTC'.
🔵 Conclusion
The Smart Money approach demonstrates that price movement is not random or based on surface level patterns. Instead, it develops through a clear cycle of liquidity collection, structural transition and corrective movement toward key price zones. By recognizing events such as the liquidity sweep, the formation of the point of interest, the change of character and the return into the imbalance, the trader gains the ability to understand order flow more accurately and identify the true direction of market structure.
Both bullish and bearish setups show that the alignment of these elements creates a transparent view of institutional behavior and reveals the source of strong movements in the market. When the trader correctly identifies this sequence, entry points become more reliable and more aligned with liquidity flow. The combination of liquidity, structure and imbalance provides a consistent framework that removes guesswork and guides decisions through the real logic of the market.

Long Butterfly Triangle Simple indicator that shows the Long Call/Put Butterfly on Chart based on values you enter.
You can simply
1.) enter individual values ( BTO, STO values) of the butterfly or
2.) paste in this format 'SPX Nov 4th 6775/6800/6825 Long Call Butterfly' or
3.) '6775/6800/6825' in the pattern box.

PCP Arbitrage Monitor (Math by Thomas)Live monitor for Put–Call Parity (C + PV(K) = P + S) showing drift, arbitrage direction, and opportunity strength.
The PCP Arbitrage Monitor helps traders visualize and quantify deviations from the Put–Call Parity (PCP) relationship:
𝐶+𝐾𝑒−𝑟𝑇 = 𝑃+𝑆
When this equation drifts, it indicates a potential arbitrage opportunity between call, put, and underlying (spot or future).
This indicator plots the left-hand side (LHS) and right-hand side (RHS) of the PCP equation on your chart, computes the drift, and automatically highlights and displays actionable trade combinations when the deviation exceeds a set threshold.
⚙️ How It Works
Inputs
Call & Put Symbols – Select matching call and put options (same strike & expiry).
Strike (K) – The strike price for those options.
Expiry (UTC) – Option expiry date/time (used to calculate 𝑇 and PV(K)).
Risk-free Rate (r) – Annualized rate used for discounting the strike.
Lot Size / Tick Value – Used to calculate profit in INR.
Arbitrage Threshold – Minimum drift (in points) to trigger signals (default 200).
Displayed Data
LHS = C + PV(K) (Call + discounted Strike)
RHS = P + S (Put + Spot/Future)
Drift = LHS – RHS
Bookable Profit (INR)
Action Suggestion (only when |drift| ≥ threshold)
Background Highlight
🟩 Green – Call side expensive → Sell Call + Buy Put + Buy Fut
🟥 Red – Call side cheap → Buy Call + Sell Put + Sell Fut
Table
Displays all key values live in the top-right corner:
Option prices
LHS, RHS
Drift (points)
Time to expiry
Lot size
Bookable profit (INR)
Trade action (only if |drift| ≥ threshold)
📈 How to Use
Open a NIFTY Spot or Futures chart (works on both).
Enter the exact option symbols (e.g., NSE:NIFTY24DEC21900CE and NSE:NIFTY24DEC21900PE).
Adjust Strike (K) and Expiry to match those options.
Observe:
The green/red background highlights large deviations (≥ threshold).
The Action cell displays the arbitrage combination and expected profit.
A drift beyond the threshold suggests a potential risk-free arbitrage if executed simultaneously across all legs.
Hold positions till expiry if margin allows; the profit is theoretically locked in.
💡 Tips
Works on both Spot and Futures charts — the script auto-uses the chart’s close as 𝑆
Set smoothing to 0 to see raw parity values.
Adjust threshold based on costs and margin — e.g., 150–200 points for NIFTY is practical.
Only valid when options are European (no early exercise risk).
Ensure both option symbols are liquid and from the same expiry.
⚠️ Disclaimer
This tool is for educational and analytical purposes.
Real arbitrage execution depends on liquidity, bid-ask spread, slippage, and margin requirements.
Always validate prices with your broker before trading.

1m OPTION BUY_Multi indi-01 (P) SEMI AUTOEnter every monday choose the option price range between 50 tp 100 , set strategy for a week or 3 three days, set upper limit 120 and lower limit 30 and input your own contract size and all parameters as you wish, and execute the alert (this is how the strtegy made). if you dont have any idea of market direction execute this strtegy for put and call both. be aware this strategy may incurred loss . we r not recomending to use this strategy , this is for education purpose only, watch and analyze then take your own decision.

Options Series - Index Analysis [MasterPiece]
Powerful Insights 🚀:
This script utilizes multiple technical indicators to provide a comprehensive view of stock trends, which increases the reliability of trading signals.
This script also designed to perform index and stock analysis by comparing price movements to moving averages (MA20) and volume-weighted average price (VWAP).
By analyzing a set of top-weighted stocks within an index, the script offers a macro-level view while also delivering stock-specific insights. This dual focus enhances its utility for traders who need to understand both individual stock movements and broader market dynamics.
⭐ Originality: The script presents a unique fusion of multiple indicators with a data-driven approach to analyzing top-weighted stocks in major indices like Nifty and BankNifty. The integration of widely-used technical analysis tools, such as exponential and simple moving averages (EMA, SMA), volume-weighted average price (VWAP), and volume-body size comparisons, offers a holistic framework for traders. By focusing on the top five stocks in the indices, it leverages weightage-based performance analysis, adding a strategic dimension to index trading. This approach not only evaluates individual stock performance but also synthesizes broader market trends.
⭐ Usefulness: This script serves traders who seek a multi-dimensional method for analyzing both index and stock performance. Its key features include:
Bullish and Bearish Signals: The relationship between price, moving averages (MA20), and VWAP identifies directional trends, generating buy/sell signals for both individual stocks and the overall index.
Volume and Candle Body Analysis: By comparing candle body size with volume, the script provides deeper insights into trend strength and market conviction. This allows traders to gauge whether price movements are supported by sufficient trading volume.
Customization: Users have the flexibility to input specific index and stock symbols, making the script adaptable for different markets and instruments beyond just Nifty and BankNifty.
Signal Overlay: The ability to overlay bar color and volume signals directly on the price chart ensures better trend visualization, offering clear and immediate visual cues for potential trading setups.
⭐ Justification for Mashup: The combination of multiple indicators is logical and complementary. Each component serves a distinct purpose that enhances the overall system:
Trend Identification: Moving averages and VWAP provide insights into short and long-term trends, giving traders a reliable baseline for price direction.
Conviction: The inclusion of volume and candle body size comparisons gives additional weight to price action, allowing traders to confirm whether a trend is backed by meaningful market activity.
⭐ Color Customization for Enhanced Visualization:
The script defines custom colors for various conditions and candles, improving clarity for bullish and bearish trends.
Green for Bullish: Dark green for regular bullish candles, and fluorescent green for stronger bullish signals.
Red for Bearish: Dark red for regular bearish candles, and fluorescent red for stronger bearish signals.
Neutral Conditions: Fluorescent yellow is used for neutral conditions.
⭐ Index and Top Stocks Analysis:
This section analyzes top-weighted stocks for indices ( NSE:NIFTY and NSE:BANKNIFTY ), with NSE:BANKNIFTY being used as the default.
Top Stocks for NSE:NIFTY : HDFCBANK, ICICIBANK, RELIANCE, INFY, ITC.
Top Stocks for NSE:BANKNIFTY : HDFCBANK, ICICIBANK, KOTAKBANK, AXISBANK, SBIN.
Customizable Input: Users can modify the index and stock symbols via input.symbol.
⭐ Signal Generation Based on MA20 and VWAP:
The conditions for bullish or bearish signals are based on the relationship between the stock's close price, MA20, and VWAP.
Bullish Signal: Close price greater than both MA20 and VWAP.
Bearish Signal: Close price less than both MA20 and VWAP.
⭐ Volume Bar Signal for Market Activity:
The script analyzes candle body size and volume to detect significant market movements.
Body Size and Volume Comparison: It checks if the current candle’s body size or volume is greater than the moving average of body size or volume over the past 74 bars.
Green Candle (GC) and Red Candle (RC): Boolean conditions to track whether the close price is higher or lower than the open price.
⭐ Average Signals for Strong Trends:
The script calculates average bullish or bearish signals based on the majority of candles being green or red and significant body size or volume.
Bullish Average Signal: At least 4 out of 6 stocks exhibit bullish conditions (green candles, large bodies, or high volume).
Bearish Average Signal: Similar logic for bearish signals with red candles.
⭐ Overlay of Volume Bar Signals:
The plotshape function overlays the bullish and bearish volume bar signals on the chart, using color and shape to indicate trend changes.
🚀 Conclusion:
This Pine Script code provides a robust framework for index analysis based on top 5 weighted stocks, using two primary indicators—MA20 (20-period Moving Average) and VWAP (Volume Weighted Average Price).
Market Bias Identification: The script identifies bullish and bearish conditions for each stock based on whether the close price is above or below MA20 and VWAP.
Volume and Body Size Comparison: It checks if the current candle’s body size or volume exceeds the average to determine significant market moves.
Visualization with Color & Signals: It overlays color signals for bullish (fluorescent green) and bearish (fluorescent red) markets and provides triangle markers for strong volume-based signals.
Top Stock Analysis: The script provides analysis of top five weighted stocks in the selected index, enhancing precision for broader index analysis.

Rolling Straddle PremiumScript is Basically intended to provide insight's on the Rolling Straddle premium for the selected index based on the input settings.
Important thing to consider for the script to work seamlessly:
Specify the LTP in the input field (need not be very accurate)
Specify the Expiry Date for the Option Strike.
Ensure Profile matches to the chart script (Index Script)
Note: Zones marked in Blue, is the max level that indicator can track the option prices. beyond which it may fail to track, during such time consider reloading the indicator with Latest LTP .
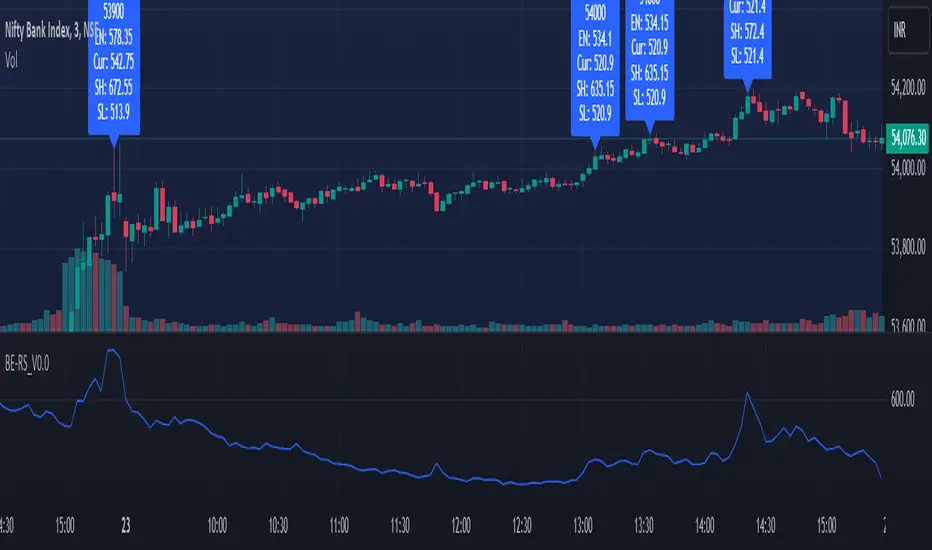
Labels on the chart indicate that If i had shorted the Straddle, what would be my current position of that Straddle. however the rational behind shorting is only the pivot high points (not sure if this is right or wrong! )
Note On Labels: Labels are delayed basis the pivot point candles specified in the indicator settings.
EN: Entry Price (Straddle Premium) of the Strike Specified.
Cur: Current Price ( Current Straddle Premium ) of the Strike Specified.
SH: Max Straddle Premium ( Increase in Premium ) since position is active.
SL: Min Straddle Premium ( Premium Erosion ) since position is active.
BE-NSE-Distributed Straddle Intraday Trading StrategyHerewith publishing the script (not the Indicator!) for the benift of Option Traders. I call this a script as this doesn't perform any kind of analysis of candle data and provide general BUY | SELL information. This Script is based on the TRUE VALUES concept which is nothing but LTP.
Idea Behind this Script:
As an option seller i need the lower risk option premium to trade. so that, time can work in our favor. basic question which we get at the first is which option to choose out of many available.
If traders feel the question is apt then this script is for them.
Logic Behind this script:
Upon Market Open, script in the BACKEND ( Under the hood ) deployes 60 possible combinations of STRADDLES for sampling, and continue to monitor the LTP movements and compares it against opposite pairs. lets say out of 30 Straddle options one of the Straddle it picked is ATM CE VS ATM PE. for 1 rs move in underlying how much impact is happening in CE VS PE.
This simple anlysis is done at every 30 seconds. once the Analysis is complete it picks 4 options 2 on the CALL side and 2 on the PUT side, which script feels the movement of prices are smooth. SMOOTH refers that time decay that can work in our favor..
Calculations behid the script:
lets say BNF LTP is 52000 at 9:20 AM, and one of the pair script took for sampling was ATM CE vs PE which are having the LTP of 100 each.
At 9:35 AM, BNF is trading at 52075, and ATM CE is reading the LTP of 122 and ATM PUT is reading the LTP of 70. ideally LTP of Call should be around 135 and Put should be around 65 considering the usual delta of 0.48 . Net Money Index for this Pair Sample is 8
Call Side => 100 - 122 = -22
Put Side => 100 - 70 = 30
Money Index => 30 - 22 = 8 for 15 Min
This Money index is calculated across choosen samples and the Option strikes is provided as an output which has mere possiblity of working in Options Seller's favor.
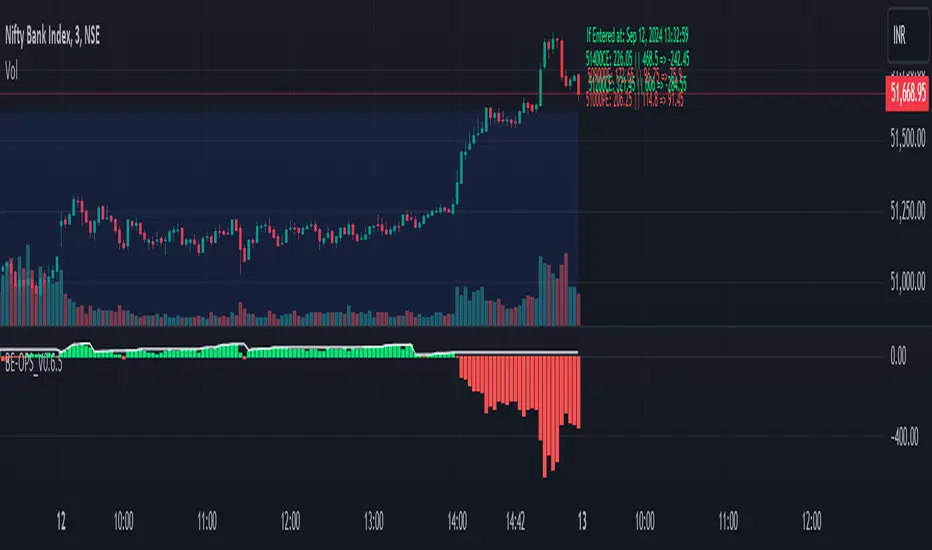
How to Read the Output:
For the choosen strikes from the time of Entry (Suggested Entry time by script) till the current time, the bottom pane plots the Money index as columns. Green Columns indicate that how much option premium eroded due to time decay. Red Columns indicate that how much Option premium increased during the time.
Note: Script dynamically calculate the strikes and suggests in realtime.
WARNING or a Humble Request:
For those who don't understand the word "Repaint" how it works in Pine Script. plz don't consider using this script. For those who wish to understand I have kept the Observer mode in the settings which shall guide you on why the Money Index shown on the chart when the MARKET IS CLOSED is different than when the MARKET IS OPEN (Realtime).
Disclaimer:
I have tested the script only in BNF and not sure if this works on Nifty, FinNifty or others. you may still try and plz do provide the feedback for improvising the script.
----- BreathEasy --------
The information contained in my scripts/indicators/ideas does not constitute financial advice or a solicitation to buy or sell any securities of any type. I will not accept liability for any loss or damage, including without limitation any loss of profit, which may arise directly or indirectly from the use of or reliance on such information.
All investments involve risk, and the past performance of a security, industry, sector, market, financial product, trading strategy, or individual’s trading does not guarantee future results or returns. Investors are fully responsible for any investment decisions they make. Such decisions should be based solely on an evaluation of their financial circumstances, investment objectives, risk tolerance, and liquidity needs.
My scripts/indicators/ideas are only for educational purposes!
BE - Strategy Builder ToolkitIndicator vs Toolkit:
This is definitely not an indicator, hence this doesn't do any kind of analysis nor provide meaningful outputs where you can take trading decisions out of it.
This is a Strategy Builder Toolkit which works like any other broker/3P applications, which helps traders to build their own custom/ predefined strategies, save / deploy them at their wish.
Idea Behind Developing this Toolkit: I am sure many of traders have overcome scenarios where, on break of x level he wants to initiate straddle else he wants to initiate Iron Condor. Some of them wants to deploy custom strategies only at certain time or at certian price levels.
It becomes pretty difficult to track markets when you are away from desk and if you dont adjust the strategy legs, you are incurring big drawdowns. There are many if's and buts to deploy strategies.
To overcome such challenges, i have built this toolkit.
Note: As this is just a toolkit, you should conduct your analysis to gauge the market direction outside the perview of this. Once you know the view / direction of the script. you can use this toolkit in action to
1. Deploy Strategy at (Desired levels| Desired time|Confired Levels|Confirmed Volumes)
2. Strategy can be Prebuilt / Custom Built
3.1 Set SL, Target for Directional view (Trail SL aswell)
3.2 Set Upside or Downside Target for Non Directional view (Trail SL aswell)
3.3 let the strategy play with out SL|Targets for consolidation view.
4. Adjust Legs by closing existing position and opening fresh position or place fresh adjustments
5. Book partial Profits with in the zone.
How the Toolkit is buit: Script uses text related functions to understand the custom input given in the indicator and coverts into a strategy and deployes them as a algo trading (Next Level Bot) with the additional parameter set for SL|Target|Entry levels.
Understanding the settings:
1. Strike Difference: is basically a value between each strike. eg: Banknifty : 100, Nifty & Finnifty: 50
2. 1 Lot Qty: Qty per Lot accepted by exchange|Broker. eg: BNF: 15, Nifty: 50, Finnifty: 40
3. Lot Multiplier: If you build strategy with 1 lot and if you set the Lot multiplier as 2 then strategy gets deployed with 2 lots. for eg. If i have saved strategy to buy BNF 1 ITM with 1Lot and have set lot multipier to 3 then at the time of deploying the trade it pushes as 3 lots (3 * 15Qty per lot = 45Qty) of 1 ITM strike.
4. Symbol Name: Select the Symbol Name here.
5. Current & Next Week Expiry Date: Specify the expiry Dates in the format as supported by your broker.
6. Broker Name, Exchange & Product Type: hope it is self explanatory.
IMPORTANT settings to understand:
7. Triggere Entry Post (optional): You have to specify when you want to deploy the strategy. For instance, if i want to deploy my strategy at 30 min after market open which is 9:45 am, then i have specify as 0945. Another instance where i want to close my strategy at 3 PM then you have to specify as 1500. Uncheck this option if you are not worried about the time of entry.
My personal Used Case: On the Expiry -1 Day at 0916 (9:16AM) i will buy 6 lots of 8OTM PE & CE and Sell 2 lots 7OTM, 2 lots of 6OTM and 2 lots of 5OTM and close the trade by 1100 (11AM).
8. Price Levels (Confirmed vs UnConfirmed) (Optional): Confirmed is basically price is sustained at|around the specified price level, where in UnConfirmed is basically the touch of the specified level.
for instance if i want to deploy straddle only if price is sustained at 100. then, i would specify GE with 100 in price input settings, and check thee Confirmed price box. Assuming if LTP is running at 98 and with the above settings it will only deploy the trade upon price is sustained at 100 level for 3 to 5 candles not at the touch of 100.
Uncheck this option if you are not worried about the Entry Price.
9. Confirmed Volume (Optional) (Long or Short): Basis your view|direction of the strategy. you can get additional confirmation. At the time of entry you want volume to be present towards the direction of the strategy. Uncheck this option if you are not worried about the volume or Volume doesn't exist for the chart loaded.
10. Alert Types: It consists of 3 Long & 3 Short directional (prebuilt) strategy along with Close Strategy, Close Specified Symbols Only & Design Custom Strategy Option.
10.1 : Slow Upmove - If you are having bullish view and predict that prices shall go slow and steady. This strategy can be deployed where you get the benifit of time decay as well while the delta play in favor of you. (viseversa for Slow DownMove)
10.2 : Fast Upmove - If you are having bullish view and predict that prices shall go fast. This strategy can be deployed where you get the smaller benifit of time decay as well while the delta play in favor of you. (viseversa for Fast DownMove)
10.3 : Vol Upmove (Volatality)- If you are having bullish view and predict market is tend to be volatile. This strategy can be deployed where you get the benifit of volatility as well while the delta play in favor of you. (viseversa for VolDownMove)
10.4 : Close Trade - You can use this option close the deployed strategy completely.
10.5 : Close Symbols - You can use this option close few of the symbols for the strategy deployed.
10.6 : Custom: Use this option to design you own custom strayegy with the syntax below:
Sample 1:
N|B|C2|3
N refers to Nextweek Expiry (if C is used then Current week expiry)
B refers to Buy (if S is used then Sell)
C refers to Call | CE (if P is used then PE or Put)
2 refers to 2OTM (for CE any Postitive number refers to as OTM and for PE it will be treated as ITM strikes & 0 refers to as ATM - viseversa for Negative Numbers)
3 refers to as 3 Lot
With the syntax of N|B|C2|3 - strategy will be deployed as "Buy 3 lots of 2 OTM Call of Next expiry"
Sample 2:
C|S|P-3|3|10|30
Above syntax means: SELL Current Expiry 3 Lots of 3 OTM Put Strike with 10 SL and 30 TGT
Sample 3:
C|S|C10|3|Default
Above syntax means: SELL Current Expiry 3 Lots of 10 OTM CALL Strike with 50% SL and 95% TGT
Sample 4:
C|B|C-2|3|40%|50%
Above syntax means: BUY Current Expiry 3 Lots of 2 ITM CALL Strike with 40% SL and 50% TGT
Sample 5: Long Straddle
C|B|C0|3
C|B|P0|3
Above syntax means: BUY Current Expiry 3 Lots of ATM CALL & PUT Strike
Sample 6: Iron Butterfly
C|B|C1|1
C|S|C0|1
C|S|P0|1
C|B|P-1|1
Above syntax means: Sell Current Expiry 1 Lots of ATM CALL & PUT Strike and BUY 1OTM Call & Put Strike
Sample 7: Diagonal Spread
C|S|C2|1
C|S|P-2|1
N|B|C3|1
N|B|P-3|1
Above syntax means: Sell Current Expiry 1 Lots of 2OTM CALL & PUT Strike and BUY 3OTM Call & Put Strike of Next Expiry.
To Understand how to deploy Strategy with defined Adjustments. For instance i want to deploy Iron Condor with Adjustments for BNF when the price is currently running at 45000.
C|B-|C3|1
C|S*|C2|1
C|B--|P-3|1
C|S**|P-2|1
At:2|C|S|C2|1
At:2|C|B|C3|1
At:-2|C|S|P-2|1
At:-2|C|B|P-3|1
On:2|*
On:-2|**
On:2|-
On:-2|--
With the above syntax: Intial trades are placed with
BUY BANKNIFTY45300CALL(Current Expiry) 1 Lot
BUY BANKNIFTY44700PUT(Current Expiry) 1 Lot
SELL BANKNIFTY45200CALL(Current Expiry) 1 Lot
SELL BANKNIFTY44800PUT(Current Expiry) 1 Lot
Toolkit tracks the price and holds the adjustments.
We may start to bleed on the sold leg (45200CALL) once the price crosses 45200. Hence if the price crosses 2 strike upside as specified with syntax " On:2|* " where * is a character tagged to Sold Call Leg. it closes the 45200 Call.
Similarly, " On:2|- " where - is character tagged to Brought Call Leg. it closes the 45300 Call, as soon as prices reaches 2 strike upside.
At:2|C|S|C2|1
At:2|C|B|C3|1
With the At Statements you can place the fresh adjustments legs. Above syntax refers to Once the price reaches 45200 it places below adjustment legs.
BUY BANKNIFTY45500CALL(Current Expiry) 1 Lot
SELL BANKNIFTY45400CALL(Current Expiry) 1 Lot
Note: Similarly If prices reaches downside with the On and At Sytax it places the necessary adjustment legs accordingly.
11. SL & TGT - You can specify SL, TGT or Upside & Dowside TGT during the entry conditions and Stratey shall be closed upon hitting either the SL or TGT accordingly.
12. On % Tgt & Lock % SL: This option is used for Prebuilt strategy where you can lock the Profit | Set Revised SL upon hitting specified TGT percentage.
13. Close Symbols: This option is used if you select Alert type as Close Symbols (Ref - 10.5 : Close Symbols) for specified list of symbols Alert shall be pushed to close the open positions of those symbols.
DISCLAIMER: No sharing, copying, reselling, modifying, or any other forms of use are authorized for our documents, script / strategy, and the information published with them. This informational planning script / strategy is strictly for individual use and educational purposes only. This is not financial or investment advice. Investments are always made at your own risk and are based on your personal judgement. I am not responsible for any losses you may incur. Please invest wisely.
Happy to receive suggestions and feedback in order to improve the performance of the indicator better.

Strategy:Reversal-CatcherWhat
This is a plain and vanilla reversal based strategy for intraday (15m) timeframe on Futures prices of the assets.
Now what all it comprises of?
It finds out the dynamic support & resistance from Bollinger Band (20 period, 1.5 std dev).
It finds out the potential divergence of price deviation from 5 period exponential moving average (EMA).
If the previous candle (N-1) shows a divergence it confirms the reversal by checking the present candle (N) to be closed inside the Bollinger Band.
It confirms the momentum by checking RSI shows a crossover/crossunder to oversold (30) / overbought (70) region.
It also confirms whether the trend is up (then only reversal trade to short) or down (then only reversal trade to long). The trend is checked with EMA-21 and EMA-50.
Re-affirmation Condition : It re-affirms the position of two successive candles called as `hhLLong` and `hhLLShort` in the script.
Why
In Indian context, retail participants are pre-dominantly (yes- 80% of Indian daily volume) Options buyers mainly in weekly indices (Nifty, BankNifty, FinNifty, CNXMidcap, Sensex, Bankx .. well everyday is expiry now in India, except -- Thank God -- Saturday & Sunday).
And in Index Options the momentum plays a big role.
If one can catch a good reversal point the potential of high Risk-to-Reward trade (hence earn handsomely) is very likely (please note: there is no holy grail in trading. Nothing works 100%).
So this is the attempt to catch a reversal.
Re-affirmation of Reversal
hhLLong : It's a reversal point after an uptrend. It checks the relative positioning of current candle compared to that of previous candle. [The details are in the script. Check for variable hhLLong in script.
hhLLShort : It's a reversal point after a downtrend. It checks the relative positioning of current candle compared to that of previous candle. [The details are in the script. Check for variable hhLLShort in script.
Unique-ness
What's unique in it? Why we decided to publicly share this:
Already given the context of The Great Indian Options Buyers community. It should be helpful to them, we believe.
It takes Very Less Number of Trades with High Accuracy . Please check the result in NSE:NIFTY1! in 15m timeframe. 71% accuracy with roughly a trade in a month.
There is no point giving brokers' the brokerages taking 10 trades a day and ending not-so-good EoD. Better lets take less trades with better result possibility. .
Mention
There are many people uses this variation of Bolling Band, 5EMA
Many people use RSI, trends and relative positioning of candles.
--> We are grateful to all of them. It's really difficult to mention everyone's name. But all people somehow influence the thought process. Thanks for all of them.
Statutory Disclaimer
There is no silver bullet / holy grail in trading. Nothing works 100% time. One has to be careful about the loss (s)he can bear in case of the trade goes against.
We, as the author of this script, is not responsible for any trading or position decision one is taken based on the outcome of this.
It is our sole discretion to change, add, delete the portion or withdraw the whole script without any prior notice or intimation.
In Indian Context : We are not SEBI registered, will never be SEBI registered.

Weekly Options Expiry Candle V.2In India Weekly options expire on Thursday and that creates a different price action candle than the week timeframe.
My previous script Weekly Options Expiry Candle has some limitations. This script overcame those limitations and added some features.
You can use this in any intraday time frame candle.
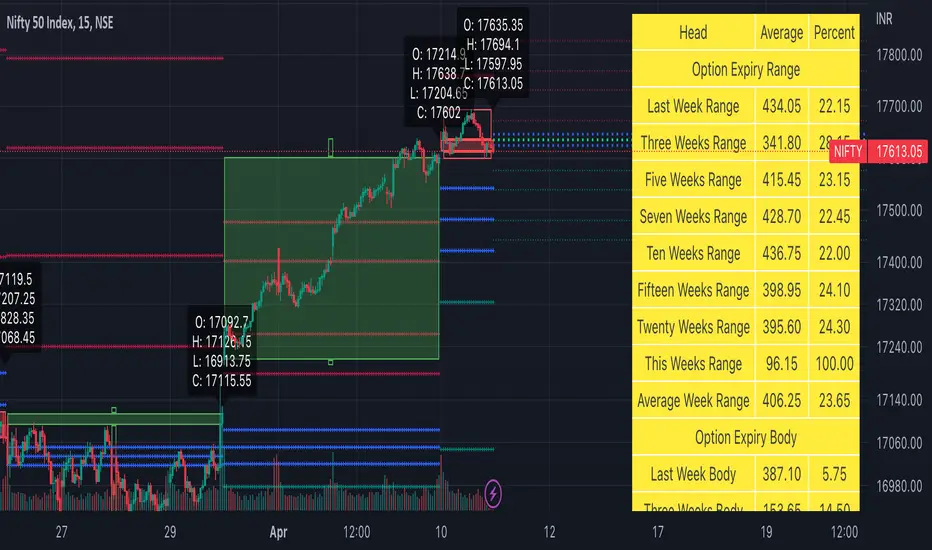
It will show:
All expiry candle in box format
Expiry OHLC label
Pivot (Floor or Fibonacci) based on expiry OHLC data
Developing Expiry candle and Pivot
A table showing expiry range(high-low) and Expiry body abs(open-close) stats.
You can turn on or off any feature.
Please let me know if you found this script useful or have any questions or suggestions.
NSE:BANKNIFTY
NSE:NIFTY
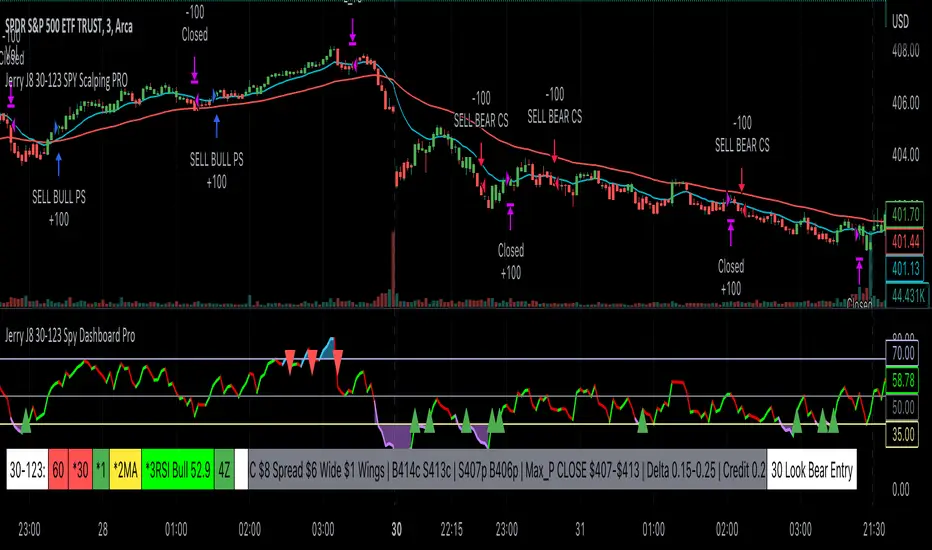
Jerry J8 30-123 Spy Dashboard ProPlease watch the J8 Scalping Tutorial Video below for a walkthrough on how these indicators work.
This script is used in conjunction with Jerry J8 30-123 SPY Scalping PRO” Indicator(which creates the buy and sell orders as a strategy). The Dashboard shows the 4 main criteria statuses from the strategy. I find the dashboard makes scalping the SPY much easier.
This study project is designed for scalping options that expire daily with bull put and bear call credit spreads on a 3 minute chart. The name 30_123 is a reference to 4 main criteria being met to give a green light for a potential trade. The criteria:
* 30 = 30 minute trend
* 1 = 3 minute trend
* 2 = Moving average criteria
* 3 = RSI criteria
4 = Secondary trend. Bonus if in sync but not a requirement.
* The strategy also utilizes momentum as a criteria but this is not shown on the dashboard.
This indicator is designed to trade options that expire daily including the SPY, IWM, QQQ, and NDX. However, it can be used with multiple symbols on a 3 minute chart.
When the 30_123 conditions are all green with all criteria are met a bull signal is created.
When the 30_123 conditions are all red with all criteria are met a bear signal is created.
This study is the dashboard that is designed to show how the main J8 strategy indicator is working and it shows which criteria have been met. Additionally there are multiple user INPUTS that you can adjust for the 4 main criteria plus inputs to help you with your credit spread criteria.
For example, if the SPY is at 400 we could have an order to sell a BULL PUT CREDIT SPREAD and I would likely sell the 398p and buy the 397p; The 398p delta would be approximately -.2. The spread position profits with any close over 398 and/or can be closed early with a bullish price move. IMPORTANT: If the SPY closed the day at $399 on the chart it would look like a loss based on the buy and sell orders but the spread would be a full profit since the close was above 398.
---- IRON CONDOR
For the SPY ticker only an iron condor label is generated when the SPY is trading sideways and meets specified criteria. When the criteria is met the Iron Condor label appears and it provides a recommendation for what option to buy and sell. The iron condor recommendations can be adjusted with user inputs.
This Indicator dashboard shows the criteria labels and colors the criteria as green if bullish and red if bearish. When the criteria are not met the dashboard shows “NO CLEAR SIGNAL”. There is also a label that shows whether you are looking for bullish or bearish positions based on the 30 minute trend.
The chart shown on the indicator is the RSI and for this indicator an RSI over 50 is bullish and under 50 is bearish. The line color shows the RSI trend. RSI OB (overbought) and OS (oversold) areas are shaded. The RSI can remain in an OB or OS state for a prolonged period and while some people use OB and OS as a reversal signal I use it as a strong trend indication and recognize it will not last forever. You can SET the OB and OS levels with inputs.
---- USER INPUTS
Paint Bars: Turns on/off the candle coloring. Default is OFF.
Iron Condor Settings: Defaults are what I use and can be used as a guide.
Criteria: Trend, moving averages, and RSI settings can all be adjusted.
---- SETUP & HINTS
Add "Jerry J8 30-123 SPY Scalping PRO” indicator to show bull and bear signals
Add "Jerry J8 MACD Optimal Entry Zone” indicator to show best MACD range for entry
I also like to add "Jerry Momentum Dream" indicator to see the momentum
With this indicator we’re looking for the 30, 1, 2, and 3 criteria to be met which increases our likelihood of success. IMPORTANT. Never automatically enter a position without reviewing the other indicators and drawing your own conclusions. You want to choose the entries that are the most appealing to you that take into account volume, time of day, and risk/reward. Positions should be closed based on your risk/reward goals.
Indicators are not a magic pill and should be used to support trading decisions, not to make them for you. Past performance is not a guarantee of future returns. The results of individual stocks/indexes with any strategy do not constitute proof they will repeat in the future.
DISCLAIMER: The information contained in our scripts/indicators/ideas does not constitute financial advice or a solicitation to buy or sell any securities of any type. Trading and investing in the stock market and cryptocurrencies involves substantial risk of loss and is not suitable for every investor. I’m NOT a financial adviser. All trading strategies are used at your own risk.
Please Use the AUTHOR’s INSTRUCTIONS link below for more information.
NOTE: The PERFORMANCE SUMMARY below does not accurately reflect the trading strategy because the entry orders generated in the strategy are based on the stock price and our actual order is a credit spread that is profitable even if the price moves against us a little bit. What could show as a loss in the strategy could be a profit in the credit spread.

Jerry J8 30-123 SPY Scalping PROPlease watch the J8 Scalping Tutorial Video below for a walkthrough on how these indicators work.
---- STRATEGY
This study project is designed for scalping options that expire daily with bull put and bear call credit spreads on a 3 minute chart. The name 30_123 is a reference to 4 main criteria being met to give a green light for a potential trade. The 4 main criteria:
*30 = 30 minute trend
*1 = 3 minute trend
*2 = Moving average criteria
*3 = RSI criteria
4 = Secondary trend. Bonus if in sync but not a requirement.
* The strategy also utilizes momentum as a criteria.
This indicator is designed to trade options that expire daily including the SPY, IWM, QQQ, and NDX.
When 30_123 conditions are all green and all criteria are met a bull signal is created.
When 30_123 conditions are all red and criteria are met a bear signal is created.
The bull and bear signals are based on the stock/index price; BUT the actual orders are for option spreads that are normally based on a delta of approximately .15 to .25.
For example, if the SPY is at 400 we could have an order to sell a BULL PUT CREDIT SPREAD and I would likely sell the 398p and buy the 397p; The 398p delta would be approximately -.2. The spread position profits with any close over 398 and/or can be closed early with a bullish price move. IMPORTANT: If the SPY closed the day at $399 on the chart it would look like a loss based on the buy and sell orders but the spread would be a full profit since the close was above 398.
This script is used in conjunction with Jerry J8 30-123 Spy Scalping Dashboard Pro indicator which is the dashboard to give a visual for the 4 main criteria and makes things easier to understand.
---- TRADING TIME FRAME
The default time frame is 10:00 - 15:57 and can be controlled by the user. I do not enter trades in the first 30 minutes since that can be a very volatile period and you can easily configure the indicator and trading time frame based on how you trade.
---- MAJOR USER INPUTS
Paint Bars: Turns on/off the candle coloring for the trend
Exits: Open orders can be closed with 3 different exit criteria and all should be left on. These exits are needed to provide multiple entry signals throughout the day. However, you want to close the spreads based on your own criteria and not on the indicator.
Criteria: Trend, moving averages, RSI settings, and trading time frames can all be adjusted.
---- SETUP & HINTS
Add "Jerry J8 30-123 Spy Scalping Dashboard Pro” indicator to show J8 criteria dashboard
Add "Jerry J8 MACD Optimal Entry Zone” indicator to show best range of entry
I also like to add "Jerry Momentum Dream" indicator to see the momentum
With this indicator we’re looking for the 30, 1, 2, and 3 criteria to be met which increases our likelihood of success. IMPORTANT. Never automatically enter a position without reviewing the other indicators and drawing our own conclusions. You want to choose the entries that are the most appealing to you that take into account volume, time of day, and risk/reward. Positions should be closed based on your risk/reward goals.
Indicators are not a magic pill and should be used to support trading decisions, not to make them for you. Past performance is not a guarantee of future returns. The results of individual stocks/indexes with any strategy do not constitute proof they will repeat in the future.
DISCLAIMER: The information contained in our scripts/indicators/ideas does not constitute financial advice or a solicitation to buy or sell any securities of any type. Trading and investing in the stock market and cryptocurrencies involves substantial risk of loss and is not suitable for every investor. I’m NOT a financial adviser. All trading strategies are used at your own risk.
Please Use the AUTHOR’s INSTRUCTIONS link below for more information.
NOTE: The PERFORMANCE SUMMARY below does not accurately reflect the trading strategy because the entry orders generated in the strategy are based on the stock price and our actual order is a credit spread that is profitable even if the price moves against us a little bit. What could show as a loss in the strategy could be a profit in the credit spread.
Market Makers MoveV1,V2, & V3: New indicator release!! In this fantastic new indicator, you can do the following:
- Specify a particular EMA crossing combination (between a fast and a slow ema line)
- Specify the timeframe (can be independent or based on current chart timeframe, by default)
- Select one of four possible potential profiles (ETFs Only, Crypto, and more!) OR input manually any of 40 possible tickers AND
- Assess whether entry for calls or puts is appropriate based on price action on realtime view between 2 tickers, one which will be the highest (strongest) trend up and the other going the lowest (weakest) trend possible, all at the same time!
This indicator is by no means financial advice!! So by all means, use according to proper assessment and risk management! There are various tooltips instilled to each field and table of the indicator, all to better guide you for better end results!
Cheers! and good luck in you!!

Index Reversal Range with Volatility Index or VIXWhat is the Indicator?
• The indicator is a visualization of maximum price in which the respective index can go up to in comparison with it's Volatility Index or VIX.
Who to use?
• Intraday
• Swing
• Position
• Long term Investors
• Futures
• Options
• Portfolio Managers
• Mutual Fund Managers
• Index Traders
• Volatility based Traders
• Long term Investors and Options Traders gets the maximum benefit
What timeframe to use?
• 1 Year: Position & Investors
• 6 Months: Position & Investors
• 3 Months: Swing & Position
• 1 Month: Swing & Position
• 1 Week: Swing
• 1 Day: Swing
• 1 Hour: Intraday & Swing
What are Upper and Lower lines?
• Upper Line: If the index price reach closer to the Upper line there is a high chance of reversal to Bearish trend.
• Lower Line: If the index price reach closer to the Lower line there is a high chance of reversal to Bullish trend.
• This need to be confirmed with multiple levels like Daily, Weekly, Monthly etc.
How to use?
• If the price reach closer to that level there is a high chance of reversal from the current trend.
• To identify the reversal zone of the index.
• To identify the trend.
• Option Traders can Sell a Call or Put Option from that level.
• Long term Investors, Position or Swing traders can plan for a Long entry.
• Intraday traders can use lower timeframes to do the same.
Indicator Menu
• Input VIX: Identify the VIX Symbol of your Index and type it in the box.
• For example for NIFTY Index chart type INDIAVIX in the box.
• Choose multiple timeframes according to your convenience.
How to turn on indicator Name and Value labels?
• Right side of the screen >
• Right click on the Price scale >
• Labels > Indicators and financial name labels, Indicators and financial value labels
Further Reading:
• Various videos and reading materials are available about this method.

Sentimental Cycles with CrossingsThis indicator provides the following options, where you can choose to display:
DEMA TEMA cycles, filtered by default with sentiment.
Sentiment cloud, based on the 200ema area between the 1 minute and 1 hour lines.
One or both ema crossings with their respective timeframes (independent from current chart timeframe) and optional line display.
One or two tickers and their respective crossings based on selected timeframes.
Additional EMA lines supplied with their very own timeframe.
This indicator is intended to be used any way suitable to the user, nearly every aspect is customizable, and the defaults are just enough to get you started on deciding whether it's time to enter calls or puts.
TIPS for optimal results:
- Try using 2 charts: the 1 minute and the 1 hour per symbol. Under the 1 minute chart, use the 3 minute and 5 minute timeframe for crossings.
- Try to start a position when a sentimental DEMA TEMA cloud is beginning to form. The first bar usually pays thicc.
- Tickers SPY and VXX can be of good reference for market direction. If all crossings coincide, it's because there's a strong momentum in a certain direction for the market.

Top 40 High Low Strategy for SPY, 5minThis strategy is developed based on my High Low Index SPY Top 40 indicator
Notes:
- this strategy is only developed for SPY on the 5 min chart . It seems to work with QQQ as well, but it isn't optimized for it
- P/L shown is based on 10 SPY option contracts, call or put, with strike price closest to the entry SPY price and expiry of 0 to 1 day. This includes commissions (can be changed). This is only an estimate calculated using an arbitrary multiplier factor, this can be changed in the setting
- P/L is based on $5000 initial capital
- Works with both regular / extended trading session turned on/off. However, max drawdown is 1/2 with extended trading session ON
- there is still a bug that doesn't allow alert to be created due to calculation error, will update once fixed
This strategy combines signals from the following indicators to determine entry signals:
- High Low Index SPY Top 40
- MACD
- Linear Regression Slope
Entry signal is triggered when:
- High Low Index line crosses the EMA line
- MACD trending in the same direction
- Linear Regression slope is accelerating above a threshold in the same direction, indicating a strong trend
Profit target(PT) and stop loss(SL) are determined using ATR value, with 2:1 Reward to Risk ratio as default.
Exit signal may be triggered prior to PT or SL trigger when:
- High Low Index SPY Top 40 shows a reversal after overbought or oversold conditions (optional)
- Opposite entry signal is triggered
There are a number of optional settings:
- Turn on/off "option trading", P/L will be calculated using share price only without multiplication factor for trading option contracts
- # of options per trade, default to 10
- Reinvest with profit made
- Trade with trailing SL after PT hit
- Take profit early based on Top 40 overbought/oversold
- Trade 0/1 day expiry. This will signal exit by the end of the day on Mon/Wed/Fri, and only exits 1/2 of positions (if in profit) on Tues/Thurs
- Can reduce the SL level without impacting PT
- No entry between 10:05 - 10:20 (don't ask me why, but statistically it performs better)
Consider donating me some of your profit if you make $$$ hahaha~ ;)
Enjoy~~

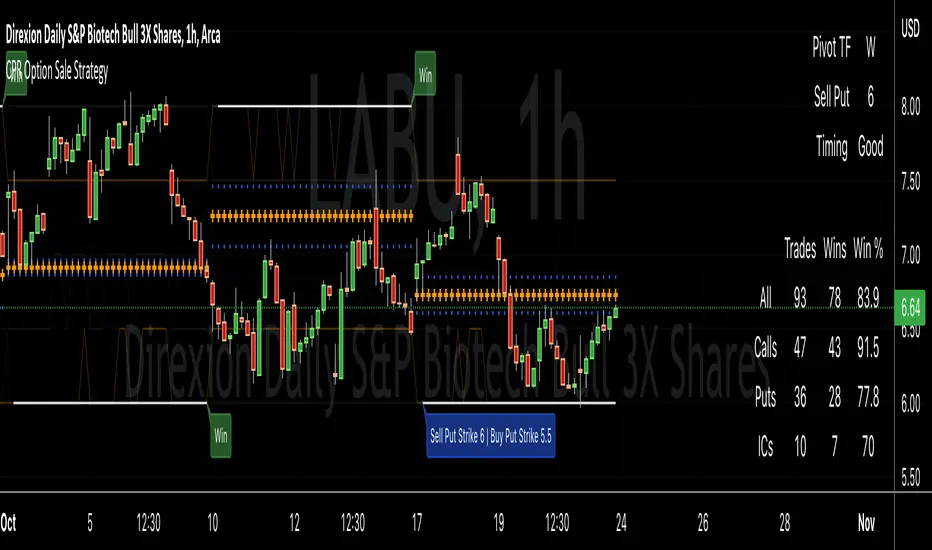
CPR Option Selling StrategyGood afternoon traders,
This is a script I built for option selling, in attempt to have a high success rate.
The gist of how it works:
It uses the opening or close of the current chart's timeframe opening bar when referenced against a designated (higher) timeframe's central pivot range (CPR).
Using that comparison, this script calculates an option to sell: put, call, or iron condor. It will calculate a call value using an average of the CPR central pivot and the max value of the prior higher timeframe's high or R1 (whichever is higher.)
It does the same for the put side, but uses the higher timeframe's low or S1 (whichever is lower.)
It will use the option on the other side of the source (open or close) of the CPR as the "option in play."
Settings:
There are many settings, most are simply "viewable" settings, and probably self explanatory, others, not so much:
"Source for Trigger" - this is the value used on the "opening bar," such as the close. This value is the one compared to the Central Pivot Range in determining whether to sell a call (if the source is lower,) sell a put (if the source is higher,) or an iron condor if it's in the CPR.
"Show Historical Win/Loss Percentages" - this shows a table in the bottom right of the W/L percentages for the current ticker and settings. Used for a quick glance at historical success rates.
"Extend Developing Levels Into the Future" - This will extend the developing values for CPR values, call and put values into the future (good for trying to trade early or setting up pre-market trades, assuming there will not be huge gap in one direction or another.)
"Select Higher Timeframe" - "Auto" will choose the higher timeframe for you. "Manual" will use the next field...
"If Manual, Timeframe for Pivots" - allows you to choose a different higher timeframe.
The next two sections are simply whether to show the plots for different levels of traditional and/or camarilla pivot points.
The last section will allow you to just filter on certain days. Really only useful for "backtesting" certain 0DTE trades on some daily options during the hourly chart.
Example use:
An example use (which I completed last week) on the chart referenced in this share: I sold a put-spread for $0.90, selling a 590 and buying a 570 strike in the middle of the week. I was looking at an hourly timeframe chart with a weekly pivot timeframe for the strategy.
Obviously, making only $0.90 on a $20 spread, there is a lot more to lose than to make, but I did some other analysis to go with it, so I felt safe, and I had a stop set for $1.50. So it worked, along with 3 other plays I did, very similar, and if that "Historical Win/Loss Percentage" is accurate, which I am fairly certain it is, I felt good about it.
The key all comes down to what you sell it for, right? That piece only you can determine. :)
Happy trading and enjoy,
Deuce
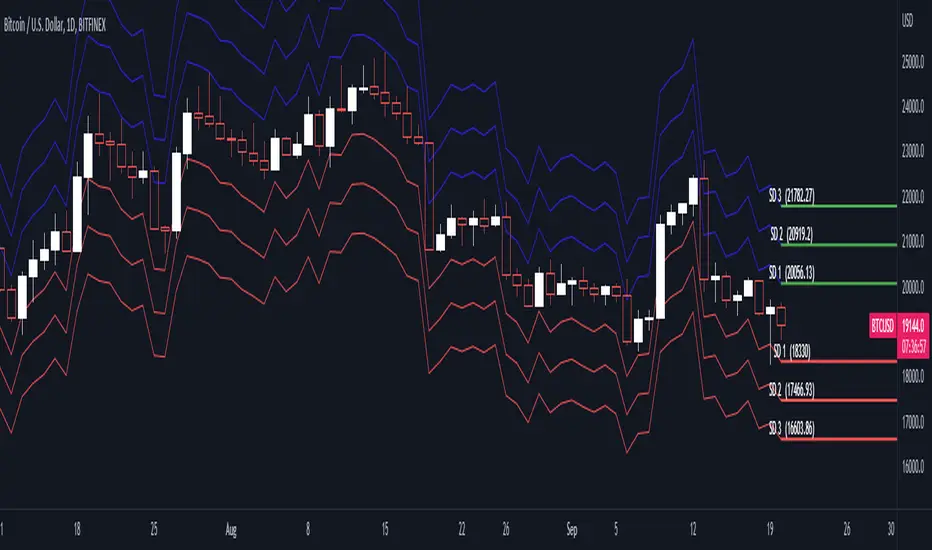
Standard Deviation ModelsBITFINEX:BTCUSD
The standard deviation model can be used for options traders that are selling options contracts to collect a premium to identify a specific range of strike prices which are optimal for selling based on the underlying asset’s historical price fluctuations. Traders will be able to identify the statistical likelihood that their options contract will be in the money (ITM) or out of the money (OTM).
Basic statistics of normal distributions (probability curve):
-1 SD to +1 SD = 68% likelihood
-2 SD to + 2 SD = 95% likelihood
-3 SD to +3 SD = 99% likelihood
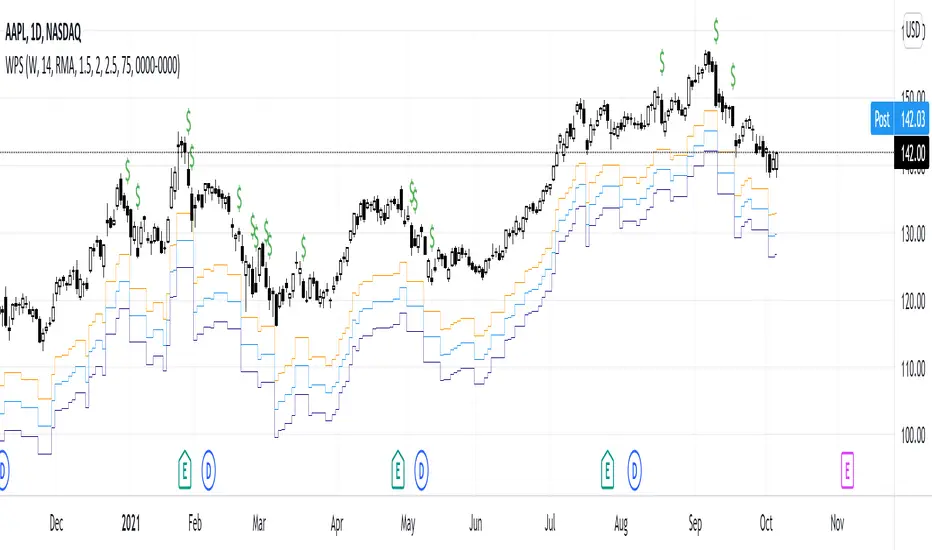
Weekly Put SaleWeekly Put Sale
This study is a tool I use for selling weekly puts at the suggested strike prices.
1. The suggested strike prices are based on the weekly high minus an ATR multiple which can be adjusted in the settings
2. You can also adjust the settings to Monthly strike prices if you prefer selling options further out
3. I suggest looking for Put sale premium that is between 0.25% to 0.75% of the strike price for weekly Puts and 1% to 3% of the strike price for monthly Puts
Disclaimers: Selling Puts is an advanced strategy that is risky if you are not prepared to acquire the stock at the strike price you sell at on the expiration date. You must make your own decisions as you will bear the risks associated with any trades you place. To sum it up, trading is risky, and do so at your own risk.
Strangle MoverStrangle Mover is an indicator especially made for option writer / seller who wants to do strangle and adjust the position based on the market trend / movement. It can be use for iron condor strategy too.
Settings: User must know the settings of the indicator before using .
First one is Option Strike Difference , user need to enter the correct option strike difference of the particular instrument / stock / indices, one can get it from option chain. For example, Nifty having 50 points differences in each option strike and bank nifty having 100 points. So, Nifty user must enter 50 and Bank nifty user must enter 100 in this setting.
Second is strangle distance multiply , user can choose the distance from the trend price. For example, nifty user selects 3, strangle line starts showing (3*50) 150 points away strike from the trend area.
Third is Length, default value is 20 which generally used in vwma, donchian channel and other trend finding indicators. User can change if need.
Note: Option Strike Difference and Strangle Distance Multiply is very important setting to use this indicator.
User must do adjustments based on their own risk and strategy. This indicator is only for education purpose.

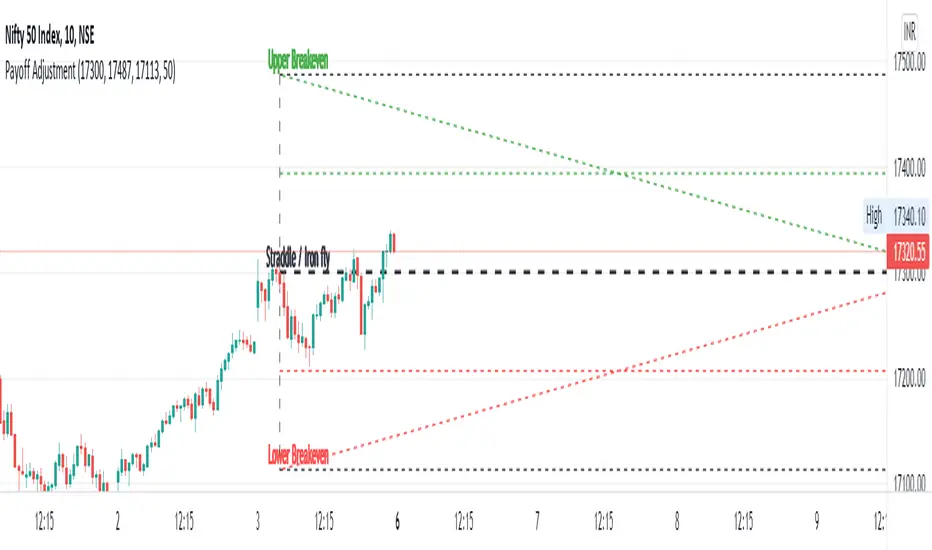
Straddle / Ironfly AdjustmentStraddle / Iron fly Adjustment is an indicator to assist (especially) Nifty / Bank Nifty Option Writers / Sellers (other instrument writers also) to draw their straddle / iron fly payoff diagram in the chart, mainly max profit and breakeven points and do adjustment based on the market movement.
Basic Idea: (My Conclusion for making this Indicator)
1) For Straddle / Iron fly writers need to adjust their position based on the market movement.
2) Here I give two adjustment ideas which one is my favorite method and another one is one of my friends is using.
a) Price Vs Time based Adjustment
I usually wait until price cross the price vs time line to do any adjustment. Generally, price vs time-based adjustment gives you more point to enter any adjustment in initial day/time when you created the straddle / iron fly. But one later it will reduce the range it become narrow.
b) Percentage based Adjustment
This method using by one of my friends which is based percentage between straddle / iron fly line and upper / lower breakeven points. Generally, he using 50 percentage. In this indicator we do have option to change the percentage between 25 to 100.
User must give inputs to see the straddle / iron fly diagram (Max Profit, Breakeven points, Adjustment, Percentage based adjust line and so)
This is not an intraday indicator and also its not suggesting you to take any buy/sell or straddle/iron fly positions. Its just giving an opportunity to draw a payoff diagram of for max profit and breakeven zone. And also helps to identify the adjustment based given scenario.
Happy Trading 😊
Saravanan Ragavan