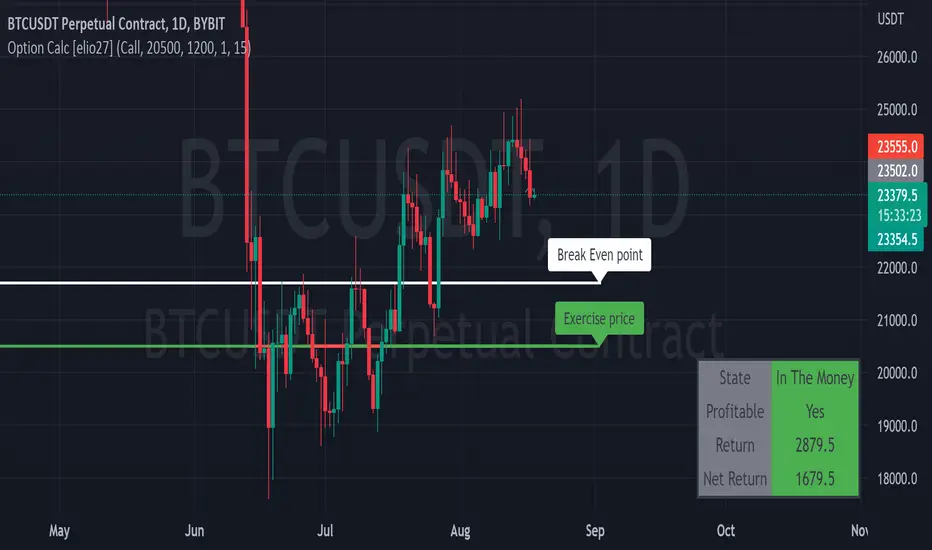
Option Calculator [elio27]Option Calculator is a simple tool to help people visualize their option positions directly on the chart, it also gives some useful numbers about the position, such as the Break Even point or the net return for example.
Be careful what you do with options, you can easily make mistakes as it is not as easy as spot or futures trading for beginners.
Options
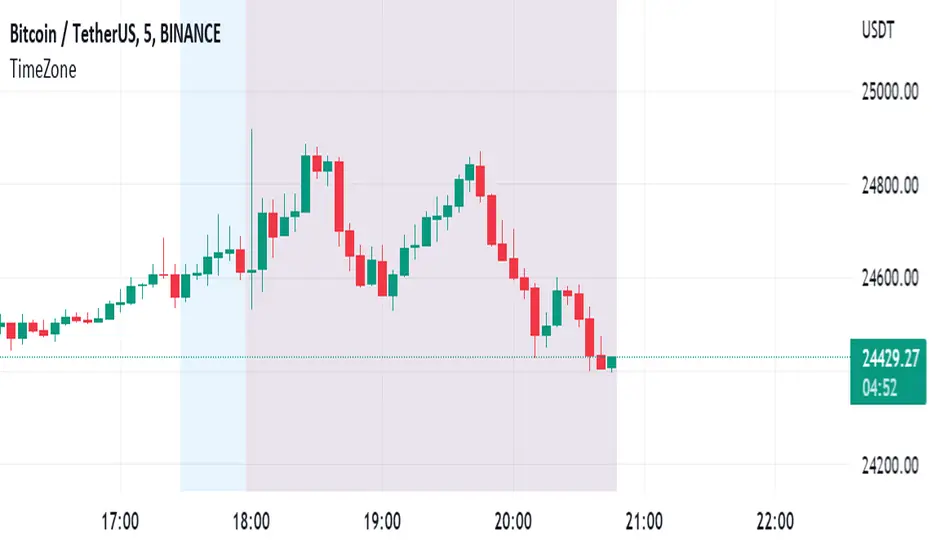
TimeZoneThis is a script that marks the Time zone on the chart of the specified markets of Europe on the Local charts of your Indices and Stocks.
PharshK RSI and Zigzag with H/LIt is with RSI level
and Zigzag Pattern that Market goes on Maximum level and Lower Level
And it is also Showing High and Law Level of last Moving Candle so it is easy to entry and Hold

PharshK RSI and Zigzag with H/LIt is with RSI level
and Zigzag Pattern that Market goes on Maximum level and Lower Level
And it is also Showing High and Law Level of last Moving Candle so it is easy to entry and Hold

Timed AlertTradingView doesn't offer a way easily set timed alerts. This script solves that problem and also allows you to set variables in the script similar to other alerts.
The variables can be found here .

Strategy BackTest Display Statistics - TraderHalaiThis script was born out of my quest to be able to display strategy back test statistics on charts to allow for easier backtesting on devices that do not natively support backtest engine (such as mobile phones, when I am backtesting from away from my computer). There are already a few good ones on TradingView, but most / many are too complicated for my needs.
Found an excellent display backtest engine by 'The Art of Trading'. This script is a snippet of his hard work, with some very minor tweaks and changes. Much respect to the original author.
Full credit to the original author of this script. It can be found here: www.tradingview.com
I decided to modify the script by simplifying it down and make it easier to integrate into existing strategies, using simple copy and paste, by relying on existing tradingview strategy backtester inputs. I have also added 3 additional performance metrics:
- Max Run Up
- Average Win per trade
- Average Loss per trade
As this is a work in progress, I will look to add in more performance metrics in future, as I further develop this script.
Feel free to use this display panel in your scripts and strategies.
Thanks and enjoy :)

Grid Settings & MMThis script is designed to help you plan your grid trading or when averaging your position in the spot market.
The script has a small error (due to the simplification of the code), it does not take into account the size of the commission.
You can set any values on all parameters on any timeframe, except for the number of orders in the grid (from 2 to 5).
The usage algorithm is quite simple:
1. Connect the script
2. Install a Fibo grid on the chart - optional (settings at the bottom of the description)
3.On the selected pair, determine the HighPrice & LowPrice levels and insert their values
4.Evaluate grid data (levels, estimated profit ’%’, possible profit ‘$’...)
And it's all)
Block of variables for calculating grid and MM parameters
Variables used regularly
--- HighPrice and LowPrice - constant update when changing pairs
--- Deposit - deposit amount - periodically set the actual amount
Variables that do not require permanent changes
--- Grids - set the planned number of grids, default 5
--- Steps - the planned number of orders in the grid, by default 5
--- C_Order - coefficient of increasing the size of orders in the base coin, by default 1.2
--- C_Price - trading levels offset coefficient, default 1.1
--- FirstLevel - location of the first buy level, default 0.5
--- Back_HL - number of candles back, default 150
*** For C_Order and C_Price variables, the value 1 means the same order size and the same distance between buy levels.
The fibo grid is used for visualization, you can do without it, ! it is not tied to the script code !
You can calculate the levels of the Fibo grid using the formula:
(level price - minimum price) / (maximum price - minimum price)
For default values, grid levels are as follows:
1 ... 0.5
2...0.359
3 ... 0.211
4...0.0564
5...-0.1043
Short description:
in the upper right corner
--- indicator of the price movement for the last 150 candles, in % !!! there is no task here to "catch" the peak values - only a relative estimate.
in the upper left corner
--- total amount of the deposit
--- the planned number of grids
--- “cost” of one grid
--- the size of the estimated profit depending on the specified HighPrice & LowPrice
in the lower left corner
--- Buy - price levels for buy orders
--- Amount - the number of purchased coins in the corresponding order
--- Sell - levels of profit taking by the sum of market orders in the grid
--- $$$ - the sum of all orders in the grid, taking into account the last active order
--- TP - profit amount by the amount of orders in the grid

Banknifty Volume - IN
This simple indicator computes the average Relative Strength Index of each Banknifty stock and displays the volume on the chart with color schemes while the average line indicates the average RSI of all Bank Stocks. This indicator works on Banknifty and its stocks.
It works on all time frames
How You can use this?
You can use this indicator for Volume analysis if the average RSI line is above the 0 line, the stock is moving upside and vice versa for Downside .

Ultra Magic 2.0 [Jay Jani]Have fun in one indicator. Many more to come.//////////////////////////////////////////////////////////////////////////////////////////////////////// ////////////////////////////////////////////////////////////////////////
Candle Stick UpdateHeikin ashi chart so powerful that you can understand trend direction easily. But sometimes, this type of chart doesn't update properly and make no sense on real time. So I made this script. You can now change candle stick style default to heikin ashi (default / modified version) on the real time default chart without switching heikin ashi chart. Enjoy traders!!! And don't forget to press the like button :)

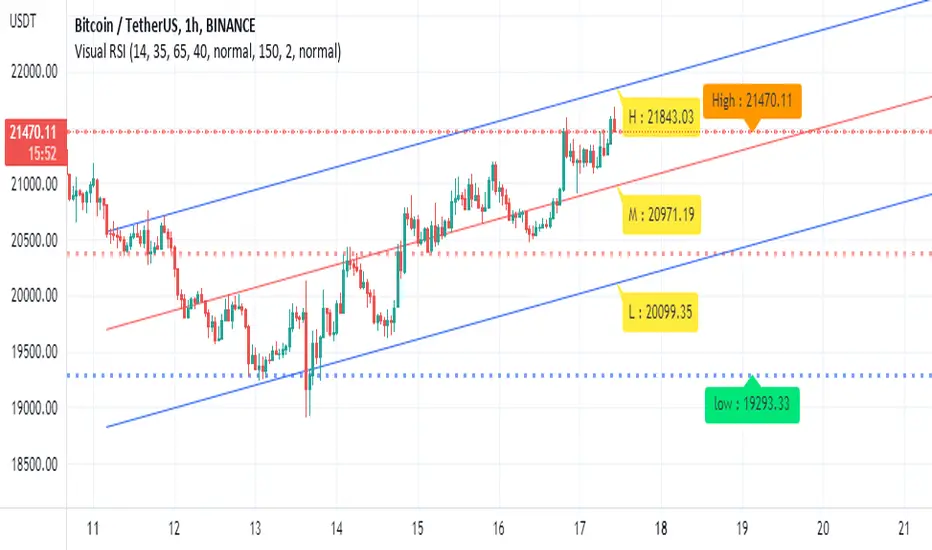
Visual RSIThis is a visual format of regular RSI on the screen.
The indicator give you the RSI level for the high and lows and average as well. So it very easy to use it as you normally do with any RSI
buy point are when price reach bellow lower level and start breaking up. sell vice versa
it a concept idea to make our regular RSI more effective for the common user
I hope you like it
1 min chart
15min
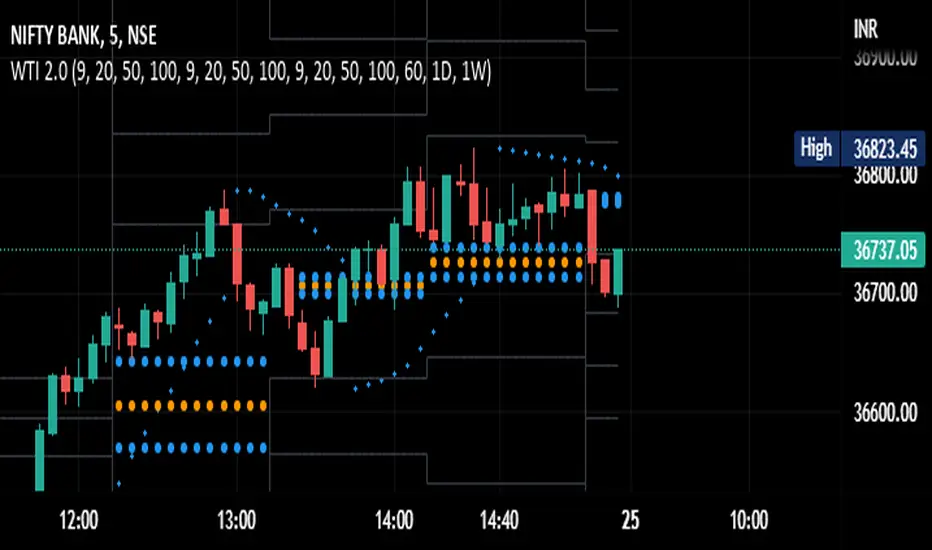
Price Pivots for NSE Index & F&O StocksPrice Pivots for NSE Index & F&O Stocks
What is this Indicator?
• This indicator calculates the price range a Stock or Index can move in a Day, Week or Month.
Advantages of this Indicator
• This is a Leading indicator, not Dynamic or Repaint.
• Helps to identify the tight range of price movement.
• Can easily identify the Options strike price.
• The levels are more reliable and authentic than Gann Square of 9 Levels.
• Develops a discipline in placing Targets.
Disadvantages of this Indicator
• The indicator is specifically made for National Stock Exchange of India (NSE) listed index and stocks.
• The indicator is calculated only for index NIFTY, BANKNIFTY, FINNIFTY, MIDCPNIFTY and Stocks listed in Futures and Options.
• The indicator shows nothing for other indexes and stocks other than above mentioned.
• The data need to be entered manually.
• The data need to be updated manually when the F&O listed stocks are updated.
Who to use?
Highly beneficial for Day Traders, it can be used for Swing and Positions as well.
What timeframe to use?
• Any timeframe.
• The highlighted levels in Red and Green will not show correct levels in 1 minute timeframe.
• 5min is recommended for Day Traders.
When to use?
• Wait for proper swing to form.
• Recommended to avoid 1st 1 hour or market open, that is 9.15am to 10.15 or 10.30am.
• Within this time a proper swing will be formed.
How to use?
Entry
• Enter when the Price reach closer to the Blue line.
• Enter Long when the Price takes a pullback or breakout at the Red lines.
Exit
• Exit position when the Price reach closer to the Red lines in Long positions.
What are the Lines?
Gray Lines:
• Every lines with price labels are the Strike Prices in the Option Chain from NSE website.
• Price moves from 1 Strike Price level to another.
• The dashed lines are average levels of 2 Strike Prices.
Red & Green Lines:
• The Red and Green Lines will appear only after the first 1 hour.
• The levels are calculated based on the 1st 1 hour.
• Red Lines are important Resistance levels, these are strong Bearish reversal points. It is also a breakout level, this need to be figured out from the past levels, trend, percentage change and consolidation.
• Green Lines are important Support levels, these are strong Bullish reversal points. It is also a breakdown level, this need to be figured out from the past levels, trend, percentage change and consolidation.
What are the Labels?
• First Number: Price of that level.
• Numbers in (): Percentage change and Change of price from LTP(Last Traded Price) to that Level.
How to use?
Entry:
• Enter when price is closer to the Red or Green lines.
• Enter after considering previous Swing and Trend.
• Note the 50% of previous Swing.
• Enter Short when price reverse from each level.
• If 50% of swing and the pivot level is closer it can be a good entry.
Exit:
• Use the logic of Entry, each level can be a target.
• Exit when price is closer to the Red or Green lines.
Indicator Menu
Source
• Custom: Enter the price manually after choosing the Source as Custom to show the Pivots at that price.
• LTP: Pivot is calculated based on Last Traded Price.
• Day Open: Pivot is calculated based on current day opening price.
• PD Close: Pivot is calculated based on previous day closing price.
• PD HL2: Pivot is calculated based on previous day average of High and Low.
• PD HLC3: Pivot is calculated based on previous day average of High, Low and Close.
"Time (IST) (Vertical)"
• This is a marker of every 1 hour.
• Usually major price movement happen between previous day last 1 hour (2:15 pm) to today first 1 hour (10:15 pm).
• Two swings can happen between first 2 hour of current day.
• At the end of the day last 1 hour from 2.15 pm another important movement will happen.
• Usually rest of the time won't show any interesting movement.
To the Users
• Certain symbols may show the levels as a single line. For such symbols choose a different Source or Timeframe from the indicator menu.
• Please inform if any of the Symbol's price levels don't react to the pivots, include the Symbol a well.
• Also inform if you notice any wrong values, errors or abnormal behavior in the indicator.
• Feel free to suggest or adding new features and options.
General Tips
• It is good if Stock trend is same as that of NIFTY trend.
• Lots of indicators creates lots of confusion.
• Keep the chart simple and clean.
• Buy Low and Sell High.
• Master averages or 50%.
• Previous Swing High and Swing Low are crucial.

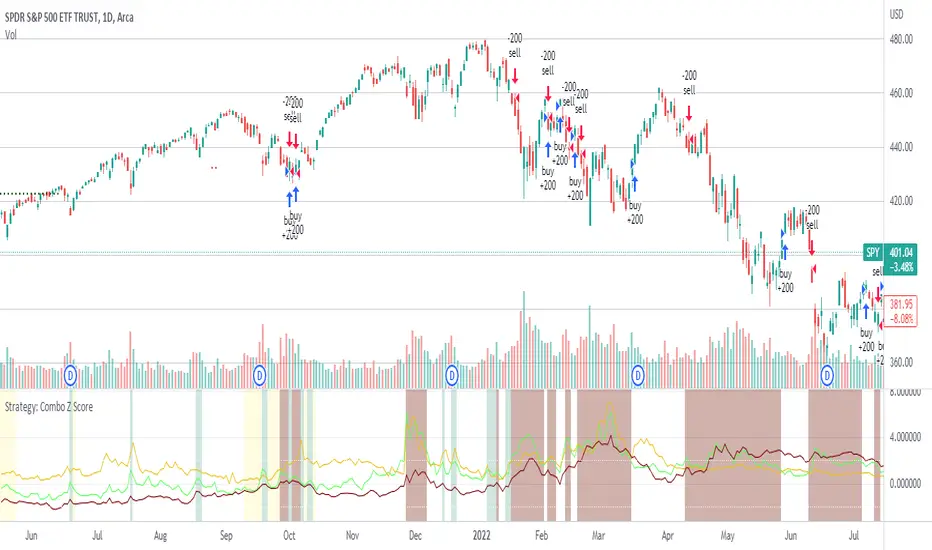
Strategy: Combo Z ScoreStrategy version of Combo Z Score
Objective:
Can we use both VIX and MOVE relationships to indicate movement in the SPY? VIX (forward contract on SPY options) correlations are quite common as forward indicators however MOVE (forward contract on bonds) also provides a slightly different level of insight
Using the Z-Score of VIX vs VVIX and MOVE vs inverted VIX (there is no M of Move so we use inverted Vix as a proxy) we get some helpful indications of potential future moves. Added %B to give us some exposure to momentum. Toggle VIX or MOVE.
If anyone has a better idea of inverted Vix to proxy forward interest in MOVE let me know.
Noticeable delta is that Vix only approach over the back test period is slightly better. Questions would be, what is the structure and nature of the market over the test period and in a bear market would MOVE or combined perform better.
Combo Z ScoreObjective:
Can we use both VIX and MOVE relationships to indicate movement in the SPY? VIX (forward contract on SPY options) correlations are quite common as forward indicators however MOVE (forward contract on bonds) also provides a slightly different level of insight
Using the Z-Score of VIX vs VVIX and MOVE vs inverted VIX (there is no M of Move so we use inverted Vix as a proxy) we get some helpful indications of potential future moves. Added %B to give us some exposure to momentum. Toggle VIX or MOVE.
If anyone has a better idea of inverted Vix to proxy forward interest in MOVE let me know.

Movable Stop + Trail + Alerthello everybody !
.....
this indicator helps you to get a better trading setting.
it's similar to the default draw tool from the trading view but the difference is you can add Trail stop and Alert .
.....
It also helps to free accounts to set more than 1 Alarm !!!
.....
Alert setting
just remember after you see set an alert if you change stop or entry, the alert will work with previous values/settings.
so you need to recreate an alert.
also don't change alert setting
.....
indicator setting
How is it works ?
...
settings
...
everything on :
you can see the information on the table
...
short sample :
everything on
...
simple short trade setting:
.....
my goal is to upgrade this indicator with your ideas.
not financial advice !
please , share your ideas with me to improve the indicator
I would like to see what you think about this indicator <3
also if you have any ideas to create an indicator or strategy you can make contact with me .
have a great day.

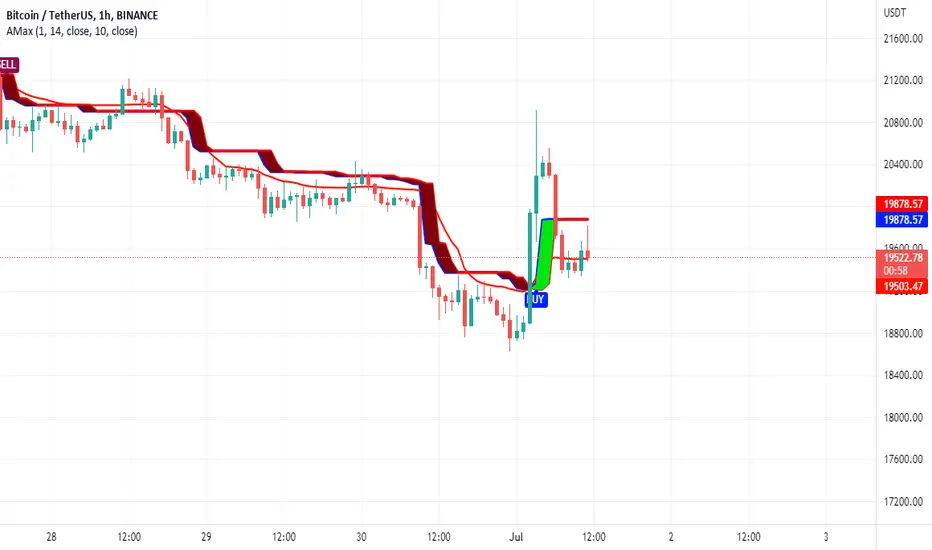
Alpha MaxAlphamax takes the power of the AlphaTrend indicator behind it, allowing signals to be received earlier without breaking the logic of AlphaTrend. It provides this with a kind of Moving Avera, which is done by a special calculation.
Configuration can be provided with the AlphaMax Length entry on the indicator. It is recommended to be used by optimizing especially for 15m and below timeframes.
RSITrendStrategyI don't know if there is any strategy based on RSI cross over. The strategy is designed based on RSI crossover, considering RSI(5) and RSI(11), with RSI(6) to identify highs & lows.
I used this strategy to trade in Nifty 50 & Nifty bank indices. Whenever there is long mentioned on chart, I go for buying call option with premium near to 300, and placing stoploss of 50 on candle closing basis, vice versa.
Target is open until short is mentioned on the chart. Sometimes, i used standard pivot points as well to mark my targets and also to trail my trades.

Multi EMA with labels (Any timeframe)This script lets you add up to 8 EMAs (Exponential Moving Averages) that can be set to any timeframe and length. The difference between this and other EMA indicators is that it has a simple label attached to each EMA showing which timeframe it belongs to and what length it is, so you can get that information at a glance while trading without having to remember the specific settings for each EMA.
I was personally looking for something like this because I like clarity on my chart and these labels really help. The existing EMA indicators I found with labels don't support multiple timesframes or if they do, they don't include the timeframe itself in the label, so that's why I created this simple script and shared it in case somebody else is looking for the same. Enjoy.

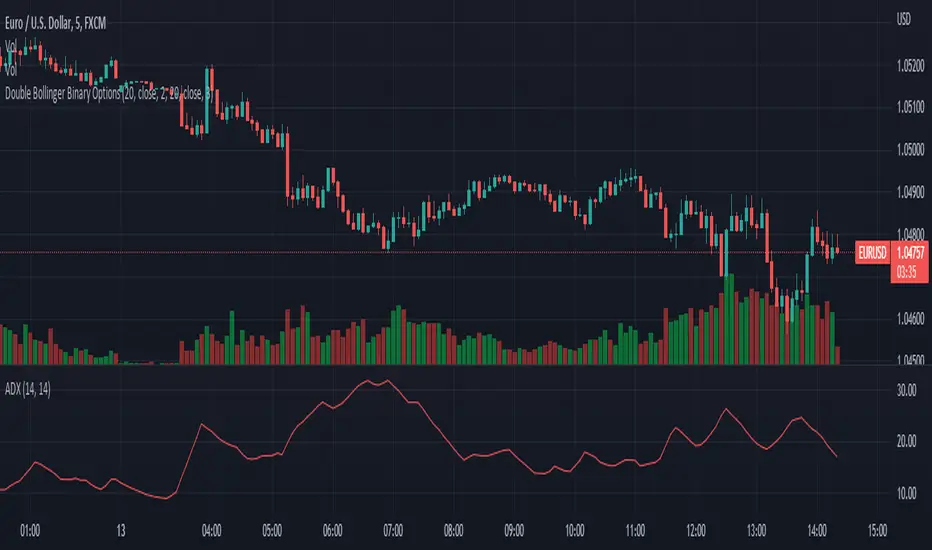
Double Bollinger Binary OptionsThis script uses 2 Bollinger bands and rsi oversold and overbought region to give signals. Basically, it detects those conditions where the market gets spiked in one direction aggressively(mostly during news) and then reverses back, although signals occur less frequently, this strategy is worth trying. Keep the timeframe for 5 minutes and trade for 5 candles i.e. 25 minutes :)
Index Reversal Range with Volatility Index or VIXWhat is the Indicator?
• The indicator is a visualization of maximum price in which the respective index can go up to in comparison with it's Volatility Index or VIX.
Who to use?
• Intraday
• Swing
• Position
• Long term Investors
• Futures
• Options
• Portfolio Managers
• Mutual Fund Managers
• Index Traders
• Volatility based Traders
• Long term Investors and Options Traders gets the maximum benefit
What timeframe to use?
• 1 Year: Position & Investors
• 6 Months: Position & Investors
• 3 Months: Swing & Position
• 1 Month: Swing & Position
• 1 Week: Swing
• 1 Day: Swing
• 1 Hour: Intraday & Swing
What are Upper and Lower lines?
• Upper Line: If the index price reach closer to the Upper line there is a high chance of reversal to Bearish trend.
• Lower Line: If the index price reach closer to the Lower line there is a high chance of reversal to Bullish trend.
• This need to be confirmed with multiple levels like Daily, Weekly, Monthly etc.
How to use?
• If the price reach closer to that level there is a high chance of reversal from the current trend.
• To identify the reversal zone of the index.
• To identify the trend.
• Option Traders can Sell a Call or Put Option from that level.
• Long term Investors, Position or Swing traders can plan for a Long entry.
• Intraday traders can use lower timeframes to do the same.
Indicator Menu
• Input VIX: Identify the VIX Symbol of your Index and type it in the box.
• For example for NIFTY Index chart type INDIAVIX in the box.
• Choose multiple timeframes according to your convenience.
How to turn on indicator Name and Value labels?
• Right side of the screen >
• Right click on the Price scale >
• Labels > Indicators and financial name labels, Indicators and financial value labels
Further Reading:
• Various videos and reading materials are available about this method.

Impulse & SecurityThe logic of the indicator is simple. We have a large candle for the period N. In its range there are candles with the same extremums in the direction of the trend → Alert.
Important: It is not suitable for all coins and not for all TF

Lal OnlineI made this indicator to help my friend to see the market direction and finding strike price. Regards. Lal Adidasan
