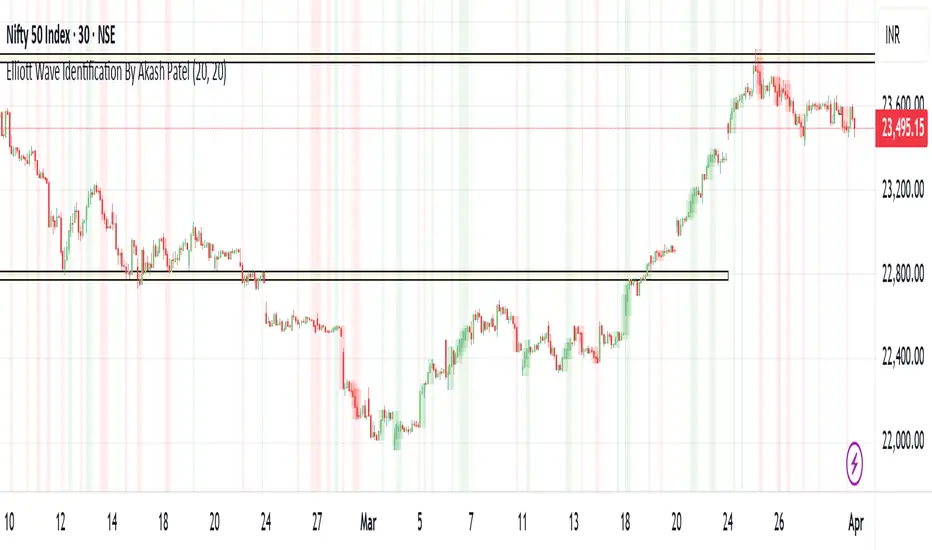
Elliott Wave Identification By Akash Patel
This script is designed to visually highlight areas on the chart where there are consecutive bullish (green) or bearish (red) candles. It also identifies sequences of three consecutive candles of the same type (bullish or bearish) and highlights those areas with adjustable box opacity. Here's a breakdown of the functionality:
---
### Key Features:
1. **Bullish & Bearish Candle Identification:**
- **Bullish Candle:** When the closing price is higher than the opening price (`close > open`).
- **Bearish Candle:** When the closing price is lower than the opening price (`close < open`).
2. **Consecutive Candle Counter:**
- The script counts consecutive bullish and bearish candles, which resets when the direction changes (from bullish to bearish or vice versa).
- The script tracks these counts using the `bullishCount` and `bearishCount` variables, which are incremented based on whether the current candle is bullish or bearish.
3. **Highlighting Candle Areas:**
- If there are **3 or more consecutive bullish candles**, the script will highlight the background in a green color with 90% transparency (adjustable).
- Similarly, if there are **3 or more consecutive bearish candles**, the script will highlight the background in a red color with 90% transparency (adjustable).
4. **Three-Candle Sequence:**
- The script checks if there are three consecutive bullish candles (`threeBullish`) or three consecutive bearish candles (`threeBearish`).
- A box is drawn around these areas to visually highlight the sequence. The boxes extend to the right edge of the chart, and their opacity can be adjusted.
5. **Box Creation:**
- For bullish sequences, a green box is created using the high and low prices of the three candles in the sequence.
- For bearish sequences, a red box is created in the same manner.
- The box size is determined by the highest high and the lowest low of the three consecutive candles.
6. **Box Opacity:**
- You can adjust the opacity of the boxes through the input parameters `Bullish Box Opacity` and `Bearish Box Opacity` (ranging from 0 to 100).
- A higher opacity will make the boxes more solid, while a lower opacity will make them more transparent.
7. **Box Cleanup:**
- The script also includes logic to remove boxes when they are no longer needed, ensuring the chart remains clean without excessive box overlays.
8. **Extending Boxes to the Right:**
- When a bullish or bearish sequence is identified, the boxes are extended to the right edge of the chart for continued visibility.
---
### How It Works:
- **Bullish Area Highlight:** When three or more consecutive bullish candles are detected, the background will turn green to indicate a strong bullish trend.
- **Bearish Area Highlight:** When three or more consecutive bearish candles are detected, the background will turn red to indicate a strong bearish trend.
- **Three Consecutive Candle Box:** A green box will appear around three consecutive bullish candles, and a red box will appear around three consecutive bearish candles. These boxes can be extended to the right edge of the chart, making the sequence visually clear.
---
### Adjustable Parameters:
1. **Bullish Box Opacity:** Set the opacity (transparency) level of the bullish boxes. Ranges from 0 (completely transparent) to 100 (completely opaque).
2. **Bearish Box Opacity:** Set the opacity (transparency) level of the bearish boxes. Ranges from 0 (completely transparent) to 100 (completely opaque).
---
This indicator is useful for identifying strong trends and visually confirming market momentum, especially in situations where you want to spot sequences of bullish or bearish candles over multiple bars. It can be customized to suit different trading styles and chart preferences by adjusting the opacity of the boxes and background highlights.
Options
Trading Capital Management for Option SellingTrading Capital Management for Option Selling
This Pine Script indicator helps manage trading capital allocation for option selling strategies based on price percentile ranking. It provides dynamic allocation recommendations for index options (NIFTY and BANKNIFTY) and individual stock positions.
Key Features:
- Dynamic buying power (BP) allocation based on close price percentile
- Flexible index allocation between NIFTY and BANKNIFTY
- Automated calculation of recommended number of stock positions
- Risk management through position size limits
- Real-time INDIA VIX monitoring
Main Parameters:
1. Window Length: Period for percentile calculation (default: 252 days)
2. Thresholds: Low (30%) and High (70%) percentile thresholds
3. Capital Settings:
- Trading Capital: Total capital available
- Max BP% per Stock: Maximum allocation per stock position
4. Buying Power Range:
- Low Percentile BP%: Base BP usage at low percentile
- High Percentile BP%: Maximum BP usage at high percentile
5. Index Allocation:
- NIFTY/BANKNIFTY split ratio
- Minimum and maximum allocation thresholds
Display:
The indicator shows two tables:
1. Common Metrics:
- Total BP Usage with percentage
- Current INDIA VIX value
- Current Close Price Percentile
2. Capital Allocation:
- Index-wise BP allocation (NIFTY and BANKNIFTY)
- Stock allocation pool
- Recommended number of stock positions with BP per stock
Usage:
This indicator helps traders:
1. Scale positions based on market conditions using price percentile
2. Maintain balanced exposure between indices and stocks
3. Optimize capital utilization while managing risk
4. Adjust position sizing dynamically with market volatility

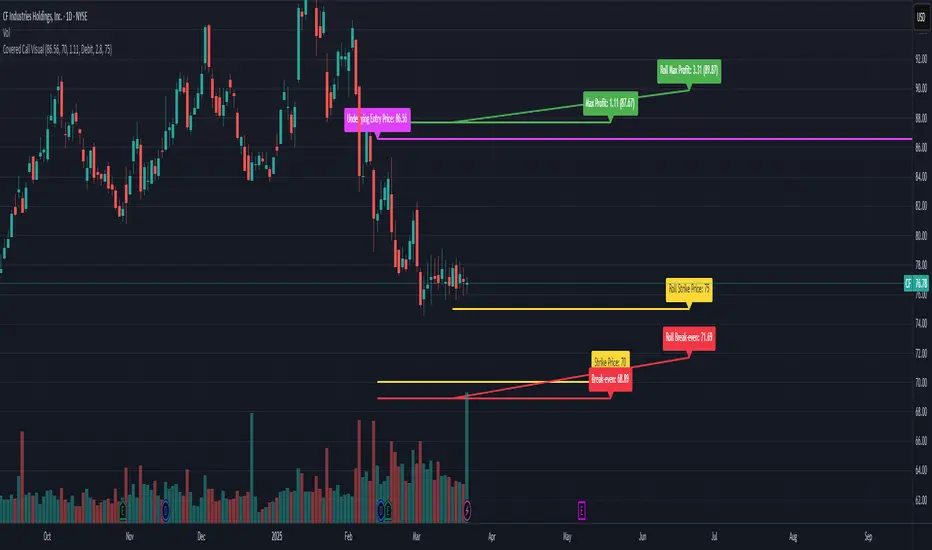
Covered Call VisualYou enter Covered Call details and this draws the following lines:
Max Profit
Entry Price
Strike Price
Break even
You also enter entry and expiration dates and the lines will plot between those dates with the exception of the entry price.
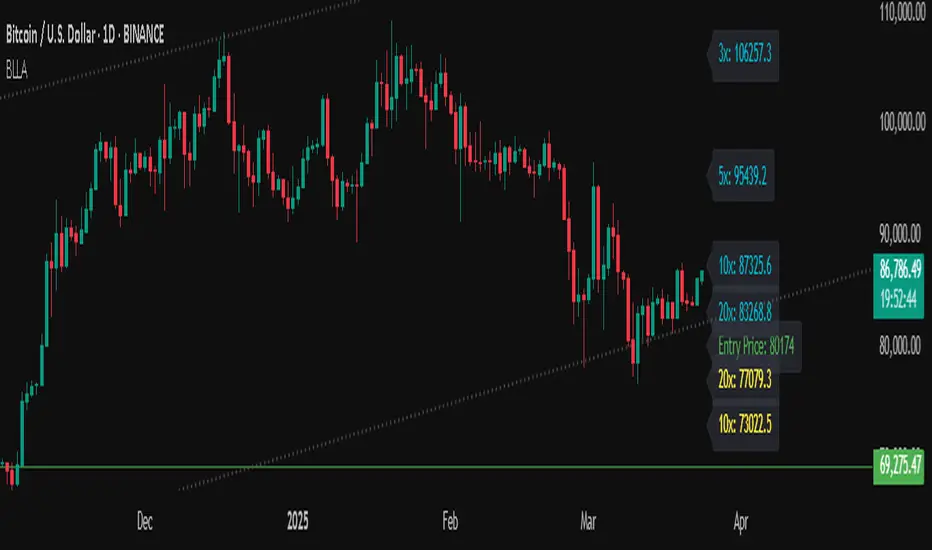
Binance Leveraged Liquidations ApproximationBinance Leveraged Liquidations Approximation (BLLA)
The Binance Leveraged Liquidations Approximation (BLLA) indicator is a tool designed to estimate liquidation levels for leveraged trading on Binance. It calculates the approximate prices at which liquidations could occur for long and short positions, based on the entry price and leverage levels selected by the user.
Key Features:
Liquidation Level Calculation:
Estimates liquidation prices for multiple leverage levels (e.g., 20x, 10x, 5x, etc.).
Supports both long and short positions.
Customization:
Allows the user to manually input the entry price or automatically calculate it as the midpoint between the low and high of a defined period.
Leverage levels are configurable, enabling the indicator to adapt to different trading strategies.
Clear Visualization:
Displays liquidation levels directly on the chart, with labels indicating the corresponding leverage.
Uses distinct colors for long positions (yellow) and short positions (blue).
Recommended Use:
Risk Management: Helps identify liquidation levels to adjust stop-loss orders and manage risk in leveraged trading.
Market Analysis: Provides a quick overview of key levels where significant price movements might occur due to mass liquidations.
Settings:
Entry Price: Enter manually or leave at 0.0 to calculate automatically.
Leverage: Configure desired leverage levels (e.g., 20x, 10x, 5x, etc.).
Transparency and Display: Adjust the transparency of the lines and the number of bars displayed.
Quick Instructions:
Add the indicator to your chart.
Enter the entry price or leave it at 0.0 to calculate automatically.
Configure leverage levels according to your strategy.
Observe liquidation levels on the chart and use them to manage your risk.
Note:
This indicator is an approximation and does not guarantee absolute accuracy of liquidation levels, as these may vary depending on market conditions and exchange policies.
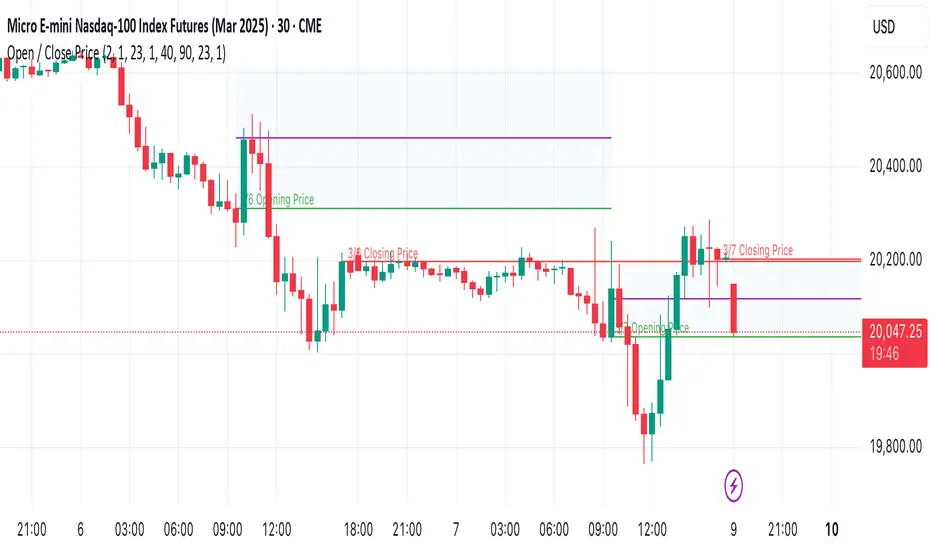
Open & Close PriceShows open and closing price; controls for extensions. Toggles for visibility.
Shades opening day gap, controls for extensions. Toggles for visibility.
Does not work for hourly or above as opening price is set to 9:30 am eastern which does not appear on the axis for hourly or above. And I'm not a coder.
But for sub hourly charts - it's an easy tool I've been looking for for a while just for myself.
It's imperfect; but sharing for anyone that was looking for something similar.
Range%This indicator displays the range of each candle i.e. High minus Low as a percentage of the previous closing price. It does not account for gaps, making it particularly useful for intraday trading. By tracking the volatility cycle of candles, this indicator helps identify periods of increased or decreased market volatility, allowing traders to pinpoint the best days to execute trades.
If the Range% is below low line candles will turn White and If Range% is above the High Line Candles will turn Red.

Ivan Gomes StrategyIG Signals+ - Ivan Gomes Strategy
This script is designed for scalping and binary options trading, generating buy and sell signals at the beginning of each candle. Although it is mainly optimized for short-term operations, it can also be used for medium and long-term strategies with appropriate adjustments.
How It Works
• The indicator provides buy or sell signals at the start of the candle, based on a statistical probability of candle patterns, depending on the timeframe.
• It is essential to enter the trade immediately after the signal appears and exit at the end of the same candle.
• If the first operation results in a loss (Loss), the script will send another trade signal at the start of the next candle. However, if the first trade results in a win (Gain), no new signal will be generated.
• The signals follow cycles of 3 candles, regardless of the timeframe. However, if a Doji candle appears, the cycle is interrupted, and no signals will be generated until the next valid cycle starts.
• The strategy consists of up to two trades per cycle: if the first trade is not successful, the second trade serves as an additional attempt to recover.
Key Points to Consider
1. Avoid trading in sideways markets – If price levels do not fluctuate significantly, the accuracy of the signals may decrease.
2. Trade in the direction of the trend – Using Ichimoku clouds or other trend indicators can help confirm trend direction and improve signal reliability. If the market is in an uptrend (bullish trend) and the indicator generates a sell signal, the most prudent decision would be to wait for a buy signal that aligns with the main trend. The same applies to downtrends, where buy signals may be riskier.
These decisions should be based on chart reading and supported by other technical analysis tools, such as support and resistance levels, which indicate zones where price might face obstacles or reverse direction. Additionally, Fibonacci retracement levels can help identify possible pullback points within a trend. Moving averages are also useful for visualizing the general market direction and confirming whether an indicator signal aligns with the overall price structure. Combining these tools can increase trade accuracy and prevent unnecessary trades against the main trend, reducing risks.
3. Works based on probability statistics – The algorithm analyzes candle formations and their statistical probabilities depending on the timeframe to optimize trade entries.
4. Best suited for scalping and binary options – This strategy performs best in 1-minute and 5-minute timeframes, allowing for multiple trades throughout the day.
Technical Details
• The script detects the candle cycle and assigns an index to each candle to identify patterns and possible reversals.
• It recognizes reference candles, stores their colors, and compares them with subsequent candles to determine if a signal should be triggered.
• Doji candle rules are implemented to avoid false signals in indecisive market conditions. When a Doji appears, the script does not generate signals for that cycle.
• The indicator displays visual alerts and notifications, ensuring fast execution of trades.
Disclaimer
The IG Signals+ indicator was created to assist traders who struggle to analyze the market by providing objective trade signals. However, no strategy is foolproof, and this script does not guarantee profits.
Trading involves significant financial risk, and users should test it in a demo account before trading with real money. Proper risk management is crucial for long-term success.

Trend Vanguard StrategyHow to Use:
Trend Vanguard Strategy is a multi-feature Pine Script strategy designed to identify market pivots, draw dynamic support/resistance, and generate trade signals via ZigZag breakouts. Here’s how it works and how to use it:
ZigZag Detection & Pivot Points
The script locates significant swing highs and lows using configurable Depth, Deviation, and Backstep values.
It then connects these pivots with lines (ZigZag) to highlight directional changes and prints labels (“Buy,” “Sell,” etc.) at key turning points.
Support & Resistance Trendlines
Pivot highs and lows are used to draw dashed S/R lines in real-time.
When price crosses these lines, the script triggers a breakout signal (long or short).
EMA Overlays
Up to four EMAs (with customizable lengths and colors) can be overlaid on the chart for added trend confirmation.
Enable/disable each EMA independently via the settings.
Repaint Option
Turning on “Smooth Indicator Lines” (repaint) uses future data to refine past pivots.
This can make historical signals look cleaner but does not reflect true historical conditions.
Turning it off ensures signals remain fixed once they appear.
Strategy Entries & Exits
On each new ZigZag “Buy” or “Sell” signal, the script closes any open position and flips to the opposite side (if desired).
Works with the built-in TradingView Strategy engine for backtesting.
Additional Inputs (Placeholders)
Volume Filter and RSI Filter settings exist but are not fully implemented in the current code. Future versions may incorporate these filters more directly.
How to Use
Add to Chart: Click “Indicators” → “Invite-Only Scripts” (or “My Scripts”) and select “Trend Vanguard Strategy.”
Configure Settings:
Adjust ZigZag Depth, Deviation, and Backstep to fine-tune pivot sensitivity.
Enable or disable each EMA to see how it aligns with market trends.
Toggle “Smooth Indicator Lines” on or off depending on whether you want repainting.
Backtest and Forward Test:
Use TradingView’s “Strategy Tester” tab to review hypothetical performance.
Remember that repainting can alter past signals if enabled.
Monitor Live:
Watch for breakout triangles or ZigZag labels to identify potential reversal or breakout trades in real time.
Disclaimer: This script is purely educational and not financial advice. Always combine it with sound risk management and thorough analysis. Enjoy exploring the script, and feel free to experiment with the different settings to match your trading style!

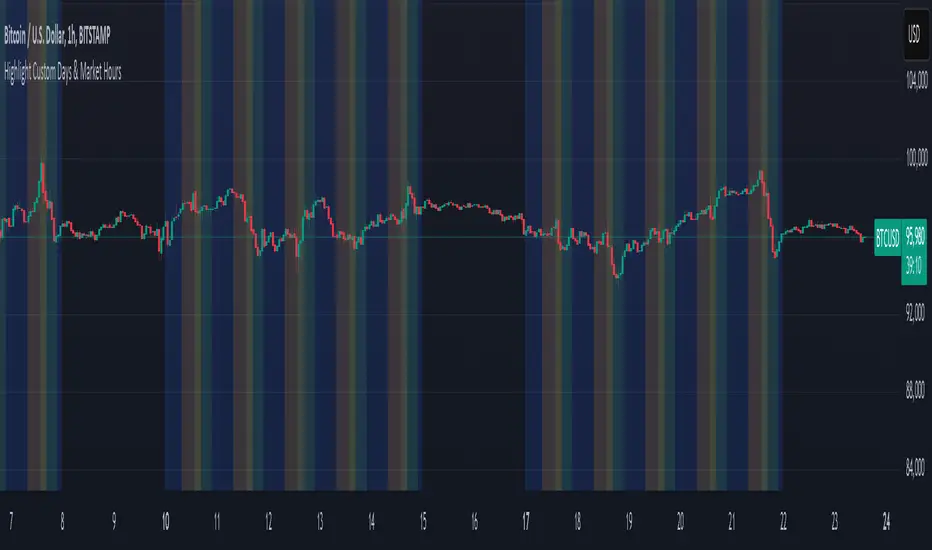
Mon to Fri + LSE and NYSE📌 Highlight Custom Days & Market Hours Indicator 📌
🔹 Overview:
This script allows traders to visually highlight specific weekdays and market sessions directly on their TradingView charts. With customizable checkboxes, you can choose which days of the week to highlight, along with session times for the New York Stock Exchange (NYSE) and London Stock Exchange (LSE).
🔹 Features:
✅ Select individual weekdays (Monday–Friday) to highlight in blue
✅ Highlight NYSE open hours (2:30 PM – 9:30 PM UK time) in green
✅ Highlight LSE open hours (8:00 AM – 4:30 PM UK time) in orange
✅ Ensures NYSE & LSE sessions are only highlighted on weekdays (no weekends)
✅ Clean and simple visualization for enhanced market awareness
🔹 How to Use:
1️⃣ Add the indicator to your TradingView chart
2️⃣ Use the settings panel to enable/disable specific weekdays
3️⃣ Toggle NYSE or LSE session highlights based on your trading preference
🚀 Perfect for traders who follow institutional sessions and want better time-based confluence in their strategies!
Put/Call RatioPut/Call Ratio Indicator
This indicator visualizes the Put/Call Ratio for various market symbols, helping traders assess market sentiment and potential reversals. It offers a dropdown menu to select from a range of Put/Call Ratios, including broad equities (CBOE), major indices (SPX, QQQ, IWM, VIX), and individual stocks (TSLA, GOOG, META, AMZN, MSFT, INTC).
The indicator plots the Put/Call Ratio with adjustable moving averages and standard deviation bands to highlight overbought or oversold conditions. A short-term moving average (default: 10 periods) is displayed with trend-based coloring, while longer-term moving averages (defaults: 30 and 200 periods) are calculated but hidden by default. Bands at 1, 1.5, and 2 standard deviations provide context for extreme readings.
Key Overbought/Oversold Signals:
Short-Term Extremes: The 10-day moving average moves beyond 1 standard deviation from the 200-day moving average, signaling potential overbought (above) or oversold (below) conditions. This will be highlighted by red or green background color.
Ratio Extremes: The Put/Call Ratio line itself crosses outside 2 standard deviations from the 200-day moving average, indicating stronger overbought or oversold zones.
Conditional coloring of the ratio line reflects its position relative to the bands, and background shading highlights when the short-term moving average crosses key levels.
Key Features:
Selectable Put/Call Ratio symbols.
Trend-colored moving averages.
Standard deviation bands for volatility analysis.
Dynamic line and background coloring for quick insights.
Usage:
Use this indicator to gauge market sentiment—high ratios may suggest bearish sentiment or oversold conditions, while low ratios may indicate bullish sentiment or overbought conditions. Combine with price action or other tools for confirmation.

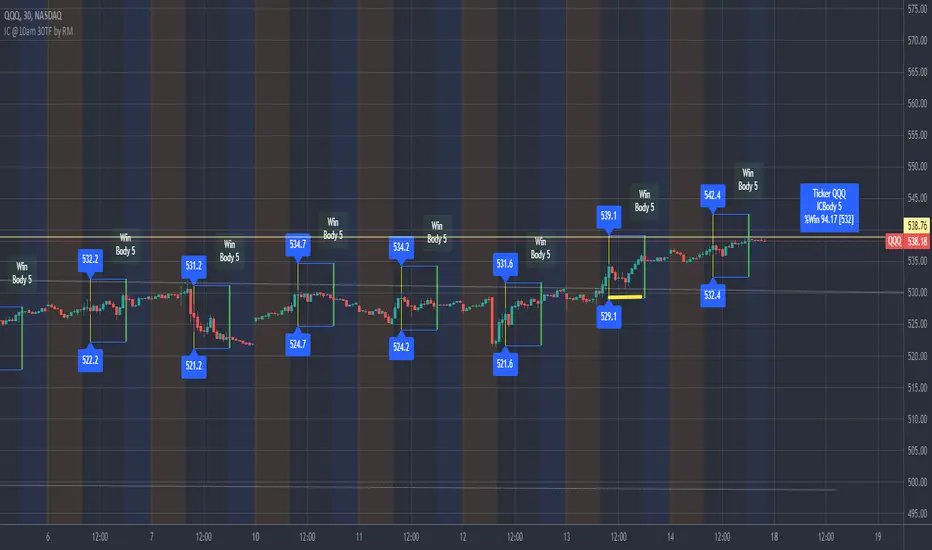
IronCondor 10am 30TF by RMThe IronCondor 10am 30TF indicator shows Iron Condor trades win rate over a large number of days.
The default ETFs in this indicators are "QQQ", "SPY", "RUT" , "CBTX" and "SPX", other entries have not been tested.
Iron Condor quick explanation:
- Iron Condors trades have four options, generally, are based around a Midpoint price (Current Market Price Strike) and
- Two equally distances Strikes for the SELL components (called the Body of the Iron Condor)
- Further away from the two SELLs, another Two BUYs for protection (not considered in this indicator)
- Iron Condors are used for Passive Income based on small gains most of the time.
The IronCondor 10am 30TF has its logic created based on the premises that:
- Most days the market prices stay within a range.
- As example the S&P market prices would stay within 1% on about 80% of the time
- The moving markets (bullish or bearish) occur about 20% of the time
- The biggest market price volatility generally occurs before market opens and then around the first hour or so of trade in the day.
- After the first hour or so of the market the prices would be most likely to stay within a range.
The operation is simple:
- At the Trade Star time in the day (say 10:30 Hrs.) draws a vertical yellow line, then
- Creates two blue horizontal lines for the SELL limits in the Iron Condor Body, at +/- 1% price boundary (check Ticker list below for values)
- At the Trade End time (say 16:00 Hrs.) checks that none of the SELL limits have been broken by highs or lows during the trade day
(The check is done calculating at Trade End time the high/lows 10 bars back for 30 min TF - timeframe)
- There is a label at each Trade End time with Win/Loss and Body value.
- There is one final label with overall calculated past performance in Win percentage out of 'n' trades
Defaults and User Entries:
- The User can modify the Midpoint price called 'IronCondor Midpoint STRIKE' (default is the Candle Close at the selected time)
- The User can modify the Body value called 'IronCondor Body' (default is the Ticker's selected value as per list below)
"QQQ" or "SPY" Body = 5
"RUT" or "CBTX" Body = 20
"SPX" Body = 60
* Disclaimer: This is not a Financial tool, it cannot used as any kind of advice to invest or risk moneys in any market,
Markets are volatile in nature - with little or no warning - and will drain your account if you are not careful.
Use only as an academic demonstrator => * Use at your own risk *
VMA [Extreme Advanced Custom Table for BTCUSD]This indicator implements a Variable Moving Average (VMA) with a 33-period length—selected in homage to the Tesla 369 concept—to dynamically adjust to market conditions. It not only calculates the adaptive VMA but also displays a custom table of key metrics directly on the chart. Here’s how to use it:
Apply to Your Chart:
Add the indicator to your chart (optimized for BTCUSD, though it can be used on other symbols) and choose your desired source (e.g., close).
Customize Your Visuals:
Trend & Price Lines: Toggle the trend colors, price line, and bar coloring based on the VMA’s direction.
Channels & Slope: Enable the volatility channel and slope line to visualize market volatility and the VMA’s momentum.
Pivot Points & Super VMA: Activate pivot high/low markers for potential reversal points and a Super VMA (SMA of VMA) for an extra smoothing layer.
Table Customization: Adjust the table’s position, colors, and font sizes as needed for your viewing preference.
Monitor Key Metrics:
The dynamic table displays essential information:
VMA Value & Trend: See the current VMA and whether the trend is Bullish, Bearish, or Neutral.
Volatility Index (vI) & Slope: Quickly assess market volatility and the VMA’s slope (both absolute and percentage).
Price-VMA Difference & Correlation: Evaluate how far the price is from the VMA and its correlation.
Higher Timeframe VMA: Compare the current VMA with its higher timeframe counterpart (set via the “Higher Timeframe” input).
Alerts for Key Conditions:
Built-in alert conditions notify you when:
The trend changes (bullish/bearish).
The VMA slope becomes extreme.
The price and VMA correlation falls below a defined threshold.
The VMA crosses its higher timeframe average.
How to Use the Script:
Add to Your Chart:
Open TradingView and apply the indicator to your BTCUSD (or any other) chart.
The indicator will overlay on your chart, plotting the VMA along with optional elements such as the price line, volatility channels, and higher timeframe VMA.
Customize Your Settings:
Inputs:
Choose your data source (e.g., close price).
Adjust the VMA length (default is 33) if desired.
Visual Options:
Toggle trend colors, bar coloring, and additional visuals (price line, volatility channels, slope line, pivot points, and Super VMA) to suit your trading style.
Table Customization:
Set the table position, colors, border width, and font size to ensure key metrics are easily visible.
Higher Timeframe:
You can change the higher timeframe input (default is Daily) to better fit your analysis routine.
Interpret the Indicator:
Trend Analysis:
Watch the color-coded VMA line. A rising (orange) VMA suggests bullish momentum, while a falling (red) one indicates bearish conditions.
What Sets This Script Apart:
Dynamic Adaptation:
Unlike a fixed-period moving average, the VMA adjusts its sensitivity in real time by integrating a volatility measure, making it more adaptive to market swings.
Multi-Layered Analysis:
With integrated volatility channels, pivot points, slope analysis, and a higher timeframe VMA, this tool gives you a fuller picture of market dynamics.
Immediate Data at a Glance:
The real-time table consolidates multiple key metrics into one view, saving time and reducing the need for additional indicators.
Custom Alerts:
Pre-built alert conditions allow for timely notifications, ensuring you don’t miss critical market changes.

HTF EMA Pivot PointsHTF EMA Pivot Points - TradingView Indicator
📌 Overview
The HTF EMA Pivot Points indicator displays Exponential Moving Averages (EMAs) from higher timeframes (HTF) on your current chart. These EMAs act as dynamic support and resistance levels, helping traders identify key areas where price is likely to react.
⚡ Key Features
✅ Plots EMAs from multiple timeframes (1H, 4H, Daily)
✅ Works on any chart (1M, 5M, 15M, etc.)
✅ Acts as pivot points for price action, helping with trade entries & exits
✅ Customizable EMA lengths for flexibility
✅ Ideal for scalping, 0DTE options trading, and swing trading
🛠 How It Works
The script calculates EMAs from 1H, 4H, and Daily charts and overlays them on your current timeframe. These levels often act as support and resistance zones, where price tends to bounce or reject.
🎯 How to Use It for Trading
📍 Bullish Setup (Buy Calls)
• Price bounces off a higher timeframe EMA (e.g., 4H or Daily EMA)
• Confirmation with RSI or Fair Value Gaps (FVGs)
📍 Bearish Setup (Buy Puts)
• Price rejects from a higher timeframe EMA
• Confirmation with other indicators (RSI, MACD, Order Flow)
🚀 Why Use This Indicator?
• Filters out noise from lower timeframe EMAs
• Confirms trend direction using key moving averages
• Helps avoid false breakouts by identifying strong institutional levels
This is a must-have tool for traders who rely on higher timeframe confluence for scalping, options trading, or swing trading. 📈🔥

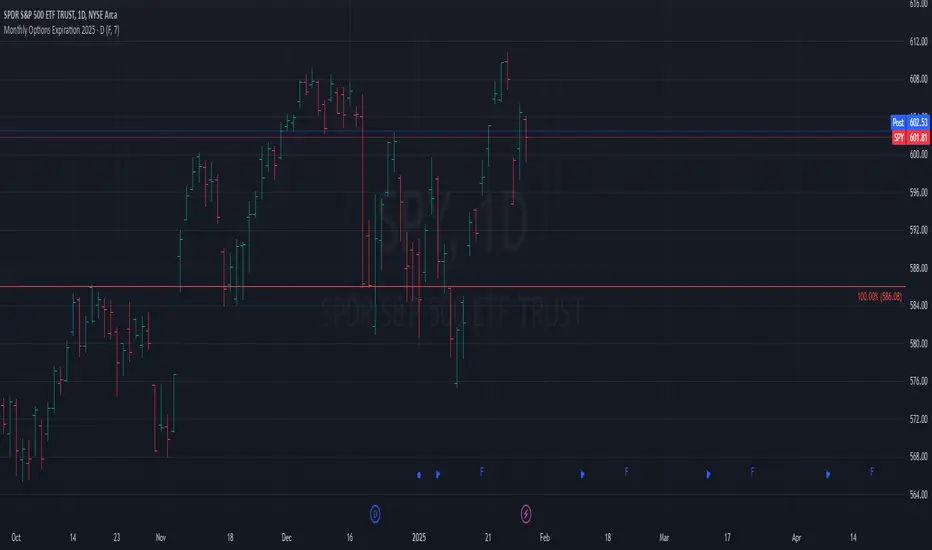
Monthly Options Expiration 2025Monthly Options Expiration 2025
Plots the monthly options expiration dates in advance for the year 2025.
Happy trading and all the best.
AllDay Session TimesIndicator: Custom Session Times
This indicator is designed to assist traders by visualizing specific trading session times on the TradingView platform. It highlights two important trading sessions: the Day Session and the Evening Session, providing a visual aid that helps traders navigate the markets with greater accuracy.
Day Session Time Range:
Starts: 10:55 UTC+2
Ends: 13:30 UTC+2
Evening Session Time Range:
Starts: 16:55 UTC+2
Ends: 18:30 UTC+2
How It Works:
Colors and Backgrounds: This indicator uses background colors to differentiate the sessions. The green background appears during the Day Session, while the blue background indicates the Evening Session.
Lines: Session time ranges are also marked with clear lines on the chart, making it easier to identify the specific session periods.
Time Zone: The time zone is set to UTC+2 (Europe/Helsinki), but it can easily be adjusted to match your local time zone.
Why Use This Indicator?
This indicator is especially useful for traders who focus on specific market sessions. For example:
The Day Session might be when the market is more active, and trends are clearer.
The Evening Session could be a good time to observe market adjustments based on the events of the day and find potential trading opportunities.
By visualizing these specific time frames, the indicator helps reduce distractions and enables a more focused approach to trading.
Use Cases:
This indicator is ideal for:
Day traders and swing traders who want to focus on certain market sessions.
Technical analysts who prefer to visualize market behavior within specific time frames.
Strategy optimization and a more precise assessment of market conditions.
Features:
Visual session markers that help traders focus on key trading periods.
Easy customization of time zone and session time ranges.
Background colors and lines that improve chart readability and session tracking.
Made By AllDayEsa

Weekly Change(Green&Red) & Percentage Change(Blue&Yellow)Display bar chart of weekly price action. Use to determine the maximum price change in one week. It would be the possible strike price for a covered call option for weekly income.

WD Gann: Vertical Lines for Predefined Days/Bars AgoThis Pine Script draws vertical lines on the chart at specific time intervals, inspired by WD Gann’s theories of time cycles . WD Gann, a famous trader, believed that market movements were influenced by predictable time cycles. This script enables traders to visualize these key time cycles on the chart by placing vertical lines at predefined intervals (in bars ago), helping to identify potential turning points in the market.
The time intervals used in this script are inspired by Gann’s work, as well as astrological and numerological principles , which many traders believe influence market behavior . You can customize which time intervals (such as 3, 7, 9, 21, etc.) you want to track by enabling or disabling specific vertical lines on the chart.
Key Features:
Time Cycles Based on Gann’s Theory: Draws vertical lines at significant time intervals such as 3, 7, 9, 21, 27 bars ago, which are commonly used by Gann traders.
Astrological & Numerological Significance: The predefined intervals also align with key numerological and astrological values, allowing for a broader perspective on market cycles.
Customizable Intervals: You can choose which time intervals to display by enabling or disabling checkboxes for each cycle, allowing flexibility in chart analysis.
Visual Labels: Each vertical line is labeled with its corresponding "bars ago" value, providing clear reference points for the selected time cycles.
What Users Can Do:
Track and analyze market movements based on time cycles that are significant to Gann’s theory, as well as numerological and astrological influences.
Enable or disable vertical lines for specific cycles, like the 3-bar cycle, 9-bar cycle, or 365-bar cycle, depending on the intervals that align with your trading strategy.
Combine with other technical analysis tools and Gann techniques (e.g., Gann Angles, Gann Fans, or Square of Nine) for a more comprehensive trading approach.
This tool is designed for traders who believe in the power of time cycles to influence market behavior, and is especially useful for predicting turning points or key price movements based on these cycles.

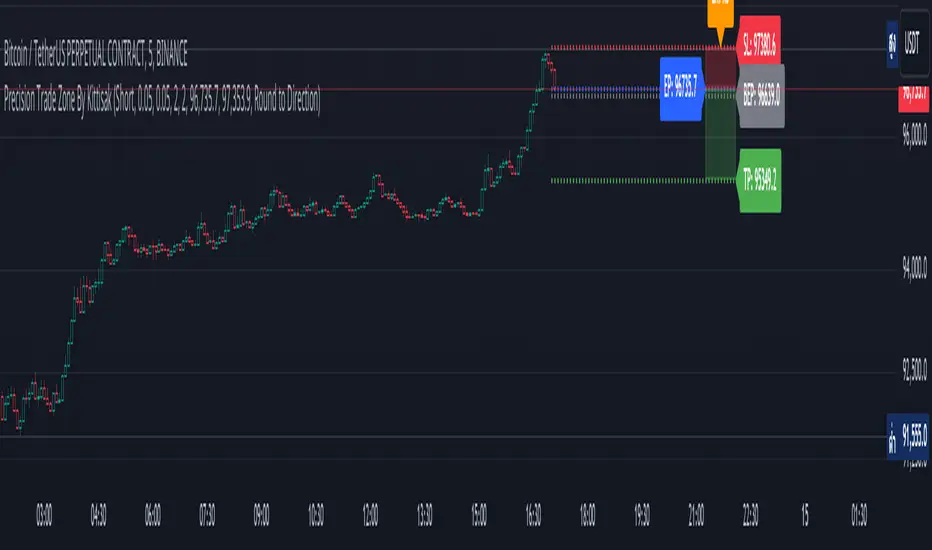
Precision Trade Zone By KittisakThis indicator is designed for Money Management calculations, helping to facilitate risk management in trading, determining suitable leverage based on acceptable risk, and adjusting the Stop Loss level to align with the calculated leverage.
Abbreviation Descriptions
LR : Suitable Leverage.
EP : Entry Price.
BEP : Break-Even Point (a point where you can move your Stop Loss to prevent losses once the price reaches a certain level).
SL : Stop Loss (a recalculated Stop Loss level to match the leverage. You should use this as the Stop Loss price instead of the initial level you set).
TP : Take Profit (a point where you take profit based on the defined risk-reward ratio).
Note
When first activating the indicator, an error may occur, and no output will be displayed. This happens because you must first specify the Entry Price and Stop Loss in the indicator settings.
How Much Leverage Should You Use?
It may seem like a simple question but is difficult to answer.
Method for Calculating Suitable Leverage
Use the formula:
Leverage = Acceptable Loss / (Distance between Entry Price and Stop Loss + (Buy Fee + Sell Fee))
Calculating the Correct Stop Loss Point
(Stop Loss levels will be slightly adjusted or extended)
For Long Positions :
New Stop Loss = Entry Price * (1 - Acceptable Loss / (Calculated Leverage * 100))
For Short Positions :
New Stop Loss = Entry Price * (1 + Acceptable Loss / (Calculated Leverage * 100))
Calculating the Correct Take Profit Point
(Take Profit levels will be slightly adjusted or extended)
For Long Positions :
Take Profit = Entry Price * (1 + (Acceptable Loss / (Calculated Leverage * 100) * RR) + ((Buy Fee + Sell Fee) / 100))
For Short Positions :
Take Profit = Entry Price * (1 - (Acceptable Loss / (Calculated Leverage * 100) * RR) + ((Buy Fee + Sell Fee) / 100))
Benefits of This Calculation
1. Accurate Risk Assessment
The calculated leverage accounts for trading fees. For example, if you aim for a 2% loss, this method ensures the actual loss is exactly 2%, not more (e.g., 2% plus fees).
2. Eliminates Guesswork
Randomly setting leverage can lead to risks because the Stop Loss level may not align with your position. This calculation ensures that the leverage aligns precisely with your desired Stop Loss level.
3. Realistic Profit Targets
For example, with a 2% acceptable loss and a 1:2 RR, you expect a 4% profit. However, without this calculation, fees may reduce your profit below 4%. This method includes fees, ensuring your profit matches the intended target.
Caution
This indicator does not account for slippage or requotes. Use it with caution and allow a buffer for slippage in your calculations.
Indicator นี้มีไว้สำหรับคำนวณ Money Management ซึ่งจะช่วยอำนวยความสะดวกในการจัดการความเสี่ยงในการเทรด การคำนวณ Leverage ที่เหมาะสมกับความเสี่ยงที่คุณยอมรับได้ และจัดการจุด Stop Loss ให้เหมาะสมกับ Leverage นั้น
คำอธิบายเกี่ยวกับคำย่อ
LR หมายถึง Leverage ที่เหมาะสม
EP หมายถึง Entry Price หรือราคาเข้าซื้อ
BEP หมายถึง Break-Even Point หรือจุดคุ้มทุน (คุณสามารถย้าย Stop Loss มาที่จุดนี้เมื่อราคาไปถึงจุดหนึ่งเพื่อป้องกันการขาดทุนได้)
SL หมายถึง Stop Loss (ซึ่งเป็น Stop Loss ที่คำนวณใหม่เพื่อให้ตำแหน่งเหมาะสมกับ Leverage ที่คำนวณได้ คุณควรใช้จุดนี้เพื่อเป็นราคา Stop Loss แทนจุด Stop Loss ที่คุณกำหนดไว้ในตอนแรก)
TP หมายถึง Take Profit (เป็นจุดที่คุณจะขายทำกำไรตาม RR ที่กำหนดไว้)
* หมายเหตุ เมื่อเริ่มเปิด Indicator จะเกิด Error ขึ้น และไม่มีผลลัพท์ใด ๆ แสดงให้เห็น นั่นเป็นเพราะคุณต้องเข้าไปกำหนด Entry Price และ Stop Loss ในการตั้งค่าของ Indicator เสียก่อน
ต้องใช้ Leverage เท่าไหร่? มันเป็นคำถามที่ดูเหมือนง่าย แต่ตอบยาก
วิธีคำนวณ Leverage ที่เหมาะสม ใช้สมการคือ
Levarage = การขาดทุนที่ยอมรับได้ / (ระยะห่างระหว่าง Entry Price และ Stop Loss + (ค่าธรรมเนียมซื้อ + ค่าธรรมเนียมขาย))
นำผลลัพท์ Leverage ที่ได้มาคำนวณเพื่อหาจุด Stop Loss ที่ถูกต้อง (จุดของ Stop Loss จะมีการยืดขยายออกไปเล็กน้อย) โดยใช้สมการ
ตำแหน่ง Stop Loss ใหม่ = Entry Price * (1 - การขาดทุนที่ยอมรับได้ / (Leverage ที่คำนวณได้ * 100)) // สำหรับ Long
ตำแหน่ง Stop Loss ใหม่ = Entry Price * (1 + การขาดทุนที่ยอมรับได้ / (Leverage ที่คำนวณได้ * 100)) // สำหรับ Short
นำผลลัพท์ Leverage ที่ได้มาคำนวณเพื่อหาจุด Take Profit ที่ถูกต้อง (จุดของ Take Profit จะมีการยืดขยายออกไปเล็กน้อย) โดยใช้สมการ
ตำแหน่ง Take Profit = Entry Price * (1 + (การขาดทุนที่ยอมรับได้ / (Leverage ที่คำนวณได้ * 100) * RR) + ((ค่าธรรมเนียมซื้อ + ค่าธรรมเนียมขาย) / 100)) // สำหรับ Long
ตำแหน่ง Take Profit = Entry Price * (1 - (การขาดทุนที่ยอมรับได้ / (Leverage ที่คำนวณได้ * 100) * RR) + ((ค่าธรรมเนียมซื้อ + ค่าธรรมเนียมขาย) / 100)) // สำหรับ Short
ข้อดีของการคำนวณคือ
1. คุณจะได้ค่า Leverage ที่เหมาะสมกับความเสี่ยงที่คุณยอมรับได้โดยรวมค่าธรรมเนียมเข้าไปในนั้นแล้ว นั่นหมายความว่า ความสูญเสียจะเป็น 2% (ตามตัวอย่าง) จริง ๆ ไม่ใช่ 2% และถูกหักค่าธรรมเนียมเพิ่มอีก กลายเป็นสูญเสียมากกว่า 2%
2. การตั้ง Leverage มั่ว ๆ กลายเป็นความเสี่ยง นั่นเพราะตำแหน่งของ Stop Loss ไม่ได้อยู่ในจุดที่ควรจะเป็น การคำนวณนี้ช่วยให้คุณได้ Leverage ในตำแหน่ง Stop Loss ที่คุณต้องการโดยแท้จริง
3. ผลกำไรที่ได้รับตรงกับความต้องการจริง ๆ เช่น การขาดทุนที่ยอมรับได้ 2% และ RR 1:2 สิ่งที่คุณคิดคือกำไร 4% แต่จริง ๆ แล้วไม่ถึง 4% นั่นเพราะว่าโดนหักค่าธรรมเนียมไปส่วนหนึ่ง การคำนวณนี้ได้รวมค่าธรรมเนียมให้แล้ว คุณจึงได้กำไรที่ 4% อย่างถูกต้องตามต้องการ
ข้อควรระวัง
Indicator นี้ไม่ได้มีการควบคุมความเสี่ยงในเรื่องของ slippage หรือ requote โปรดใช้งานอย่างระมัดระวังและมีการเผื่อระยะสำหรับ slippage ด้วย
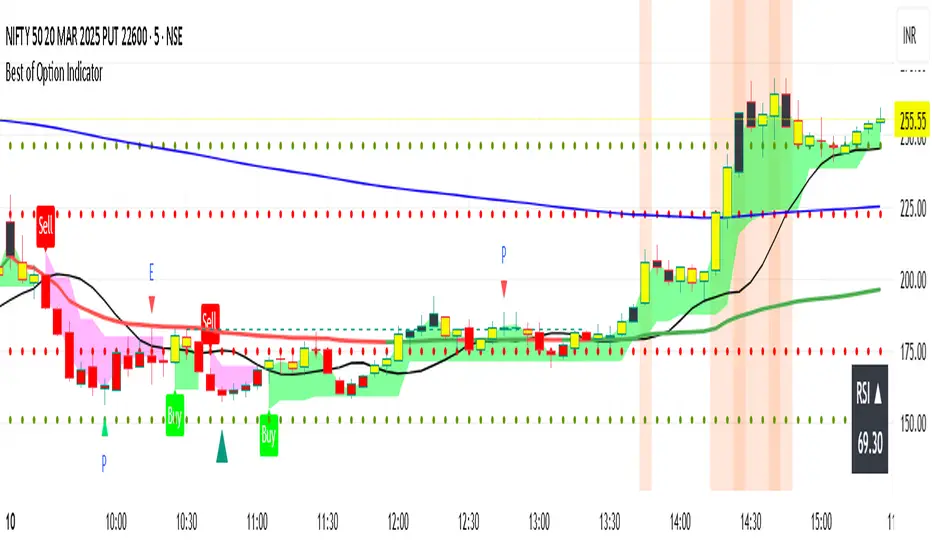
Best of Option Indicator - Manoj WadekarPlot this indicator for both CALL and PUT options and buy only when color of candle is YELLOW and above BLACK line.
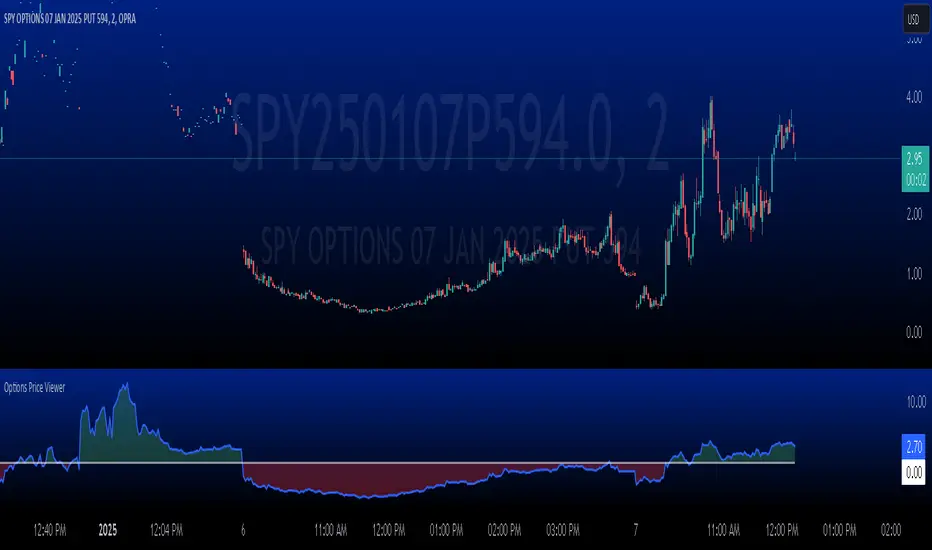
Rich's DikFat Money-Counter - ITM/OTM Options Price ViewerScript Overview
This Pine Script is a custom indicator designed for use on the TradingView platform. It analyzes options contracts, extracting key information from the options symbol, and then visualizes the relationship between the current price of the underlying asset and the option's strike price. Here’s a detailed explanation of the script and its components:
Key Features
Symbol Format Validation: The script checks whether the current symbol matches the expected format of an options symbol (like TSLA250131C400.0).
Extraction of Option Components: It extracts the base symbol (e.g., TSLA), expiration date (e.g., 250131), option type (C for call, P for put), and strike price (e.g., 400.0) from the options symbol.
Price Difference Calculation: It calculates the difference between the current price of the base asset (e.g., TSLA) and the option's strike price. Depending on whether the option is a call or put, the calculation is adjusted.
Visualization: The result is plotted on the chart, with color-coded filling to indicate whether the price difference is positive (ITM) or negative (OTM).
Detailed Explanation of Code Components
1. Indicator Definition
indicator("Rich's DikFat Money-Counter - In the Money/Out of the Money Options Price Viewer", shorttitle="Options Price Viewer", overlay=true)
This line defines the indicator's name, short title, and specifies that it should be plotted on the price chart (with overlay=true).
2. Symbol Detection
currentSymbol = syminfo.ticker
This retrieves the symbol of the current asset being analyzed. The script expects this symbol to be an options contract, for example, TSLA250131C400.0.
3. Symbol Format Validation
isOptionSymbol = str.length(currentSymbol) >= 9 and str.match(currentSymbol, "^ + {6} +(\. +)?$") != ""
This checks whether the current symbol matches the expected format for an option:
The symbol must have at least 9 characters.
It must follow a specific pattern: a base symbol (letters), a 6-digit expiration date, an option type (C for Call or P for Put), and a strike price that could include decimals.
[/list>
4. Extracting Option Components
If the symbol is a valid option symbol, the following code extracts the components:
baseSymbol := str.match(currentSymbol, "^ +")
expirationDate := str.substring(currentSymbol, str.length(baseSymbol), str.length(baseSymbol) + 6)
optionType := str.substring(currentSymbol, str.length(baseSymbol) + 6, str.length(baseSymbol) + 7)
strikePrice := str.substring(currentSymbol, str.length(baseSymbol) + 7, str.length(currentSymbol))
baseSymbol: Extracts the letters representing the stock symbol (e.g., TSLA).
expirationDate: Extracts the expiration date in the form of a 6-digit number (e.g., 250131).
optionType: Extracts the option type (C for Call, P for Put).
strikePrice: Extracts the strike price, which is the value after the option type (e.g., 400.0).
[/list>
5. Fetching the Base Symbol Price
baseSymbolClose = request.security(baseSymbol, "1", close)
This line uses the request.security() function to get the most recent close price of the base symbol (e.g., TSLA) on a 1-minute chart.
6. Converting the Strike Price to a Float
strikePriceFloat = na(strikePrice) ? na : str.tonumber(strikePrice)
Converts the strike price string to a numerical value (float). If the strike price is not available (i.e., na), it will not proceed with calculations.
7. Price Difference Calculation
priceDifference = baseSymbolClose - strikePriceFloat
This calculates the difference between the base symbol's close price and the strike price. For a Call option, this represents how much the stock price is above or below the strike price.
8. Adjusting for Put Options
if optionType == "P"
priceDifference := strikePriceFloat - baseSymbolClose
If the option is a Put, the price difference is reversed because a Put option becomes valuable when the stock price is below the strike price.
9. Plotting the Price Difference
priceDiffPlot = plot(priceDifference, title="Price Difference (Strike - Base)", color=color.blue, linewidth=2, style=plot.style_line, offset=0)
This line plots the calculated price difference as a blue line.
10. Zero Line Plot
zeroLinePlot = plot(0, "Zero Midline", color=color.white, linewidth=1, style=plot.style_line, offset=0)
This plots a white line at the zero level. This helps visually separate when the price difference is positive or negative.
11. Filling the Area Between the Price Difference and Zero Line
fill(priceDiffPlot, zeroLinePlot, color=color.new(priceDifference > 0 ? color.green : color.red, 70))
This fills the area between the price difference plot and the zero line:
Green if the price difference is positive (indicating the option is In the Money for Calls or Out of the Money for Puts).
Red if the price difference is negative (indicating the option is Out of the Money for Calls or In the Money for Puts).
Final Thoughts
This script is useful for traders and options investors who want to track the status of an option relative to the current price of the underlying asset. The green and red fill colors provide an immediate visual cue for whether the option is ITM or OTM. By applying this indicator on TradingView, users can easily see whether a particular option is valuable (ITM) or worthless (OTM) based on the current market price of the underlying asset. This makes it a valuable tool for quick decision-making in options trading.
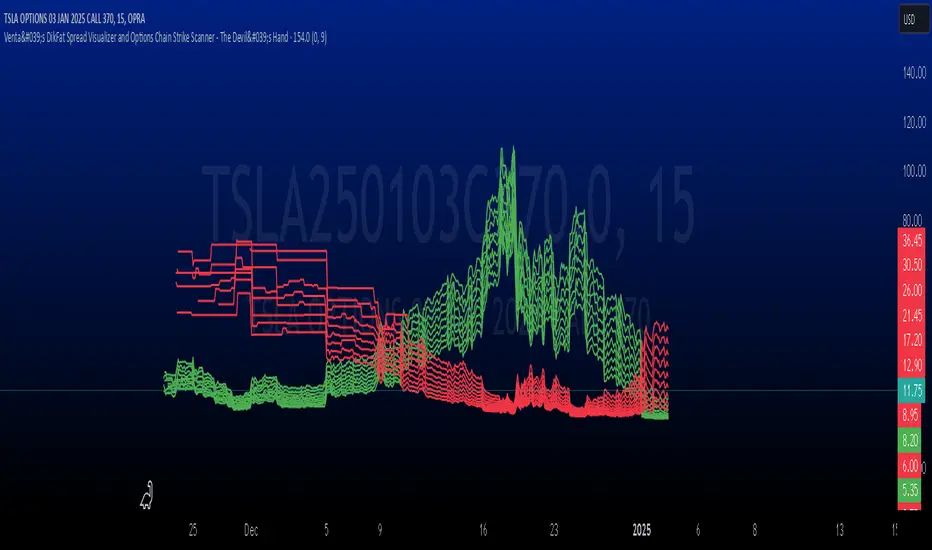
Venta's DikFat Spread Visualizer & Dynamic Options Chain
**Venta's DikFat Spread Visualizer and Options Chain Strike Scanner** is a powerful trading tool designed to give users an immediate view of the nearest options strikes relative to the current price of the underlying asset. This script dynamically displays a selected number of call and put options strikes from the **options chain**, visualizing them directly on the chart for better decision-making.
By default, the script shows options strikes for the current chart’s price, but users have the flexibility to extend the view to include strikes on the opposite side of the market. The available options allow you to show either 3, 6, or 9 strikes on either side of the current price level.
This tool is essential for options traders who want to track strike prices in relation to the underlying asset's price movements. It provides key visual clues such as strike price distributions, volatility, and potential areas of market basing—all in a customizable and user-friendly interface.
---
█ CONCEPTS
This script pulls real-time **options strikes** directly from the **options chain**, providing traders with the ability to see call and put strikes as dynamic price markers on their chart. The concept revolves around understanding the proximity and distribution of strikes based on the current price and market conditions.
Key Features
**Dynamic Options Strike Display**: The script automatically identifies and displays the options strikes closest to the current market price of the underlying asset.
**Customizable Strike Range**: Choose between 3, 6, or 9 strikes on either side of the current price, giving flexibility in visualizing different strike ranges.
**Current Chart Focused by Default**: When added to the chart, the script focuses on the strikes closest to the current price. However, users can opt to include strikes on the opposite side of the market for a broader view.
**Instant Market Context**: The displayed
strikes offer a snapshot of the options market and how the current price relates to potential option expiration levels, helping traders understand key zones.
**Visual Clues on Spreads & Volatility**: This script not only displays the strikes but also provides instant visual clues that reflect the volatility and spread of the options market.
---
█ HOW IT WORKS
The script operates by accessing the **options chain** for the underlying asset, identifying the nearest call and put strikes, and plotting them as visual markers on the chart. This real-time strike data is dynamic, adjusting automatically as the market price moves.
Strike Calculation
The script uses the current price of the underlying asset as a base point and calculates the nearby **options strikes** from the **options chain**.
Depending on the user's settings, the script will plot up to 9 strikes on either side of the price level.
This calculation is performed using live market data, making sure the plotted strikes always reflect the most current market conditions.
Visual Clues
**Spreads**: The space between the plotted call and put options strikes provides immediate insights into the current bid/ask spreads. If the spread between strike prices is wide, it suggests increased volatility or a higher level of uncertainty in the market. Conversely, narrow spreads often indicate market stability or a lack of price movement.
**Market Basing**: When options strikes form a concentrated group near a certain price level, it can indicate that the market is building up or basing at a key level. This might signal the potential for a breakout or a reversal.
**Volatility Insights**: Wider gaps between strikes, particularly on the call side versus the put side (or vice versa), can indicate an imbalance in options trading activity, often a reflection of higher volatility expectations. This visual clue can help traders assess when the market is pricing in significant movements.
Customization and User Settings
**Number of Strikes**: The number of options strikes shown is fully customizable, allowing users to display 3, 6, or 9 strikes on either side.
**Show Opposite Strikes**: By default, the script shows strikes on the current side of the market, but users can enable the option to show strikes on the opposite side to gain a more complete view of the market's options landscape.
**Strike Colors & Width**: Customize the visual appearance of the plotted strikes by adjusting the color and line width for better clarity and chart aesthetics.
---
█ POTENTIAL USE CASES
This indicator is especially valuable for **options traders**, **market analysts**, and anyone interested in gaining insights into the underlying options market. Here are some of the key use cases:
**Options Traders**: Quickly identify the nearest strike prices and understand the risk/reward potential for options positions. The ability to customize the number of strikes shown allows traders to focus on the most relevant price levels.
**Volatility Monitoring**: Use the visual clues from the spread between strike prices to assess the level of volatility in the options market. A wider spread suggests that options traders are expecting more significant price moves, while a narrow spread indicates less expected movement.
**Support and Resistance Identification**: The clustering of strike prices on one side of the market can indicate a potential support or resistance level. By monitoring these levels, traders can get a sense of where the market may reverse or consolidate.
**Market Sentiment Analysis**: A large concentration of call strikes above the current price level, or put strikes below, can be an indication of market sentiment, such as whether traders are generally bullish or bearish.
**Risk Management**: By tracking nearby options strikes, traders can adjust their strategies to minimize risk, especially when market price levels approach significant strike points.
---
█ FEATURES
**Real-Time Data**: The script pulls data from the **options chain**, ensuring that the plotted strikes are always up-to-date with the current market price.
**User-Friendly Interface**: Clear and customizable inputs allow users to easily adjust the number of strikes displayed and control visual settings such as colors and line widths.
**Visual Strike Indicators**: Instantly spot volatility, market basing, and spread imbalances through visual clues from the plotted strikes, enhancing your market analysis.
---
█ LIMITATIONS
**Accuracy Depends on Market Data**: This indicator relies on the available **options chain** data. While the data is updated in real-time, its accuracy may depend on the liquidity and availability of options contracts in the market.
**Not Suitable for Non-Options Traders**: If you don’t trade options, the relevance of this indicator may be limited as it is designed specifically to provide insight into the options market.
**Data Delays**: In fast-moving markets, there may be a slight delay in the updating of strike prices, depending on the data feed.
---
█ HOW TO USE
**Load the Script**: Add the **Venta's DikFat Spread Visualizer and Options Chain Strike Scanner** script to your TradingView chart.
**Adjust Settings**: Use the input options to select the number of strikes you want to display (3, 6, or 9). You can also choose whether to display only the current chart’s strikes or include strikes from the opposite side.
**Interpret the Strikes**: Look at the plotted strikes to gain insights into where the market is currently pricing options and where major strike prices are located. Pay attention to the spreads, concentrations, and volatility signals.
**Monitor the Market**: As the market moves, watch how the strikes shift and cluster, providing you with real-time information about market sentiment and potential volatility.
---
█ THANKS
We would like to extend our gratitude to the PineCoders community for their ongoing support and contributions to the TradingView Pine Script ecosystem. Special thanks to The Options Team.
Previous Day High and Low by DRK TradingThe Previous Day High and Low Indicator is a simple yet powerful tool designed for traders who want to keep track of critical levels from the previous trading session. This indicator automatically marks the high and low of the previous day on your chart with dashed horizontal lines, making it easier to identify key support and resistance zones.
Features:
Horizontal Lines: Clearly marks the previous day's high and low levels.
Dynamic Updates: Automatically updates at the start of a new trading day.
Visual Clarity: Includes labels at the start of the day for quick reference.
Customizable: Works seamlessly across all timeframes and instruments.
Use Case:
Identify potential breakout and reversal zones.
Enhance intraday and swing trading strategies by focusing on key price levels.
Plan stop-loss and target levels based on historical price movements.
This indicator is perfect for price action traders, intraday scalpers, and swing traders who rely on past price behavior to make informed decisions.

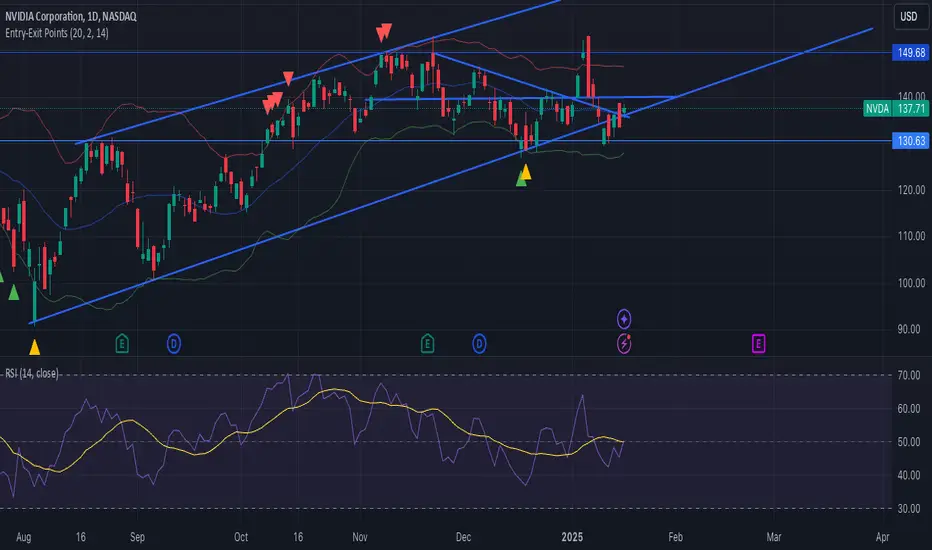
Entry-Exit pointThis indicator combines Bollinger Bands and RSI (Relative Strength Index) to generate entry and exit signals based on price movements and trend conditions.
### Key Features:
- **Bollinger Bands**: The indicator uses Bollinger Bands to assess volatility, with the upper and lower bands plotted around a simple moving average (SMA) of the price. The bands expand and contract based on the standard deviation, providing insights into potential overbought or oversold conditions.
- **RSI**: The RSI is used to determine if the price is overbought or oversold. In this case, it highlights conditions when the RSI is below 40 (oversold) for bullish signals and above 65 (overbought) for bearish signals.
- **Trend Analysis**: The indicator analyzes the previous high and low values to determine the market trend. It identifies uptrend and downtrend conditions based on recent price action.
- **Entry Signals**:
- **Bullish Entry (Green Arrows)**: A signal is generated when the price touches or dips below the lower Bollinger Band, the RSI is under 40, and the current candle shows a downtrend (lower high and low).
- **Bearish Entry (Red Arrows)**: A signal is triggered when the price touches or rises above the upper Bollinger Band, the RSI is above 65, and the current candle shows an uptrend (higher high and low).
### Visuals:
- **Green Up Arrows**: Indicate a potential bullish entry point, plotted below the bar.
- **Red Down Arrows**: Indicate a potential bearish entry point, plotted above the bar.
- **Bollinger Bands**: The upper and lower bands are shown in red and green, with the basis (SMA) in blue.
This indicator provides a clear, rule-based system for detecting potential price reversals based on both volatility (Bollinger Bands) and momentum (RSI), making it useful for traders looking to enter positions during strong trend reversals.
by Frank R.
Abraço primo Lucas Rodrigues