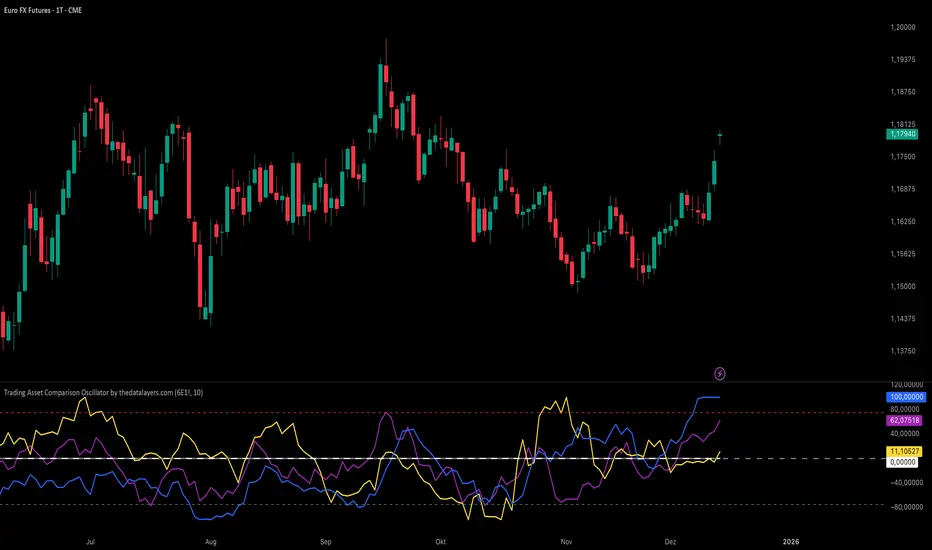
Trading Asset Comparison Oscillator by thedatalayers.comThe Trading Asset Comparison Oscillator compares the currently opened asset with a user-selected reference symbol to identify periods of relative overvaluation and undervaluation.
The concept is based on the idea that markets constantly seek fair value. When an asset becomes mispriced relative to a meaningful benchmark, it often moves back toward equilibrium.
This indicator measures that relationship and transforms it into an easy-to-read oscillator:
• Green Zone (Undervalued) - The selected asset is undervalued compared to the reference symbol.
This reflects potential upward pressure as markets tend to correct undervaluation over time.
• Red Zone (Overvalued) - The asset is overvalued relative to the reference symbol.
This may indicate a higher likelihood of downward movement as price seeks rebalancing.
Users can set any reference instrument they consider relevant-commodities, indices, currency pairs, or other assets. The oscillator quantifies the valuation difference based on a configurable cycle length.
The recommended setting is Cycle = 10, which provides a balanced and responsive signal
structure.
Since this indicator relies on broader valuation dynamics, it is designed to be used exclusively on the daily timeframe. Lower timeframes may not reflect true fundamental value relationships.
The Asset Comparison Oscillator helps traders identify when an asset appears cheap or expensive relative to another, offering an additional layer of fundamental context to support directional trading decisions.
Pengayun
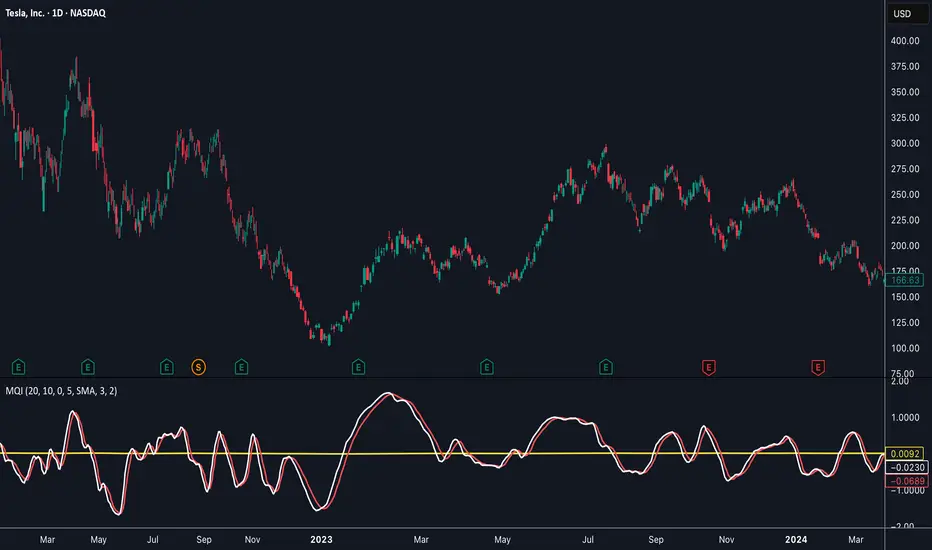
Momentum Quality Index (MQI)
Welcome to the Momentum Quality Index! This indicator aims to provide insight into short term trends by measuring the efficiency of price movement relative to the momentum of the trend. This indicator is designed to work better on short term time frames, capturing the micro-level of trends for practices such as day-trading, options trading, and shorter term swing trading.
How to read:
The main way of reading this indicator is through moving average crossovers. Upwards crossovers indicates uptrends whereas downwards crossovers indicates downtrends.
Customization:
This indicator includes a few adjustable options for fine tuning, such as optimized smoothing options and moving average length for efficiency in spotting reversals.
Breadth-Force Oscillator (BFO)Welcome to the Breadth-Force Oscillator! This is a measure of the cumulative volume index relative to price action, and is used for swing trading.
How to read:
This indicator is read primarily through divergences in price, when the BFO is going down that is indicative of an uptrend and when it is going up that is indicative of a downtrend. Changes in the BFO direction give foresight towards shifts in trends.
Features:
This indicator is highly adjustable, and depending on how you adjust it, it may change the results of how you interpret it. This indicator includes multiple smoothing options to reduce noise on smaller time frames and gain more foresight to macro-trends in a given market, and other adjustable features which can be used to further customize.

Trading Value RSI (NQ Tuned)The Trading Value RSI (NQ Tuned) is an indicator that applies the RSI calculation to trading value, defined as volume × close, rather than just price. It is specifically tuned for Nasdaq 100 futures (NQ), with a default RSI length of 24, overbought level at 75, and oversold level at 25 to filter out false signals from high volatility. The indicator visually colors the RSI line based on overbought (red), oversold (green), or neutral (blue) conditions. A horizontal midline at 50 helps identify potential trend direction changes or confirm ongoing momentum. This tool allows traders to monitor capital flow intensity, giving insight into when strong buying or selling pressure may drive short-term market moves.

Black Arrow Wave Trend
Summary:
Goal was to add FIB Levels to the "WaveTrend with Crosses ". This tool is trying to identify if FIB levels in the "WaveTrend" oscillator has any relation to price action in candles.
Details:
1) Made FIB levels adjustable in the input sections under settings. Adjust to your needs.
2) Blue ribbon represents bullish waves and red ribbons represents bearish waves.
3) Purple line is at .5 "Fair Value", Two Gold lines represent "Golden Pocket", Red line represents the .786
How to use:
1) Observe either bullish or bearish waves enter FIB levels that are color coded.
2) Observe as momentum slows if following waves mark lower FIB levels.
3) Zero line is at the bottom color = grey.
4) As momentum ribbons momentum slows, this may indicate a reversal in momentum.
Probability levels:
1) Lowest: Purple line is "Fair Value" at 50% pullback. Reversal in momentum chance is weak.
2) Medium: Gold Double lines are the "Golden Pocket". Reversal in momentum chance is medium.
3) Highest: Red Line as a higher Probability for a Reversal in momentum.
Please let me know if there are any changes or items I should add.
This would be best used if combined with a support and resistance indicator.

ALFA BUY IndikatorThis indicator is an improved version of the Mucip + Yağız indicator. I have been using it smoothly for the past 3 months.
I use it on futures markets for the three major coins such as BNB/USDT, BTC/USDT, and ETH/USDT.
My usage logic is as follows: on average, it generates around 2 signals per coin per day.
For each trade, I enter positions using 4–5% of my total capital.
I use 25x leverage on ETH and BNB, and 50x leverage on BTC.
My take-profit levels are 0.25% for BTC and 0.5% for the others, which results in approximately 10–12% profit per trade.
Overall, the average daily capital growth is around 2–3%.
Note: I use a trading bot for executions, because the indicator is designed for 2-minute charts, and it is almost impossible to catch the signals manually.
So far, everything has been working flawlessly, and it performs best on 2-minute timeframes.

RMO [modded LazyBear] OscillatorBoth Yellow lines mean short or PUT option.. Both BLUE lines mean LONG or Call options. Using this to watch structure, and trend bias. this is only good for entry, and Not stop Loss. Don't be on the wrong side of trend

IED [Harmonic Volatility Edition]IED-H
IED-H (Harmonic Volatility Edition) is a professional mean-reversion and exhaustion detection engine designed to identify institutional stress zones, volatility extremes, and harmonic reversals using a geometry-based statistical framework.
This indicator does not chase trends or breakouts.
Instead, it focuses on detecting when price deviates excessively from its equilibrium and begins to lose efficiency.
⸻
🔬 Core Concept
IED-H measures price deviation from a dynamic trend baseline and projects it into harmonic volatility bands derived from natural square-root ratios:
• √2 → Pulse (normal deviation)
• √3 → Stretch (institutional stress)
• √5 → Extreme (critical exhaustion)
These levels adapt dynamically to market volatility and are not fixed thresholds.
⸻
⚙️ Key Features
• Harmonic Volatility Geometry
Dynamic √2 / √3 / √5 bands scaled by statistical volatility.
• Responsive Wave Engine
Smoothed deviation wave (HMA / RMA modes) for early exhaustion detection.
• Equilibrium Noise Filter
Automatically ignores weak, low-energy oscillations around balance.
• Persistence Logic
Requires prior presence inside overbought/oversold zones to avoid false signals.
• Candle Validation
Signals are confirmed using wick structure and true volatility (ATR-based).
• Harmonic Score (Debug Mode)
Quantifies how deeply price penetrates harmonic stress levels.
• Institutional Visualization
Optional on-chart boxes highlighting validated harmonic reaction zones.
⸻
🎯 What This Indicator Is Designed For
✔ Mean-reversion trades
✔ Exhaustion & volatility climax detection
✔ Trap zones and institutional reaction areas
✔ Advanced traders who value signal quality over signal quantity
⸻
🚫 What This Indicator Is NOT
✘ Not a trend-following system
✘ Not a breakout indicator
✘ Not designed for momentum chasing
✘ Not a multi-purpose “all-in-one” tool
IED-H is a precision instrument, not a Swiss-army knife.
⸻
🧠 Best Practice
For optimal results, use IED-H within a broader trading framework, preferably alongside:
• Higher-timeframe trend context
• Market structure or session logic
• Risk-controlled execution rules
⸻
⚠️ Disclaimer
This indicator is for educational and analytical purposes only.
It does not constitute financial advice.
Always manage risk and test thoroughly before live trading.

SMA34 + Trend Strength Index Band + RSI50 (STRICT CLEAN)Provide Buy and sell signal basis TSI & RSI.
when TSI crosses 0 buy and sell.

Liquidity Sentiment Profile | LUPENIndicator Guide: Liquidity Sentiment Profile (LSP).
What is the LSP?
The Liquidity Sentiment Profile (LSP) is a "Next-Generation" oscillator designed to look beyond simple price action. While standard indicators (like RSI or MACD) primarily focus on where a candle closes, the LSP analyzes the micro-structure of the entire candle—specifically the relationship between the candle's Body, its Wicks (Shadows), and the Volume.
The Core Philosophy:
Wicks tell the truth: A long lower wick indicates that sellers pushed the price down, but buyers aggressively absorbed that liquidity and pushed it back up.
That is hidden bullish strength.
Volume validates intent: A price move with low volume is noise. A price move (or wick rejection) with high volume is a commitment by institutional players.
The LSP calculates a "Sentiment Score" between -100 and +100 based on these factors.
How to Read the Visuals
The Colors (Intensity)
color: Light Green - Bullish Acceleration. Buyers are in control, and momentum is increasing. This is the ideal time to be in a Long trade.
color: Dark Green - Bullish Deceleration. Buyers are still in control (price is likely rising), but the momentum is fading. This is a warning sign to tighten stop-losses or take profits.
color: Light Red - Bearish Acceleration. Sellers are dominating, and panic is increasing. This is the ideal time to be Short.
color: Dark Red - Bearish Deceleration. Sellers are still in control, but the downward pressure is exhausted. Be careful with new short positions.
The Lines & Fills
The Main Line: The actual LSP sentiment value.
The Yellow Signal Line: A smoothed average of the sentiment.
The Core Fill: The colored area between the Main Line and the Signal Line. When this area "glows", the trend is strong. When it dims (Dark), the trend is weak. Bearish Deceleration. Sellers are still in control, but the downward pressure is exhausted. Be careful with new short positions.
The Lines & Fills
The Main Line: The actual LSP sentiment value.
The Yellow Signal Line: A smoothed average of the sentiment.
The Core Fill: The colored area between the Main Line and the Signal Line. When this area "glows" (Neon), the trend is strong. When it dims (Dark), the trend is weak.
How to Use It (Trading Strategies)
Strategy A: The "Power Cross" (Trend Entry)
Use this for entering trends when the market wakes up.
Long Entry: Wait for the LSP line to cross ABOVE the Yellow Signal Line.
Confirmation: The fill color must turn Neon Green.
Short Entry: Wait for the LSP line to cross BELOW the Yellow Signal Line.
Confirmation: The fill color must turn Neon Red.
Strategy B: The "Absorption" Play (Reversals)
This is where the LSP shines. It detects when liquidity is being absorbed before price turns.
Bullish Absorption: The Price makes a Lower Low, but the LSP makes a Higher Low. This happens because the LSP detects the Volume on the Lower Wicks (buyers absorbing selling pressure). This is a high-probability reversal signal.
Bearish Absorption: The Price makes a Higher High, but the LSP makes a Lower High. The volume on the Upper Wicks suggests sellers are absorbing the buy orders.
Strategy C: The "Dimming" Exit (Risk Management)
Don't wait for the price to crash to exit a trade.
If you are in a Long trade (Neon Green) and the color instantly shifts to Dark Green, it means the "fuel" is running out. Consider taking partial profits or moving your Stop Loss to break even.
Standard oscillators (like RSI) often give false signals during strong trends (showing "Overbought" while price keeps going up). The LSP avoids this because it weights Volume and Wicks. If price goes up and volume increases, the LSP stays Neon Green, telling you the move is genuine, not just overextended.

OC Chain_ROC_RSI15-minute indicator that detects a 3-candle “inside” chain where each candle’s open & close remain within the previous candle’s open-close range. Plots horizontal Open/Close levels on candles when ROC(2) moves beyond a configurable ±threshold, and highlights candles when RSI is strong (>55) or weak (< user set level, e.g., 30–32). Adjustable ROC/RSI settings and line extension options.

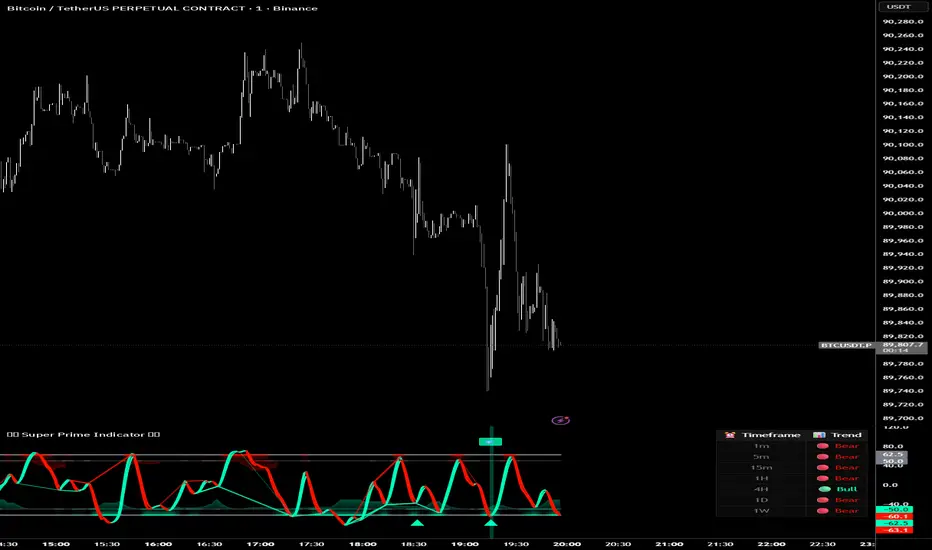
Super Prime Indicator [TraderCloud]⭐🧠 Super Prime Indicator 🧠⭐
ML-Enhanced SMI + Whale Hunter Pro
Super Prime Indicator is an advanced, all-in-one market intelligence tool that combines machine-learning-enhanced SMI, Whale Hunter Pro logic, multi-timeframe trend analysis, and probabilistic market modeling into a single, highly visual oscillator.
Designed for professional crypto traders, this indicator focuses on identifying institutional activity, high-probability reversals, and trend continuation zones with precision.
🔹 Core Components
🧠 Machine Learning SMI (KNN-Enhanced)
Traditional SMI upgraded with K-Nearest Neighbors (KNN) learning
Adaptive overbought / oversold levels based on historical behavior
Feature-based distance analysis (momentum, volatility, slope, etc.)
Optional Kalman, Double EMA, or ALMA filtering
🐋 Whale Hunter Pro System
RSI divergence detection across multiple pivot scales
KDE (Kernel Density Estimation) probability modeling
Institutional bias detection using Open Interest (OI) and CVD filters
Strict / Moderate / Aggressive signal modes
Whale buy/sell zones with visual background highlights
📊 Multi-Timeframe Trend Dashboard
Real-time trend alignment across
1m / 5m / 15m / 1H / 4H / 1D / 1W
Clear bullish / bearish status table for top-down analysis
📈 Advanced Divergence Engine
Regular & hidden divergence detection
Short, medium, and long-term pivot sets
Dynamic divergence line plotting with strength-based visuals
📐 Bayesian Probability Model
Probabilistic market direction estimation
Uses Bollinger Bands & SMA state sequences
Normalized directional probability output for risk assessment
🎯 Trading Use Cases
Identify smart money accumulation & distribution
Spot high-probability reversals before price confirmation
Confirm trend continuation with multi-TF alignment
Filter false signals using OI & CVD confirmation
Combine momentum, structure, and probability in one view
🎨 Visual & UX Features
Neon / color-blind friendly palettes
Gradient-based momentum zones
Clean oscillator design with minimal chart clutter
Whale emoji signals for instant recognition
Programmers Toolbox of ta LibraryA programmer's "Swiss army knife" for selecting functions from the " ta Library by Trading View " during coding. Illustrates the results of the individual library functions. Adds a few extra features. Extensively and uniquely documented.

RTSLThis script is designed to help traders trail stop-losses in a structured and disciplined manner. It adapts to price movement to protect open profits while allowing trades enough room to develop. By reducing emotional decision-making and manual intervention, the script improves trade management, enforces risk discipline, and helps traders stay aligned with their original trade logic across different market conditions.

VEGA (Velocity of Efficient Gain Adaptation)VEGA (Velocity of Efficient Gain Adaptation)
VEGA is a momentum oscillator that measures the velocity of an efficiency-weighted adaptive moving average. Unlike traditional momentum indicators that react uniformly to all price movements, VEGA intelligently adapts its sensitivity based on market conditions—responding quickly during trending periods and filtering noise during consolidation.
--------------------------------
What Makes VEGA Different
Efficiency-Driven Adaptation
At its core, VEGA uses the Efficiency Ratio (ER) to distinguish between trending and choppy markets. When price moves efficiently in one direction, VEGA's underlying adaptive MA speeds up to capture the move. When price chops sideways, it slows down to avoid whipsaws. This creates a momentum reading that's inherently cleaner than fixed-period alternatives.
Linear Regression Smoothed Source
VEGA offers an optional LinReg-smoothed price source that blends regular candles with linear regression values. This pre-smoothing reduces noise before it ever enters the calculation, resulting in a histogram that's easier to read without sacrificing responsiveness. The mix ratio lets you dial in exactly how much smoothing you want.
Z-Score Normalization with Dead Zone
Rather than arbitrary oscillator bounds, VEGA normalizes output as standard deviations from the mean. This gives statistically meaningful levels: readings above +2σ or below -2σ represent genuinely extreme momentum. The configurable dead zone (with Snap, Soft Fade, or None modes) filters out insignificant movements near zero, keeping you focused on signals that matter.
--------------------------------
How It Works
1. Source Preparation — Price is smoothed via a LinReg/regular candle blend
2. Efficiency Ratio — Measures directional movement vs total movement over the lookback period
3. Adaptive MA — Applies variable smoothing based on efficiency (fast during trends, slow during chop)
4. Velocity — Calculates the rate of change of the adaptive MA
5. Normalization — Converts to Z-Score (standard deviations) or ATR-normalized percentage
6. Dead Zone — Optionally filters near-zero values to reduce noise
--------------------------------
How To Read VEGA
Signal and Interpretation
Histogram above zero | Bullish momentum
Histogram below zero | Bearish momentum
Bright color | Momentum accelerating
Faded color | Momentum decelerating
Beyond ±1σ bands | Above-average momentum
Beyond ±2σ bands | Extreme momentum (potential reversal zone)
Zero line cross*| Momentum shift
--------------------------------
Key Settings
ER Length — Lookback for efficiency ratio calculation. Higher = smoother, slower adaptation.
Fast/Slow Smoothing — Controls the adaptive MA's responsiveness range. The MA blends between these based on efficiency.
LinReg Settings — Enable smoothed candles and adjust the blend ratio (0 = regular candles, 1 = full LinReg, 0.5 = 50/50 mix).
Z-Score Lookback — Period for calculating mean and standard deviation. Shorter = more reactive normalization.
Dead Zone Type — How to handle near-zero values:
Snap — Hard cutoff to zero
Soft Fade — Gradual reduction toward zero
None — No filtering
Dead Zone Threshold — Values within this Z-Score range are affected by the dead zone setting.
VEGA works on any timeframe and any market. For best results, adjust the ER Length and LinReg settings to match your trading style and the volatility characteristics of your instrument.

RSI Info WindowRSI Info Window is a minimalist overlay utility that displays the current RSI value and a simple market state label (Overbought, Oversold, or Neutral) directly on the chart. The goal is to provide quick RSI context without using a separate oscillator pane, helping keep the chart clean for price-action, SMC, and structure-based trading.
How it works
Calculates RSI using the selected RSI Length (default 14).
Compares RSI to the Overbought and Oversold thresholds (default 70/30).
Displays a small label on the most recent candle showing:
RSI value
Current state: Overbought / Oversold / Neutral
The label updates in real time as the latest candle forms.
Inputs
RSI Length – Controls RSI sensitivity (default 14)
Overbought Level – RSI threshold for overbought (default 70)
Oversold Level – RSI threshold for oversold (default 30)
How to use
Overbought: RSI above the overbought level — may indicate momentum is extended; watch for continuation vs exhaustion based on your system.
Oversold: RSI below the oversold level — may indicate downside extension; watch for reversal conditions and structure confirmation.
Neutral: RSI between thresholds — often indicates balanced conditions or consolidation.
This indicator is designed as a compact reference tool, not a complete trading system.
Notes
The overlay label is anchored to the most recent candle and refreshes on the last bar.
Intended to save screen space vs. a full RSI subpanel.
Disclaimer
This script is for educational and informational purposes only and does not constitute financial advice. Always use risk management and confirm signals with your broader trading plan.
Beast Mode PRO v4.0# Beast Mode PRO v4.0 - Advanced Multi-Regime Trading System
## Overview
Beast Mode PRO v4.0 is a sophisticated technical analysis indicator designed for active traders seeking high-probability setups across multiple timeframes. This system combines machine learning-inspired clustering algorithms with traditional technical analysis to identify market regimes and generate precision entry signals. The indicator adapts to different trading styles through intelligent preset configurations and multiple trading modes.
---
## Core Methodology
### Signal Generation Framework
The indicator employs a **multi-component voting system** that analyzes market conditions through several independent technical perspectives:
**Technical Components:**
- **RSI (Relative Strength Index)**: Momentum oscillator measuring overbought/oversold conditions
- **Fisher Transform**: Price transformation technique that normalizes price distributions for clearer turning points
- **DMI (Directional Movement Index)**: Trend strength indicator measuring directional pressure
- **Z-Score Analysis**: Statistical measure identifying price deviations from historical norms
- **Moving Average Ratio**: Price relationship to its moving average baseline
- **MFI (Money Flow Index)**: Volume-weighted momentum indicator
- **Stochastic Oscillator**: Momentum indicator comparing closing price to price range
- **CCI (Commodity Channel Index)**: Measures current price level relative to average price level
### Clustering Engine
The system utilizes a **k-means inspired clustering algorithm** that categorizes each technical indicator's normalized values into distinct market regimes (bullish, bearish, neutral). This approach:
1. **Normalizes** all indicators using z-score transformation over a historical lookback window
2. **Clusters** normalized values using percentile-based thresholds
3. **Aggregates** individual votes into a composite score ranging from -100 to +100
4. **Smooths** the composite score using selectable methods (SMA, EMA, WMA, HMA, TEMA, DEMA)
The clustering percentiles adapt dynamically based on current market volatility (ATR-normalized), ensuring the system remains responsive across different market conditions.
---
## Trading Modes
### 1. Normal Mode
Standard crossover-based signals using fixed thresholds (+10/-10). Suitable for balanced trading with moderate signal frequency.
### 2. Scalper Mode
Dynamic threshold adjustment based on recent score volatility. Generates more frequent signals by adapting to short-term price movements.
### 3. Aggressive Mode
Reversal-focused approach that triggers signals when the composite score crosses extreme levels (+80/-80), targeting major trend reversals.
### 4. Hybrid Mode
Combines Normal and Aggressive signals, capturing both standard crossovers and extreme reversals for comprehensive market coverage.
### 5. Super Scalper Mode
Ultra-responsive mode using signal line crossovers (14-period HMA of composite score) for maximum trade frequency.
### 6. Sniper Mode (Premium Feature)
Multi-confirmation system requiring alignment of:
- Composite score threshold breach
- Positive fast momentum (10-period SMI)
- Positive trend momentum (200-period SMI)
- Price above/below smart trend filter MA
This mode prioritizes precision over frequency, filtering out low-probability setups.
---
## Timeframe Presets
Pre-optimized configurations for common trading timeframes:
### 1 Minute Preset
- Fast smoothing (10-period WMA)
- Tight chop filter (61.8 threshold)
- Optimized for rapid scalping with minimal lag
### 2 Minute Preset
- Balanced smoothing (12-period EMA)
- Enhanced volume filtering
- Moderate cooling period (5 bars)
### 3 Minute Preset
- HMA smoothing for reduced lag
- Stochastic and CCI enabled
- Balanced approach for intraday trading
### 5 Minute Preset
- TEMA smoothing for trend following
- Stronger filters to reduce noise
- Extended lookback (1000 bars)
### 15 Minute Preset
- DEMA smoothing for swing positions
- Maximum filtering configuration
- All technical indicators enabled
- Suitable for swing trading and position building
Users can also select "Custom" to manually configure all parameters.
---
## Advanced Filtering System
### 1. Choppy Market Filter
Uses Choppiness Index calculation to identify consolidating markets. When CI exceeds the threshold, signals are suppressed to avoid whipsaw trades.
### 2. Smart Trend Filter
Configurable moving average (SMA/EMA/WMA/HMA/TEMA/DEMA/VWMA/RMA) that prevents counter-trend signals. Long signals require price above the MA, shorts require price below.
### 3. Volume Filter
Compares current volume to its moving average. Signals are suppressed when volume falls below the specified multiplier of average volume.
### 4. ATR Volatility Filter
Prevents trading during low volatility periods when ATR falls below its moving average multiplied by the specified factor.
### 5. Session Filter
Time-based filtering for Asia, London, New York, or combined sessions. Ensures trading only during preferred market hours.
### 6. Multi-Timeframe Confirmation
Optionally requires higher timeframe alignment before generating signals, adding confluence for higher probability trades.
### 7. Cooling Off Period
Prevents signal clustering by enforcing a minimum number of bars between consecutive signals.
---
## Smart Money Concepts Integration
### Order Block Detection
Identifies institutional supply/demand zones using multi-timeframe analysis:
- Detects strong directional candles followed by breakout moves
- Volume confirmation ensures significance
- Customizable timeframe selection (current TF or higher TF: 5m, 15m, 30m, 1H, Daily)
- Visual boxes mark active order blocks with automatic expiration after lookback period
- Price interaction alerts when touching active zones
### Liquidity Zones
Marks equal highs (EQH) and equal lows (EQL) where stop losses typically cluster, indicating potential reversal or breakout points.
---
## Momentum Analysis
### Fast Momentum (Default: 10-period)
Short-term momentum oscillator using Stochastic Momentum Index (SMI) calculation. Provides early warning of momentum shifts.
### Trend Momentum (Default: 200-period)
Long-term momentum gauge confirming overall trend direction. Used in Sniper Mode for multi-confirmation.
### Momentum Divergence Detection
Automatically identifies:
- **Regular Divergence**: Price makes new high/low but momentum doesn't (reversal signal)
- **Hidden Divergence**: Price makes higher low/lower high but momentum doesn't (continuation signal)
---
## Visual Components
### Price Chart Overlay
- **Smart Trend MA**: Dynamically colored moving average based on price position
- **EMA Cloud**: 50/200 EMA cloud showing long-term trend (background shading)
- **Trend Background**: Subtle background coloring based on composite score
- **Order Block Boxes**: Institutional supply/demand zones
- **Entry/Exit Markers**: Clear visual signals with emoji labels
- **Liquidity Markers**: EQH/EQL identification
### Bar Coloring
Bars change color based on active mode and market regime:
- **Sniper Mode**: Purple (bull) / Pink (bear)
- **Aggressive Mode**: Bright Green / Bright Red
- **Super Scalper**: Neon Green / Neon Red
- **Timeframe Presets**: Unique color schemes per preset
- **Choppy/Neutral**: Always gray regardless of mode
### Oscillator Pane
- **Composite Score Line**: Gradient-colored stepline showing current regime strength
- **Fast/Trend Momentum**: Optional overlays (gold/cyan colors)
- **Divergence Markers**: Visual alerts for regular, hidden, and momentum divergences
- **Power Zones**: Overbought/oversold regions (80/-80 levels)
- **Dynamic/Fixed Thresholds**: Visual reference lines based on active mode
### Interactive Dashboards
**Main Dashboard** displays:
- Active preset/mode configuration
- Real-time indicator values and votes
- Current market status (active/choppy/counter-trend/low volume/low ATR/MTF misalignment)
- Regime classification (Strong Long/Long/Neutral/Short/Strong Short)
- Smart Trend MA status
**Performance Dashboard** shows:
- Exit strategy (Fixed TP/SL, Trailing Stop, Opposite Signal)
- Total trades and win rate
- Total points and average per NY session
- Profit factor and recovery factor
- Best/worst trades and max drawdown
- Maximum winning/losing streaks
- Sharpe ratio and average risk:reward
**TP Optimizer** (33 variations tested):
- Tests take profit levels from 40 to 200 ticks (5-tick increments)
- Sortable by: Profit Factor, Win Rate, Total Points, Sharpe Ratio
- Displays top 5 configurations with full metrics
- Real-time optimization during backtesting
---
## Backtest Engine
### Exit Strategies
**1. Fixed TP/SL**
- Configurable in Ticks, ATR multiples, or Percentage
- Precise risk management with predefined targets
**2. Exit on Opposite Signal**
- Closes position when counter-signal appears
- Adapts to changing market conditions
- Useful for trend-following approaches
**3. Trailing Stop**
- Dynamic stop loss that follows profitable moves
- Configurable trailing offset percentage
- Locks in profits while allowing trends to develop
### Risk Management
- Optional minimum risk:reward filter
- Prevents trades below specified R:R threshold
- Date range filtering for historical analysis
- Session-based performance tracking
### Performance Metrics
- Win rate, profit factor, Sharpe ratio
- Maximum drawdown and recovery factor
- Consecutive win/loss streaks
- Average win/loss analysis
- Gross profit vs gross loss breakdown
---
## Alert System
Comprehensive alert conditions for:
- Entry signals (Long/Short)
- Exit events (TP/SL/Opposite/Trailing)
- Trend signals (Strong bullish/bearish)
- Divergences (Regular/Hidden/Momentum)
- Order block detection and touches
- Multi-condition strong signals (all confirmations aligned)
---
## How to Use
### Quick Start
1. Select your preferred timeframe preset (1m, 2m, 3m, 5m, 15m, or Custom)
2. Choose a trading mode (Normal, Scalper, Aggressive, Hybrid, Super Scalper, or Sniper)
3. Configure session filter to match your trading hours
4. Enable desired filters (choppy, trend, volume, ATR, MTF)
5. Set your exit strategy and TP/SL levels
6. Monitor signals on price chart and oscillator pane
### Optimization Workflow
1. Enable "Run TP Optimizer" in backtest settings
2. Run backtest on historical data
3. Review Optimizer Dashboard for best TP levels
4. Sort by preferred metric (Profit Factor, Win Rate, Total Points, Sharpe)
5. Apply winning configuration to live trading
### Advanced Configuration
- Customize individual indicator lengths and enable/disable specific components
- Adjust clustering parameters (lookback window, percentiles, cluster count)
- Fine-tune smoothing methods and lengths
- Configure order block detection timeframe and sensitivity
- Set cooling off period to control signal frequency
---
## Unique Features
1. **Adaptive Clustering**: Volatility-adjusted percentiles ensure consistent performance across market conditions
2. **Multi-Mode Architecture**: Six distinct trading modes from conservative to ultra-aggressive
3. **Timeframe Intelligence**: Pre-optimized presets eliminate guesswork for common timeframes
4. **Smart Money Integration**: Order block detection and liquidity zone marking
5. **Comprehensive Backtesting**: Three exit strategies with 33-variation TP optimization
6. **Visual Clarity**: Mode-specific bar coloring and clean chart presentation
7. **Filter Stack**: Seven-layer filtering system prevents low-quality signals
8. **Real-Time Metrics**: Live performance tracking with advanced statistics
---
## Benefits
- **Reduced False Signals**: Multi-confirmation clustering approach filters noise
- **Adaptability**: Works across timeframes and market conditions through preset system
- **Transparency**: Open visualization of all component votes and filtering status
- **Risk Management**: Built-in TP/SL optimization and R:R filtering
- **Time Efficiency**: Preset configurations save hours of manual optimization
- **Educational Value**: Dashboard shows exactly why signals trigger or get filtered
- **Professional Tools**: Institutional concepts (order blocks, liquidity zones) accessible to retail traders
---
## Best Practices
- Use Sniper Mode for high-probability setups during volatile markets
- Enable choppy filter during consolidation periods
- Combine Smart Trend Filter with MTF confirmation for swing trades
- Run TP Optimizer monthly to adapt to changing market dynamics
- Monitor Sharpe Ratio in addition to win rate for risk-adjusted performance
- Use session filters to avoid low-liquidity hours
- Start with preset configurations before custom optimization
---
## Technical Requirements
- TradingView Premium/Pro/Pro+ for full feature access
- Minimum chart history: 500 bars (adjustable in clustering settings)
- Works on all instruments (stocks, forex, crypto, futures)
- Compatible with standard candles (Heikin Ashi optional but not recommended for backtesting)
---
## Disclaimer
This indicator is a technical analysis tool designed to assist trading decisions. It does not guarantee profits and should be used in conjunction with proper risk management, fundamental analysis, and personal trading experience. Past performance does not indicate future results. Users should thoroughly test the indicator on demo accounts before live trading.
---
**Version**: 4.0
**Language**: Pine Script v6
**Type**: Overlay Indicator with Oscillator Pane
**Calculation**: On bar close (default) or real-time (configurable)

SB - RSI EW OscillatorAdd EW with RSI.
Makes sense take a call if RSI is above 50 and EW turns green and vice versa.

DR.SS.SMART BUY/SMARTSELL SCALPER1️⃣ BEST TIMEFRAME
Use this as a scalper / intraday trend tool
✅ Best
5 min
15 min
⚠️ Avoid
1 min (too noisy)
Daily (signals become late)
2️⃣ FIRST CHECK – MARKET CONDITION (Dashboard)
Before taking any trade, look at the Smart Panel (Dashboard):
✔ Trade ONLY when:
Market State = Trending
Volatility = Active
Trend Pressure = Bullish or Bearish
At least 3–4 MTF boxes are same color
❌ Avoid trades when:
Market State = No trend / Ranging
Purple candles (ADX sideways)
Remember:
T-V-T rule → Trend + Volatility + Timeframe agree
3️⃣ BUY SETUP (LONG TRADE)
✅ Conditions in your code:
Price crosses ABOVE Supertrend
Close ≥ SMA 13
Bar color turns BLUE
Price above EMA 200 → Smart Buy
ADX not sideways (no purple bars)
📍 Chart shows label:
“Buy” → normal buy
“Smart Buy” → high-probability trade (BEST)
🔵 HOW TO ENTER BUY
Enter at candle CLOSE where Buy / Smart Buy appears
Do NOT enter mid-candle
🛑 STOP LOSS (Auto from code)
SL = ATR-based stop
Shown as red SL line
👉 Safe rule:
Never widen SL
🎯 TARGETS (Auto plotted)
TP1 = 1:1
TP2 = 2:1
TP3 = 3:1
📌 Recommended management:
Book 50% at TP1
Move SL to Entry
Hold rest till TP2 / Trail
4️⃣ SELL SETUP (SHORT TRADE)
✅ Conditions:
Price crosses BELOW Supertrend
Close ≤ SMA 13
Bar color turns RED
Price below EMA 200 → Smart Sell
No sideways (ADX > 15)
📍 Label shown:
“Sell”
“Smart Sell” (BEST)
🔴 HOW TO ENTER SELL
Enter at close of signal candle
Follow same SL & TP rules
5️⃣ SUPPLY & DEMAND CONFIRMATION (POWER FILTER)
🔹 Best Buy:
Price near Demand Zone
Then Smart Buy appears
🔹 Best Sell:
Price near Supply Zone
Then Smart Sell appears
👉 These are institutional entries
6️⃣ WHEN NOT TO TRADE ❌
Avoid trades when:
Purple candles (Sideways)
Supertrend flipping repeatedly
MTF dashboard mixed colors
During low-volume sessions
7️⃣ SESSION WISE BEST PERFORMANCE
From your session logic:
✅ Best Scalping:
London
London + New York overlap
⚠️ Avoid:
Mid-Tokyo (low volatility)
8️⃣ PERFECT TRADE CHECKLIST (SAVE THIS)
Before clicking BUY/SELL, ask:
✔ Smart Buy / Smart Sell?
✔ Price above/below EMA 200?
✔ Dashboard trend agrees?
✔ No sideways candles?
✔ Volatility Active?
👉 If 4 out of 5 = YES → TAKE TRADE
9️⃣ SIMPLE ONE-LINE STRATEGY
Trade only Smart Buy/Sell in trending market, book partial at 1:1, trail rest with Smart Trail
✅ BEST TRADING SESSIONS (Use ONLY these)
🥇 LONDON SESSION (BEST & SAFE)
🕒 12:30 PM – 4:30 PM IST
Why best for your script
Clean trends
Good volatility
Less fake signals
Supertrend + EMA200 works perfectly
👉 This should be your PRIMARY session
🥈 LONDON → NEW YORK OVERLAP (MOST POWERFUL)
🕒 6:00 PM – 8:30 PM IST
Why
Institutional money enters
Strong breakouts
Smart Buy / Smart Sell accuracy highest
👉 Use only Smart signals in this session
🥉 NEW YORK SESSION (Early Part Only)
🕒 6:00 PM – 9:00 PM IST
Use when
Market State = Trending
Volatility = Active
MTF mostly same color
⚠️ Stop after 9:00 PM IST
❌ SESSIONS TO AVOID
🚫 TOKYO SESSION
🕒 5:30 AM – 10:30 AM IST
Low volatility
Sideways (purple candles)
Many fake reversals
🚫 SYDNEY SESSION
🕒 2:30 AM – 5:30 AM IST
Very low volume
Not suitable for scalping
🚫 INDIAN MIDDAY
🕒 11:00 AM – 12:15 PM IST
Choppy
Stop-hunting candles
📌 BEST DAILY ROUTINE (Follow This)
Time (IST) Action
9:15 – 10:30 ❌ Avoid (fake moves)
12:30 – 4:30 ✅ TRADE (Best zone)
6:00 – 8:30 ✅ TRADE (High accuracy)
After 9:00 ❌ Avoid
🧠 EASY MEMORY RULE (Your Style)
“LON → NY = MONEY” 💰
“ASIA = NO TRADE” ❌
🎯 FINAL RECOMMENDATION
If you want only ONE session:
👉 Trade ONLY: 12:30 PM – 4:30 PM IST
This will give:
Less stress
Higher win-rate
Cleaner Smart Buy/Sell signals
🇮🇳 BEST TRADING SESSIONS (INDIA – IST)
🥇 LONDON SESSION – BEST FOR INDIAN TRADERS
🕒 12:30 PM – 4:30 PM IST
✅ THIS IS THE BEST SESSION
Strong trend moves
High accuracy Smart Buy / Smart Sell
Less sideways (purple candles reduce)
Works perfectly with Supertrend + EMA 200
👉 Use this as your MAIN session
🥈 LONDON → NEW YORK OVERLAP (POWER SESSION)
🕒 6:00 PM – 8:30 PM IST
✅ Very strong moves
Institutional activity
Best breakouts
High RR trades (2:1 / 3:1)
⚠️ Trade only Smart Buy / Smart Sell
⚠️ Avoid over-trading
🥉 INDIAN MARKET OPEN (LIMITED USE)
🕒 9:20 AM – 10:15 AM IST
✔ Use only if:
Dashboard = Trending
Volatility = Active
Direction same as higher TF
❌ Avoid after 10:30 AM
❌ SESSIONS TO AVOID (INDIA)
Session Time (IST) Reason
Tokyo 5:30 – 10:30 AM Sideways / fake moves
Mid-day Chop 11:00 – 12:15 PM Low volume
Late NY After 9:00 PM Whipsaws
📌 BEST DAILY ROUTINE (INDIA)
Time What to Do
9:15 – 9:20 ❌ No trade
9:20 – 10:15 ⚠️ Only clean Smart signals
12:30 – 4:30 ✅ MAIN TRADING WINDOW
6:00 – 8:30 ✅ HIGH PROBABILITY
After 9:00 ❌ Stop trading
🧠 EASY MEMORY RULE
“INDIA → LONDON → MONEY” 💰
“ASIA MIDDAY → NO TRADE” ❌
🎯 FINAL ANSWER (ONE-LINE)
👉 For India (IST), trade ONLY between
12:30 PM – 4:30 PM and 6:00 PM – 8:30 PM

Velocity SwingtraderThe intended objective of this indicator to gauge trend and momentum and find trades that are at the beginning of a trend change for longer periods of time (days, weeks, months).

Relative Strength IndexRSI for indian market buy low and sell high.
rsi 3 low belo 15 buy and rsi high above 85 sell

Density Zones (GM Crossing Clusters) + QHO Spin FlipsINDICATOR NAME
Density Zones (GM Crossing Clusters) + QHO Spin Flips
OVERVIEW
This indicator combines two complementary ideas into a single overlay: *this combines my earlier Geometric Mean Indicator with the Quantum Harmonic Oscillator (Overlay) with additional enhancements*
1) Density Zones (GM Crossing Clusters)
A “Density Zone” is detected when price repeatedly crosses a Geometric Mean equilibrium line (GM) within a rolling lookback window. Conceptually, this identifies regions where the market is repeatedly “snapping” across an equilibrium boundary—high churn, high decision pressure, and repeated re-selection of direction.
2) QHO Spin Flips (Regression-Residual σ Breaches)
A “Spin Flip” is detected when price deviates beyond a configurable σ-threshold (κ) from a regression-based equilibrium, using normalized residuals. Conceptually, this marks excursions into extreme states (decoherence / expansion), which often precede a reversion toward equilibrium and/or a regime re-scaling.
These two systems are related but not identical:
- Density Zones identify where equilibrium crossings cluster (a “singularity”/anchor behavior around GM).
- Spin Flips identify when price exceeds statistically extreme displacement from the regression equilibrium (LSR), indicating expansion beyond typical variance.
CORE CONCEPTS AND FORMULAS
SECTION A — GEOMETRIC MEAN EQUILIBRIUM (GM)
We define two moving averages:
(1) MA1_t = SMA(close_t, L1)
(2) MA2_t = SMA(close_t, L2)
We define the equilibrium anchor as the geometric mean of MA1 and MA2:
(3) GM_t = sqrt( MA1_t * MA2_t )
This GM line acts as an equilibrium boundary. Repeated crossings are interpreted as high “equilibrium churn.”
SECTION B — CROSS EVENTS (UP/DOWN)
A “cross event” is registered when the sign of (close - GM) changes:
Define a sign function s_t:
(4) s_t =
+1 if close_t > GM_t
-1 if close_t < GM_t
s_{t-1} if close_t == GM_t (tie-breaker to avoid false flips)
Then define the crossing event indicator:
(5) crossEvent_t = 1 if s_t != s_{t-1}
0 otherwise
Additionally, the indicator plots explicit cross markers:
- Cross Above GM: crossover(close, GM)
- Cross Below GM: crossunder(close, GM)
These provide directional visual cues and match the original Geometric Mean Indicator behavior.
SECTION C — DENSITY MEASURE (CROSSING CLUSTER COUNT)
A Density Zone is based on the number of cross events occurring in the last W bars:
(6) D_t = Σ_{i=0..W-1} crossEvent_{t-i}
This is a “crossing density” score: how many times price has toggled across GM recently.
The script implements this efficiently using a cumulative sum identity:
Let x_t = crossEvent_t.
(7) cumX_t = Σ_{j=0..t} x_j
Then:
(8) D_t = cumX_t - cumX_{t-W} (for t >= W)
cumX_t (for t < W)
SECTION D — DENSITY ZONE TRIGGER
We define a Density Zone state:
(9) isDZ_t = ( D_t >= θ )
where:
- θ (theta) is the user-selected crossing threshold.
Zone edges:
(10) dzStart_t = isDZ_t AND NOT isDZ_{t-1}
(11) dzEnd_t = NOT isDZ_t AND isDZ_{t-1}
SECTION E — DENSITY ZONE BOUNDS
While inside a Density Zone, we track the running high/low to display zone bounds:
(12) dzHi_t = max(dzHi_{t-1}, high_t) if isDZ_t
(13) dzLo_t = min(dzLo_{t-1}, low_t) if isDZ_t
On dzStart:
(14) dzHi_t := high_t
(15) dzLo_t := low_t
Outside zones, bounds are reset to NA.
These bounds visually bracket the “singularity span” (the churn envelope) during each density episode.
SECTION F — QHO EQUILIBRIUM (REGRESSION CENTERLINE)
Define the regression equilibrium (LSR):
(16) m_t = linreg(close_t, L, 0)
This is the “centerline” the QHO system uses as equilibrium.
SECTION G — RESIDUAL AND σ (FIELD WIDTH)
Residual:
(17) r_t = close_t - m_t
Rolling standard deviation of residuals:
(18) σ_t = stdev(r_t, L)
This σ_t is the local volatility/width of the residual field around the regression equilibrium.
SECTION H — NORMALIZED DISPLACEMENT AND SPIN FLIP
Define the standardized displacement:
(19) Y_t = (close_t - m_t) / σ_t
(If σ_t = 0, the script safely treats Y_t = 0.)
Spin Flip trigger uses a user threshold κ:
(20) spinFlip_t = ( |Y_t| > κ )
Directional spin flips:
(21) spinUp_t = ( Y_t > +κ )
(22) spinDn_t = ( Y_t < -κ )
The default κ=3.0 corresponds to “3σ excursions,” which are statistically extreme under a normal residual assumption (even though real markets are not perfectly normal).
SECTION I — QHO BANDS (OPTIONAL VISUALIZATION)
The indicator optionally draws the standard σ-bands around the regression equilibrium:
(23) 1σ bands: m_t ± 1·σ_t
(24) 2σ bands: m_t ± 2·σ_t
(25) 3σ bands: m_t ± 3·σ_t
These provide immediate context for the Spin Flip events.
WHAT YOU SEE ON THE CHART
1) MA1 / MA2 / GM lines (optional)
- MA1 (blue), MA2 (red), GM (green).
- GM is the equilibrium anchor for Density Zones and cross markers.
2) GM Cross Markers (optional)
- “GM↑” label markers appear on bars where close crosses above GM.
- “GM↓” label markers appear on bars where close crosses below GM.
3) Density Zone Shading (optional)
- Background shading appears while isDZ_t = true.
- This is the period where the crossing density D_t is above θ.
4) Density Zone High/Low Bounds (optional)
- Two lines (dzHi / dzLo) are drawn only while in-zone.
- These bounds bracket the full churn envelope during the density episode.
5) QHO Bands (optional)
- 1σ, 2σ, 3σ shaded zones around regression equilibrium.
- These visualize the current variance field.
6) Regression Equilibrium (LSR Centerline)
- The white centerline is the regression equilibrium m_t.
7) Spin Flip Markers
- A circle is plotted when |Y_t| > κ (beyond your chosen σ-threshold).
- Marker size is user-controlled (tiny → huge).
HOW TO USE IT
Step 1 — Pick the equilibrium anchor (GM)
- L1 and L2 define MA1 and MA2.
- GM = sqrt(MA1 * MA2) becomes your equilibrium boundary.
Typical choices:
- Faster equilibrium: L1=20, L2=50 (default-like).
- Slower equilibrium: L1=50, L2=200 (macro anchor).
Interpretation:
- GM acts like a “center of mass” between two moving averages.
- Crosses show when price flips from one side of equilibrium to the other.
Step 2 — Tune Density Zones (W and θ)
- W controls the time window measured (how far back you count crossings).
- θ controls how many crossings qualify as a “density/singularity episode.”
Guideline:
- Larger W = slower, broader density detection.
- Higher θ = only the most intense churn is labeled as a Density Zone.
Interpretation:
- A Density Zone is not “bullish” or “bearish” by itself.
- It is a condition: repeated equilibrium toggling (high churn / high compression).
- These often precede expansions, but direction is not implied by the zone alone.
Step 3 — Tune the QHO spin flip sensitivity (L and κ)
- L controls regression memory and σ estimation length.
- κ controls how extreme the displacement must be to trigger a spin flip.
Guideline:
- Smaller L = more reactive centerline and σ.
- Larger L = smoother, slower “field” definition.
- κ=3.0 = strong extreme filter.
- κ=2.0 = more frequent flips.
Interpretation:
- Spin flips mark when price exits the “normal” residual field.
- In your model language: a moment of decoherence/expansion that is statistically extreme relative to recent equilibrium.
Step 4 — Read the combined behavior (your key thesis)
A) Density Zone forms (GM churn clusters):
- Market repeatedly crosses equilibrium (GM), compressing into a bounded churn envelope.
- dzHi/dzLo show the envelope range.
B) Expansion occurs:
- Price can release away from the density envelope (up or down).
- If it expands far enough relative to regression equilibrium, a Spin Flip triggers (|Y| > κ).
C) Re-coherence:
- After a spin flip, price often returns toward equilibrium structures:
- toward the regression centerline m_t
- and/or back toward the density envelope (dzHi/dzLo) depending on regime behavior.
- The indicator does not guarantee return, but it highlights the condition where return-to-field is statistically likely in many regimes.
IMPORTANT NOTES / DISCLAIMERS
- This indicator is an analytical overlay. It does not provide financial advice.
- Density Zones are condition states derived from GM crossing frequency; they do not predict direction.
- Spin Flips are statistical excursions based on regression residuals and rolling σ; markets have fat tails and non-stationarity, so σ-based thresholds are contextual, not absolute.
- All parameters (L1, L2, W, θ, L, κ) should be tuned per asset, timeframe, and volatility regime.
PARAMETER SUMMARY
Geometric Mean / Density Zones:
- L1: MA1 length
- L2: MA2 length
- GM_t = sqrt(SMA(L1)*SMA(L2))
- W: crossing-count lookback window
- θ: crossing density threshold
- D_t = Σ crossEvent_{t-i} over W
- isDZ_t = (D_t >= θ)
- dzHi/dzLo track envelope bounds while isDZ is true
QHO / Spin Flips:
- L: regression + residual σ length
- m_t = linreg(close, L, 0)
- r_t = close_t - m_t
- σ_t = stdev(r_t, L)
- Y_t = r_t / σ_t
- spinFlip_t = (|Y_t| > κ)
Visual Controls:
- toggles for GM lines, cross markers, zone shading, bounds, QHO bands
- marker size options for GM crosses and spin flips
ALERTS INCLUDED
- Density Zone START / END
- Spin Flip UP / DOWN
- Cross Above GM / Cross Below GM
SUMMARY
This indicator treats the Geometric Mean as an equilibrium boundary and identifies “Density Zones” when price repeatedly crosses that equilibrium within a rolling window, forming a bounded churn envelope (dzHi/dzLo). It also models a regression-based equilibrium field and triggers “Spin Flips” when price makes statistically extreme σ-excursions from that field. Used together, Density Zones highlight compression/decision regions (equilibrium churn), while Spin Flips highlight extreme expansion states (σ-breaches), allowing the user to visualize how price compresses around equilibrium, releases outward, and often re-stabilizes around equilibrium structures over time.
