Premium Fibonacci Buy/Sell [MasoodPro]OVERVIEW
This script plots Fibonacci Entry Bands, a trend-following and mean-reversion hybrid system built around dynamic volatility-adjusted bands scaled using key Fibonacci levels. It calculates a smoothed basis line and overlays multiple bands at fixed Fibonacci multipliers of either ATR or standard deviation. Depending on the trend direction, specific upper or lower bands become active, offering a clear framework for entry timing, trend identification, and profit-taking zones.
CONCEPTS
The core idea is to use Fibonacci levels—0.618, 1.0, 1.618, and 2.618—as multipliers on a volatility measure to form layered price bands around a trend-following moving average. Trends are defined by whether the basis is rising or falling. The trend determines which side of the bands is emphasized: upper bands for downtrends, lower bands for uptrends. This approach captures both directional bias and extreme price extensions. Take-profit logic is built in via crossovers relative to the outermost bands, scaled by user-selected aggressiveness.
FEATURES
Basis Line – A double EMA smoothing of the source defines trend direction and acts as the central mean.
snapshot
Volatility Bands – Four levels per side (based on selected ATR or stdev) mark the Fibonacci bands. These become visible only when trend direction matches the side (e.g., only lower bands plot in an uptrend).
snapshot
Bar Coloring – Bars are shaded with adjustable transparency depending on distance from the basis, with color intensity helping gauge overextension.
snapshot
Entry Arrows – A trend shift triggers either a long or short signal, with a marker at the outermost band with ▲/▼ signs.
snapshot
Take-Profit Crosses – If price rejects near the outer band (based on aggressiveness setting), a cross appears marking potential profit-taking.
snapshot
Bounce Signals – Minor pullbacks that respect the basis line are marked with triangle arrows, hinting at continuation setups.
snapshot
Customization – Users can toggle bar coloring, signal markers, and select between ATR/stdev as well as take-profit aggressiveness.
Alerts – All major signals, including entries, take-profits, and bounces, are available as alert conditions.
Penunjuk dan strategi

Universal Renko Bars by SiddWolfUniversal Renko Bars or UniRenko Bars is an overlay indicator that applies the logic of Renko charting directly onto a standard candlestick chart. It generates a sequence of price-driven bricks, where each new brick is formed only when the price moves a specific amount, regardless of time. This provides a clean, price-action-focused visualization of the market's trend.
WHAT IS UNIVERSAL RENKO BARS?
For years, traders have faced a stark choice: the clean, noise-free world of Renko charts, or the rich, time-based context of Candlesticks. Choosing Renko meant giving up your favorite moving averages, volume profiles, and the fundamental sense of time. Choosing Candlesticks meant enduring the market noise that often clouds true price action.
But what if you didn't have to choose?
Universal Renko Bars is a revolutionary indicator that ends this dilemma. It's not just another charting tool; it's a powerful synthesis that overlays the pure, price-driven logic of Renko bricks directly onto your standard candlestick chart. This hybrid approach gives you the best of both worlds:
❖ The Clarity of Renko: By filtering out the insignificant noise of time, Universal Renko reveals the underlying trend with unparalleled clarity. Up trends are clean successions of green bricks; down trends are clear red bricks. No more guesswork.
❖ The Context of Candlesticks: Because the Renko logic is an overlay, you retain your time axis, your volume data, and full compatibility with every other time-based indicator in your arsenal (RSI, MACD, Moving Averages, etc.).
The true magic, however, lies in its live, Unconfirmed Renko brick. This semi-transparent box is your window into the current bar's real-time struggle. It grows, shrinks, and changes color with every tick, showing you exactly how close the price is to confirming the trend or forcing a reversal. It’s no longer a lagging indicator; it’s a live look at the current battle between buyers and sellers.
Universal Renko Bars unifies these two powerful charting methods, transforming your chart into a more intelligent, noise-free, and predictive analytical canvas.
HOW TO USE
To get the most out of Universal Renko Bars, here are a few tips and a full breakdown of the settings.
Initial Setup for the Best Experience
For the cleanest possible view, it's highly recommended that you hide the body of your standard candlesticks, that shows only the skelton of the candle. This allows the Renko bricks to become the primary focus of your chart.
→ Double click on the candles and uncheck the body checkbox.
Settings Breakdown
The indicator is designed to be powerful yet intuitive. The settings are grouped to make customization easy.
First, What is a "Tick"?
Before we dive in, it's important to understand the concept of a "Tick." In Universal Renko, a Tick is not the same as a market tick. It's a fundamental unit of price movement that you define. For example, if you set the Tick Size to $0.50, then a price move of $1.00 is equal to 2 Ticks. This is the core building block for all Renko bricks. Tick size here is dynamically determined by the settings provided in the indicator.
❖ Calculation Method (The "Tick Size" Engine)
This section determines the monetary value of a single "Tick."
`Calculation Method` : Choose your preferred engine for defining the Tick Size.
`ATR Based` (Default): The Tick Size becomes dynamic, based on market volatility (Average True Range). Bricks will get larger in volatile markets and smaller in quiet ones. Use the `ATR 14 Multiplier` to control the sensitivity.
`Percentage` : The Tick Size is a simple percentage of the current asset price, controlled by the `Percent Size (%)` input.
`Auto` : The "set it and forget it" mode. The script intelligently calculates a Tick Size based on the asset's price. Use the `Auto Sensitivity` slider to make these automatically calculated bricks thicker (value > 1.0) or thinner (value < 1.0).
❖ Parameters (The Core Renko Engine)
This group controls how the bricks are constructed based on the Tick Size.
`Tick Trend` : The number of "Ticks" the price must move in the same direction to print a new continuation brick. A smaller value means bricks form more easily.
`Tick Reversal` : The number of "Ticks" the price must move in the opposite direction to print a new reversal brick. This is typically set higher than `Tick Trend` (e.g., double) to filter out minor pullbacks and market noise.
`Open Offset` : Controls the visual overlap of the bricks. A value of `0` creates gapless bricks that start where the last one ended. A value of `2` (with a `Tick Reversal` of 4) creates the classic 50% overlap look.
❖ Visuals (Controlling What You See)
This is where you tailor the chart to your visual preference.
`Show Confirmed Renko` : Toggles the solid-colored, historical bricks. These are finalized and will never change. They represent the confirmed past trend.
`Show Unconfirmed Renko` : This is the most powerful visual feature. It toggles the live, semi-transparent box that represents the developing brick. It shows you exactly where the price is right now in relation to the levels needed to form the next brick.
`Show Max/Min Levels` : Toggles the horizontal "finish lines" on your chart. The green line is the price target for a bullish brick, and the red line is the target for a bearish brick. These are excellent for spotting breakouts.
`Show Info Label` : Toggles the on-chart label that provides key real-time stats:
🧱 Bricks: The total count of confirmed bricks.
⏳ Live: How many chart bars the current live brick has been forming. These bars forms the Renko bricks that aren't confirmed yet. Live = 0 means the latest renko brick is confirmed.
🌲 Tick Size: The current calculated value of a single Tick.
Hover over the label for a tooltip with live RSI(14), MFI(14), and CCI(20) data for additional confirmation.
TRADING STRATEGIES & IDEAS
Universal Renko Bars isn't just a visual tool; it's a foundation for building robust trading strategies.
Trend Confirmation: The primary use is to instantly identify the trend. A series of green bricks indicates a strong uptrend; a series of red bricks indicates a strong downtrend. Use this to filter out trades that go against the primary momentum.
Reversal Spotting: Pay close attention to the Unconfirmed Brick . When a strong trend is in place and the live brick starts to fight against it—changing color and growing larger—it can be an early warning that a reversal is imminent. Wait for the brick to be confirmed for a higher probability entry.
Breakout Trading: The `Max/Min Levels` are your dynamic breakout zones. A long entry can be considered when the price breaks and closes above the green Max Level, confirming a new bullish brick. A short entry can be taken when price breaks below the red Min Level.
Confluence & Indicator Synergy: This is where Universal Renko truly shines. Overlay a moving average (e.g., 20 EMA). Only take long trades when the green bricks are forming above the EMA. Combine it with RSI or MACD; a bearish reversal brick forming while the RSI shows bearish divergence is a very powerful signal.
A FINAL WORD
Universal Renko Bars was designed to solve a fundamental problem in technical analysis. It brings together the best elements of two powerful methodologies to give you a clearer, more actionable view of the market. By filtering noise while retaining context, it empowers you to make decisions with greater confidence.
Add Universal Renko Bars to your chart today and elevate your analysis. We welcome your feedback and suggestions for future updates!
Follow me to get notified when I publish New Indicator.
~ SiddWolf

RAA Buy Sell[RanaAlgo]Overview
The RAA (RanaAlgo Adaptive Average) Buy Sell indicator is a trend-following tool that helps identify potential buy and sell signals based on price deviation from an adaptive moving average. It uses a combination of:
(Fractal Adaptive Moving Average) – Adjusts its sensitivity based on market volatility.
RAA Bands – Dynamic upper/lower bands calculated using a multiplier applied to the average deviation.
🔹 Key Features
Trend Identification
Bullish Trend →
Bearish Trend →
Signal Generation
Visual Enhancements
Colored candles (green for bullish, red for bearish).
Dynamic bands to visualize trend strength.
Alerts
Customizable buy/sell alerts for real-time notifications.
🔹 Usefulness in Trading
✅ Trend Confirmation – Helps confirm trend direction before entering trades.
✅ Reduces False Signals – Uses adaptive bands to filter out noise.
✅ Works Across Timeframes – Effective on intraday, swing, and long-term trading.
✅ Customizable – Adjustable length and multiplier for different market conditions.
🔹 Best Used For
Trend-following strategies (riding strong trends).
Breakout trading (entering when price confirms momentum).
Avoiding choppy markets (since the adaptive bands widen in volatility).

Essa - Market Structure & Fibonacci ToolkitOverview
The Essa Market Structure & Fibonacci Toolkit is a comprehensive trading indicator that combines advanced market structure analysis with customizable fibonacci levels and fair value gap detection. It identifies high-probability trading opportunities by detecting confluence zones where multiple technical factors align, providing traders with precise entry and exit points based on institutional trading concepts.
Key Features
📊Market Structure Analysis
Pattern Recognition: Automatically detects Higher Highs (HH), Higher Lows (HL), Lower Highs (LH), Lower Lows (LL)
Change of Character (CHoCH): Identifies trend changes and market structure breaks
Pattern Locking: Fibonacci levels lock to specific swing patterns (LH→LL for bearish, HL→HH for bullish)
Multi-Timeframe Analysis: Analyzes trend strength across multiple timeframes with scoring system
🧮 Custom Fibonacci System
Fully Configurable Levels: Set any percentage (e.g., 25%, 65%, 87.5%) - not limited to traditional levels
Dynamic Labels: Shows your actual percentages, not hardcoded values
Golden Zone Trading: Customizable optimal entry zones between any two fibonacci levels
Auto-Extension: Levels automatically extend as price moves
Distance Tables: Real-time pip distances to nearest fibonacci levels
📈 Fair Value Gap (FVG) Detection
Smart Detection: Identifies bullish and bearish fair value gaps with size filtering
Age Tracking: Shows how long each FVG has been active (bars or time format)
Confluence Highlighting: Enhanced colors when FVGs overlap with fibonacci golden zones
Width Filtering: ATR-based minimum width requirements to filter noise
🎯 Confluence Trading
Multi-Factor Analysis: Combines market structure + fibonacci + FVGs + golden zones
High-Probability Zones: Highlights areas where multiple factors converge
Trend Strength Scoring: 0-100% scoring system based on multiple confluence factors
Smart Alerts: Notifications for high-confluence setups only
⚡ Advanced Features
Trend Analysis Table: Real-time trend bias, strength score, and pattern identification
Adaptive Sensitivity: Automatically adjusts to market volatility using ATR
Professional Alerts: Customizable alerts for structure breaks, golden zone touches, and FVG confluence
Clean Interface: Basic/Advanced settings organization with inline controls
🎨 Visual Excellence
Professional Styling: Clean, institutional-grade visual presentation
Customizable Colors: Full color customization for all elements
Smart Labeling: Context-aware labels that don't overlap
Performance Optimized: Efficient rendering with visual element limits
Perfect for: Swing traders, day traders, and institutional-style traders who want to identify high-probability setups using confluence of market structure, fibonacci levels, and fair value gaps.

Fractal Pullback Market StructureFractal Pullback Market Structure
Author: The_Forex_Steward
License: Mozilla Public License 2.0
The Fractal Pullback Market Structure indicator is a sophisticated price action tool designed to visualize internal structure shifts and break-of-structure (BoS) events with high accuracy. It leverages fractal pullback logic to identify market swing points and confirm whether a directional change has occurred.
This indicator detects swing highs and lows based on fractal behavior, drawing zigzag lines to connect these key pivot points. It classifies and labels each structural point as either a Higher High (HH), Higher Low (HL), Lower High (LH), or Lower Low (LL). Internal shifts are marked using triangle symbols on the chart, distinguishing bullish from bearish developments.
Break of Structure events are confirmed when price closes beyond the most recent swing high or low, and a horizontal line is drawn at the breakout level. This helps traders validate when a structural trend change is underway.
Users can configure the lookback period that defines the sensitivity of the pullback detection, as well as a timeframe multiplier to align the logic with higher timeframes such as 4H or Daily. There are visual customization settings for the zigzag lines and BoS markers, including color, width, and style (solid, dotted, or dashed).
Alerts are available for each key structural label—HH, HL, LH, LL—as well as for BoS events. These alerts are filtered through a selectable alert mode that separates signals by timeframe category: Low Timeframe (LTF), Medium Timeframe (MTF), and High Timeframe (HTF). Each mode allows the user to receive alerts only when relevant to their strategy.
This indicator excels in trend confirmation and reversal detection. Traders can use it to identify developing structure, validate internal shifts, and anticipate breakout continuation or rejection. It is particularly useful for Smart Money Concept (SMC) traders, swing traders, and those looking to refine entries and exits based on price structure rather than lagging indicators.
Visual clarity, adaptable timeframe logic, and precise structural event detection make this tool a valuable addition to any price action trader’s toolkit.

顶底力量这个"顶底力量"指标是一个反转信号识别器,专门用来捕捉价格的顶部和底部转折点。
顶部信号(红色下三角):
价格创新高但动量衰竭
适合考虑做空或止盈多单
底部信号(绿色上三角):
价格创新低但动能衰竭
适合考虑做多或止盈空单
优缺点
优点:
结合价格行为和动量指标,相对可靠
有确认机制,减少假信号
专门捕捉转折点,适合波段交易
缺点:
在强趋势中容易产生假信号
RSI可能长时间保持极值状态
确认周期短,可能错过最佳入场点
Application Scenarios
This is a typical reversal trading indicator:
Top Signal (Red down triangle):
Price makes new high but momentum is exhausted
Consider short entry or take profit on long positions
Bottom Signal (Green up triangle):
Price makes new low but selling pressure is exhausted
Consider long entry or take profit on short positions
Pros and Cons
Advantages:
Combines price action with momentum indicator for reliability
Has confirmation mechanism to reduce false signals
Specifically targets turning points, suitable for swing trading
Disadvantages:
May generate false signals in strong trending markets
RSI can remain at extreme levels for extended periods
Short confirmation period might miss optimal entry points
This indicator is particularly effective in sideways markets or at trend exhaustion points for timing reversal entries.

Alma SD SuperTrend | OquantAlma SD SuperTrend | Oquant
The "Alma SD SuperTrend | Oquant" is a trend-following indicator that integrates the Arnaud Legoux Moving Average (ALMA) with a SuperTrend calculation based on standard deviation (SD). Designed to quickly identify and follow market trends while reducing noise, this script provides buy and sell signals for traders across various assets and timeframes.
This script offers a unique approach by combining ALMA with a SuperTrend framework that uses standard deviation instead of the traditional Average True Range (ATR). This implementation focuses on fast trend detection with minimized noise, making it suitable for trend-following or swing trading strategies. The script’s customizable parameters allow traders to adapt it to their preferred trading style.
How It Works
Arnaud Legoux Moving Average (ALMA): ALMA is an advanced moving average that applies a Gaussian filter to smooth price data, reducing market noise while preserving responsiveness to price changes. It uses three parameters:
Length: Sets the lookback period for smoothing. Longer periods produce smoother results.
Offset: Shifts the moving average toward recent prices. Higher offsets emphasize newer data for faster trend detection.
Sigma controls the smoothness and lag of the Alma by adjusting the spread of the Gaussian distribution used in the calculation.
Standard Deviation (SD) Calculation: The script calculates the standard deviation of the price over a specified period to measure volatility. SD measures how much the prices deviate from its mean, offering a statistical perspective on market volatility. This is used to create dynamic upper and lower bands around the ALMA line, adjusted by a user-defined factor. The bands expand in volatile markets and contract in stable conditions, helping in trend detection.
SuperTrend Logic: The script generates a SuperTrend line that dynamically tracks market trends by switching between upper and lower volatility bands based on price movement. Here's how it works:
The SuperTrend line is calculated using the ALMA (Arnaud Legoux Moving Average) as a baseline, with upper and lower bands created by adding and subtracting a multiple(Factor) of the standard deviation (SD) from the ALMA.
When the price moves above the upper band, the SuperTrend line shifts to the lower band, indicating a bullish trend (potential buy signal).
When the price falls below the lower band, the SuperTrend line switches to the upper band, signaling a bearish trend (potential sell signal).
To avoid quick, unreliable changes, this script intelligently adjusts the SuperTrend bands for stability. While the SuperTrend line dynamically follows market movements, it's designed to hold at its previous level if the price doesn't cross a band or confirm a new trend direction. This approach ensures the SuperTrend quickly identifies and follows genuine market trends, providing clear signals while effectively reducing false alerts from short-term price swings.
Differences from Traditional SuperTrend:
Baseline: The traditional SuperTrend typically uses a hl2((high + low)/2)as its baseline, while this script employs ALMA for a smoother, noise-filtered trend foundation.
Volatility Measure: Instead of ATR, this script uses standard deviation to calculate the bands. Standard deviation measures how much the prices vary or spread out from its mean.
Visualization: The script plots the SuperTrend line, colors candles to match the trend, and fills the area between the price and the SuperTrend line for visual clarity, helping traders quickly identify trend direction and strength (green for bullish, purple for bearish).
How to Use It
Add to Chart: Apply the indicator to any market and timeframe.
Interpret Signals:
Green Line and Candles: Bullish trend (price above the SuperTrend line). Consider long entries.
Purple Line and Candles: Bearish trend (price below the SuperTrend line). Consider short entries.
Filled Area: The shaded area between price and the SuperTrend line highlights trend direction(green for bullish, purple for bearish).
Adjust Inputs:
Source: Select the price data to use (e.g., close, open, high, low).
Factor: Adjusts band width. Higher values widen bands, reducing sensitivity.
SD Length: Period for calculating standard deviation. Longer periods smooth volatility.
ALMA Length: Period for ALMA. Longer periods increase smoothness.
Alma Offset: Shift the moving average toward recent or older prices. Higher offsets emphasize newer data for faster trend detection.
ALMA Sigma control the smoothness and lag of the Alma by adjusting the spread of the Gaussian distribution used in the calculation.
Alerts
This indicator includes optional built-in alert conditions that notify you when the signal crosses above 0 (long signal, price above upper band) or below 0 (short signal, price below lower band). Enable these alerts to get timely updates on potential trend shifts without constantly monitoring the chart.
⚠️ Disclaimer: This indicator is intended for educational and informational purposes only. Trading/investing involves risk, and past performance does not guarantee future results. Always test and evaluate indicators/strategies before applying them in live markets. Use at your own risk.

PTST – Distance from 66-Day LowThis simple yet powerful indicator shows how far the current price is from the lowest low of the last 66 trading days, expressed as a percentage.
🔍 Why use this?
• Identify overextended downtrends or potential bounce zones
• Spot stocks forming major bottoms
• Use it as a mean-reversion or strength filter
✅ Features
• Customizable lookback (default: 66 days)
• Clean, clutter-free plot
• Works on any timeframe and asset

Multi-Timeframe 200 SMAs (2m, 5m, 10m, 1H, 1D)Intraday 200 SMA Multi-Timeframe Overlay
This indicator displays the 200-period Simple Moving Averages (SMA) from the 2-minute, 5-minute, 10-minute, 1-hour, and 1-day timeframes on any chart — providing powerful multi-timeframe context for intraday trading.
Each moving average is color-coded and labeled for quick reference, helping traders identify dynamic support and resistance levels across key timeframes without needing to switch charts. Designed specifically for day traders, this tool enhances situational awareness and assists in aligning trades with broader trend direction.
Features:
2-minute 200 SMA (Yellow)
5-minute 200 SMA (Light Orange)
10-minute 200 SMA (Dark Orange)
1-hour 200 SMA (Red)
1-day 200 SMA (Purple)
Displayed on any intraday chart
Clean line styles with optional labels for timeframe reference
Perfect for scalpers and intraday swing traders who rely on higher timeframe moving averages for confluence and trade validation.

Smooth Cloud Pro [Markking77]📝 Premium Indicator Description: FVG Zones + Liquidity Concept + RSI + SMC
> "Unlock the power of institutional-grade trading analysis with this advanced indicator that blends Fair Value Gaps (FVG), Liquidity Sweeps, and Smart Money Concepts into one professional system. Designed for precision and clarity, this tool also includes RSI confirmation to support high-probability Buy and Sell setups. Ideal for scalpers, intraday, and swing traday
📌 Key Features:
🔹 Fair Value Gap Zones (FVG)
Automatically detects bullish and bearish imbalances in price.
Clearly marked premium-colored boxes for instant visual clarity.
Ideal for spotting institutional order flow zones.
🔹 Liquidity Sweeps
Identifies liquidity grabs where price takes out equal highs or lows.
Highlights potential reversal or continuation points based on Smart Money Concepts (SMC).
Great for front-running retail stop hunts.
🔹 Equal Highs & Lows
Highlights zones where liquidity pools build up (e.g., double tops/bottoms).
Helps you anticipate where price might target next.
🔹 RSI Confirmation (Color Gradient)
Uses a multi-timeframe RSI visual band to confirm overbought/oversold conditions.
Premium color gradient helps quickly identify bullish/bearish momentum shifts.
Synchronizes well with entry signals from FVG and CHoCH zones.
🔹 Buy/Sell Zones & CHoCH / BOS Labels
Automatic detection of Break of Structure (BOS) and Change of Character (CHoCH).
Clear Buy/Sell labels positioned above/below candles.
Excellent for following SMC entry models with visual clarity.
🧠 How to Use:
1. Look for a Liquidity Sweep followed by a CHoCH or BOS.
2. Confirm using RSI color gradient (green for bullish, red for bearish).
3. Enter trades within the FVG zone after confirmation.
4. Exit near opposing FVG or Liquidity Pools.

Orb [LUM3N]Orb – Opening Range Breakout Strategy with Confidence Engine
Description
The Orb script is a precision-engineered Opening Range Breakout (ORB) system designed for intraday and scalping strategies. Built around the first 15–30 minutes of price action, it identifies high-probability breakout entries, confirms momentum using 1-minute signals, and automatically calculates Fibonacci-based profit targets.
Key Features:
✅ Customizable ORB Timeframe (15 or 30 mins)
✅ Dynamic Stop Loss Options (Fixed %, ATR-based, EMA trailing)
✅ Fibonacci Take Profit Targets (1.272 / 1.618 / 2.0)
✅ Retest Logic with Smart Labels (confirms strength after breakout)
✅ Time-Based Exit Functionality (automatically closes trades after X minutes)
✅ Built-in Volume Spike Filter (optional)
✅ Multi-Factor Confidence Score using RSI, MACD Histogram, and VWAP
✅ Live Dashboard displaying entry price, TP levels, live % gain, and signal confidence
The confidence engine uses a weighted scoring system to determine if a breakout is High, Medium, or Low confidence — giving traders more control and clarity.
Ideal for structured day traders looking to automate key rules and reduce guesswork.

MP MTF LiquidityMP MTF Liquidity
Multi-Timeframe Liquidity Levels – Automatic High/Low Tracking
This indicator automatically tracks and draws liquidity levels (recent highs and lows) from up to 6 custom timeframes directly on your chart. It’s designed for advanced traders who want to visualize important swing points and liquidity pools across multiple timeframes—ideal for Smart Money Concepts (SMC), ICT, and price action trading.
Key Features:
Multi-Timeframe Support:
Select up to 6 different timeframes (ex: 1H, 4H, Daily, Weekly, etc.), each with separate color and visibility controls.
Real Liquidity (No Repaint):
Levels are only drawn from fully closed bars on each timeframe—no lines from currently forming candles, ensuring accuracy and no forward-looking bias.
Automatic Detection:
Highs and lows are detected automatically. Levels that get swept (price breaks through) are converted to dashed lines for easy visual distinction.
Customizable:
Choose line colors for highs/lows and set the maximum number of active levels per timeframe to keep charts clean.
Extended Lines:
All levels are extended to the right, helping you see how current price interacts with past liquidity.
How It Works:
On every new bar of your chosen higher timeframe(s), the indicator records the high and low of the previous (just-closed) candle.
These levels are extended as rays until price sweeps (crosses) them.
When a level is swept, it is redrawn as a dashed line to highlight liquidity grabs or stop hunts.
No lines are drawn for the “live” bar—only confirmed, closed levels are displayed.
Who is this for?
SMC, ICT, and price action traders seeking high-confidence liquidity zones.
Intraday, swing, and multi-timeframe traders who want an automated, visual edge.
Anyone wanting to avoid repainting or “fake” levels from unfinished candles.
Tip:
Combine this indicator with your favorite order block, fair value gap (FVG), or market structure tools for even greater context and confluence.
Disclaimer:
No indicator guarantees profits. Always use with proper risk management and in conjunction with your trading plan.

Fusion AI IndicatorWhat is Fusion AI?
The Fusion AI Indicator blends three proven momentum & mean-reversion signals into a single composite “AI Score.” By normalizing and weighting EMA crossovers, RSI bias and MACD momentum, you get one clean line that captures multi-factor strength shifts in real time—plus optional price-chart arrows and built-in alerts.
How it works
Fast vs. Slow EMA (40%)
(EMA(fastLen) – EMA(slowLen)) / EMA(slowLen)
RSI Deviation (30%)
(RSI(rsiLen) – 50) / 50
MACD Momentum (30%)
(MACD.line – MACD.signal) / ATR(14)
AI Score = 0.4 · EMA + 0.3 · RSI + 0.3 · MACD
Thresholds
Buy when AI Score crosses up through +Threshold
Sell when it crosses down through –Threshold
Default Inputs (tuned for balanced signals)
Fast MA Length: 12
Slow MA Length: 26
RSI Length: 14
MACD Fast EMA: 12
MACD Slow EMA: 26
MACD Signal Smoothing: 9
AI Score Threshold: 0.30
Show Overlay Arrows: ✔️
Alert on Bar Close Only: ✔️
(You can lower Threshold toward 0.10–0.20 for more frequent signals in quieter markets.)
Recommended Markets & Timeframes
Bitcoin (BTCUSD) on 1 H, 4 H – captures crypto swings
Ethereum (ETHUSD) on 1 H, 4 H
AAPL, TSLA, SPY on 15 M, 1 H – ideal for intraday setups
How to Add Alerts
Add the indicator to your chart.
Open Create Alert → Condition →
Fusion AI Indicator with Alerts & Overlay → choose Buy Signal or Sell Signal.
Set Frequency to Once per bar close (default) or Once per bar.
Paste a custom message or use the default:
“Fusion AI: Bullish crossover detected”
“Fusion AI: Bearish crossunder detected”
Usage Tips
Combine with volume filters or support/resistance zones for higher-probability entries.
Use the gradient-colored subchart to spot building momentum even before arrows appear.
Back-test threshold levels per asset: volatility will dictate whether 0.30 is too loose or too tight.
Enjoy smoother, multi-factor signals in one indicator—Fusion AI does the math so your eyes can focus on the trade.

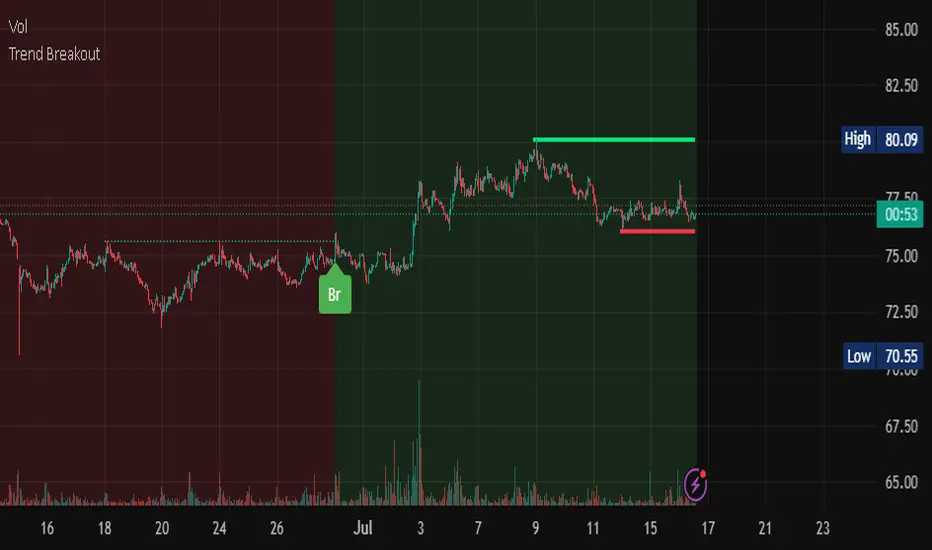
Trend Breakout Description:
This Pine Script indicator identifies pivot high and pivot low points based on user-defined left and right candle legs, detecting breakouts to signal potential trend changes. It plots horizontal lines at pivot highs (lime) and pivot lows (red), marking breakout signals with labels ("Br") when the price crosses above a pivot high or below a pivot low. The indicator also changes the background color to reflect the trend (green for uptrend, red for downtrend) with adjustable transparency. The indicator primarily focuses on recognizing specific pivot patterns to define trends and generate trading signals.
How It Works
• Pivot Detection: Identifies pivot highs and lows using configurable left (Left side Pivot Candle) and right (Right side Pivot Candle) periods.
• Pivot Highs (PH): A pivot high is identified when a candle's high is greater than a specified number of preceding candles (left leg) and succeeding candles (right leg).
• Pivot Lows (PL): Similarly, a pivot low is identified when a candle's low is less than a specified number of preceding and succeeding candles.
The script then tracks the last three pivot highs and pivot lows.
Trend Detection and Breakouts
1. High Line (Resistance): When a middle pivot high (out of the three tracked) is higher than both the previous and the next pivot high, a lime green line is drawn from that pivot high. This line acts as a dynamic resistance level.
2. Low Line (Support): Conversely, when a middle pivot low is lower than both the previous and the next pivot low, a red line is drawn from that pivot low. This line acts as a dynamic support level.
________________________________________
Trading Signals : The indicator generates signals based on price crossing these dynamically drawn lines .
• Long Signal (Uptrend):
o A "Long" signal is triggered when the close price crosses above the current high line (resistance), and the indicator is not already in an uptrend.
o When a long signal occurs, the background turns green, and the high line becomes dotted and thinner. A "Br" (Breakout) label appears below the candle.
• Short Signal (Downtrend):
o A "Short" signal is triggered when the close price crosses below the current low line (support), and the indicator is not already in a downtrend.
o When a short signal occurs, the background turns red, and the low line becomes dotted and thinner. A "Br" (Breakout) label appears above the candle.
________________________________________
Customizable Settings
The indicator provides three user-adjustable inputs:
• Right Side Pivot Candle (fpivotLeg): This setting (default 10) determines the number of candles to the right that must have lower highs/higher lows for a pivot to be confirmed.
• Left Side Pivot Candle (bpivotLeg): This setting (default 15) determines the number of candles to the left that must have lower highs/higher lows for a pivot to be confirmed.
• Adjust Color Visualization (Colortrnp): This setting (default 85) controls the transparency of the background color changes, allowing you to adjust how prominently the green (uptrend) and red (downtrend) backgrounds are displayed.
________________________________________
How to Use It
This indicator can be used by traders to:
• Identify potential reversals: The formation of new pivot highs and lows can signal shifts in market direction.
• Spot breakout opportunities: Crossing above the high line or below the low line can indicate the start of a new trend or the continuation of an existing one.
• Confirm trend strength: The presence and extension of the high and low lines can provide visual cues about the prevailing trend.
• Ideal for swing traders or trend-following strategies.
• Use the breakout labels ("Br") and background color to confirm trend direction.
• Adjust pivot leg inputs to fine-tune sensitivity for different timeframes or assets.
• Customize transparency to suit chart readability.
Example:
On a breakout above a pivot high, a green "Br" label appears, the background turns green, and the pivot line becomes dotted. This signals a potential uptrend, helping traders identify entry points or trend confirmations.
Disclaimer: No indicator guarantees profits. Always use this indicator in conjunction with other analysis methods and proper risk management.
Rally/Drop Market Structure (Multi-Timeframe)Rally/Drop Market Structure
Supply and Demand Zones from Bullish/Bearish Breaks
Overview:
The Rally/Drop Market Structure indicator is a powerful price action tool that identifies key structural turning points in the market by detecting bullish and bearish breaks . After each confirmed break, it plots either a demand zone (following a bullish break or rally) or a supply zone (following a bearish break or drop). These zones represent institutional footprints — areas where price is likely to react due to imbalance or unfilled orders.
The indicator is based on synthetic higher timeframe (HTF) candles to provide a more stable and smoothed structural map, improving clarity and signal quality over raw candles.
How It Works:
- A bullish break is defined when price makes a higher high and a higher low (or closes above the previous high depending on your selected mode).
- A bearish break is defined when price makes a lower high and a lower low (or closes below the previous low).
- After a bullish break, the indicator plots a demand zone based on the low and high of the most recent bearish candle — representing where demand stepped in.
- After a bearish break, the indicator plots a supply zone from the most recent bullish candle — indicating where supply took control.
- Optional mitigation logic marks zones as mitigated (or deletes them) once price trades into the opposing side.
- Internal shift detection highlights swing highs and lows , labels structural points (HH, HL, LH, LL), and identifies potential liquidity sweeps .
Features:
- Dynamic plotting of rally-based demand zones and drop-based supply zones
- Toggle to use Highs/Lows or Close-based breaks for structure
- Support for LTF, MTF, and HTF analysis (with selectable timeframe)
- Zone mitigation logic with optional automatic cleanup
- Labeling of key swing points: HH , HL , LH , LL , and LS (Liquidity Sweep)
- Zigzag visualization for structure flow
- Alert-ready for internal shifts, BoS, and zone creation
- Separate styling options for BoS lines, internal shift shapes, and zone colors
How to Use:
- Set your desired HTF candle source (e.g., 1H or 4H) depending on your trading style.
- Use Highs/Lows mode for pure price action structure or Close mode for more conservative signals.
- Observe when a bullish break occurs — a demand zone will form where price previously dropped before rallying. Look for long opportunities if price revisits this zone.
- After a bearish break , a supply zone forms where the rally failed — use this to scout short entries on retests.
- Use BoS lines to confirm structure shifts and validate entry triggers or trend direction.
- Monitor mitigated zones for reduced reliability or avoid them completely by enabling automatic deletion.
- Use alerts to stay notified about key changes without watching the chart constantly.
Recommended Strategies:
- Smart money or ICT-style trading : identify institutional footprints and mitigation setups
- Reversal trading : catch price rejecting off unmitigated zones after structure break
- Trend continuation : enter in the direction of internal structure after pullbacks into zones
- Liquidity sweep confirmation : filter out false breaks using HH/LL with LS detection
Tips:
- Combine this indicator with a higher timeframe bias tool (e.g., moving average, higher timeframe market structure).
- For scalping, use tighter HTFs and reduce the zone duration.
- For swing trading, use larger HTFs (1H, 4H, Daily) and increase zone persistence.
Summary:
The Rally/Drop Market Structure indicator gives you an actionable framework for understanding price structure, market intent, and supply/demand imbalances. Whether you're looking for precision entries, trend confirmation, or smart money concepts, this tool helps simplify complex price behavior into clean, usable structure and zones.

ARJUN SPECIAL BUY SELLUSE 2 AND 1 ATR LIMITS WAIT FOR 9 EMA CLOSE //@version=5
indicator('Chandelier Exit with One-Time EMA Confirmation', shorttitle='CE+EMA OneShot', overlay=true)
// === INPUTS ===
length = input.int(title='ATR Period', defval=22, group='Calculation')
mult = input.float(title='ATR Multiplier', step=0.1, defval=3.0, group='Calculation')
useClose = input.bool(title='Use Close Price for Extremums', defval=true, group='Calculation')
showLabels = input.bool(title='Show Buy/Sell Labels', defval=true, group='Visuals')
highlightState = input.bool(title='Highlight State', defval=true, group='Visuals')
awaitBarConfirmation = input.bool(title="Await Bar Confirmation", defval=true, group='Alerts')
// === CHANDELIER EXIT LOGIC ===
atr = mult * ta.atr(length)
longStop = (useClose ? ta.highest(close, length) : ta.highest(length)) - atr
longStopPrev = nz(longStop , longStop)
longStop := close > longStopPrev ? math.max(longStop, longStopPrev) : longStop
shortStop = (useClose ? ta.lowest(close, length) : ta.lowest(length)) + atr
shortStopPrev = nz(shortStop , shortStop)
shortStop := close < shortStopPrev ? math.min(shortStop, shortStopPrev) : shortStop
var int dir = 1
dir := close > shortStopPrev ? 1 : close < longStopPrev ? -1 : dir
buySignal = dir == 1 and dir == -1
sellSignal = dir == -1 and dir == 1
// === EMA LOGIC ===
ema9 = ta.ema(close, 9)
plot(ema9, title='EMA 9', color=color.orange, linewidth=1)
// === STATE TRACKING ===
var bool waitingForStrongBuy = false
var bool waitingForStrongSell = false
var bool strongBuyTriggered = false
var bool strongSellTriggered = false
// Set flags on CE signals
if buySignal
waitingForStrongBuy := true
waitingForStrongSell := false
strongBuyTriggered := false
strongSellTriggered := false
if sellSignal
waitingForStrongSell := true
waitingForStrongBuy := false
strongBuyTriggered := false
strongSellTriggered := false
// Trigger strong signals only once
strongBuy = waitingForStrongBuy and not strongBuyTriggered and close > ema9
strongSell = waitingForStrongSell and not strongSellTriggered and close < ema9
if strongBuy
strongBuyTriggered := true
waitingForStrongBuy := false
if strongSell
strongSellTriggered := true
waitingForStrongSell := false
// === PLOTS ===
plot(dir == 1 ? longStop : na, title='Long Stop', style=plot.style_linebr, linewidth=2, color=color.green)
plot(dir == -1 ? shortStop : na, title='Short Stop', style=plot.style_linebr, linewidth=2, color=color.red)
plotshape(buySignal and showLabels, title='Buy Label', text='Buy', location=location.belowbar, style=shape.labelup, color=color.green, textcolor=color.white)
plotshape(sellSignal and showLabels, title='Sell Label', text='Sell', location=location.abovebar, style=shape.labeldown, color=color.red, textcolor=color.white)
plotshape(strongBuy and showLabels, title='Strong Buy', text='Strong Buy', location=location.belowbar, style=shape.labelup, color=color.lime, textcolor=color.black)
plotshape(strongSell and showLabels, title='Strong Sell', text='Strong Sell', location=location.abovebar, style=shape.labeldown, color=color.maroon, textcolor=color.white)
// === ALERTS ===
await = awaitBarConfirmation ? barstate.isconfirmed : true
alertcondition(buySignal and await, title='Alert: CE Buy', message='Chandelier Exit Buy!')
alertcondition(sellSignal and await, title='Alert: CE Sell', message='Chandelier Exit Sell!')
alertcondition(strongBuy and await, title='Alert: Strong Buy', message='Strong Buy: CE + EMA confirmation!')
alertcondition(strongSell and await, title='Alert: Strong Sell', message='Strong Sell: CE + EMA confirmation!')

[Momentum Shift Pro – OBx Breaker Reversal System [markking77] 1. Momentum Shift Pro
> Professional Momentum Indicator blending Order Blocks, Breaker Blocks, and Smart Buy/Sell reversal points. Smooth entry logic designed for accurate trend shifts.
✅ Premium OB Zones
✅ Buy/Sell Signal Clarity
✅ Telegram-ready visuals
Developed by @Markking77

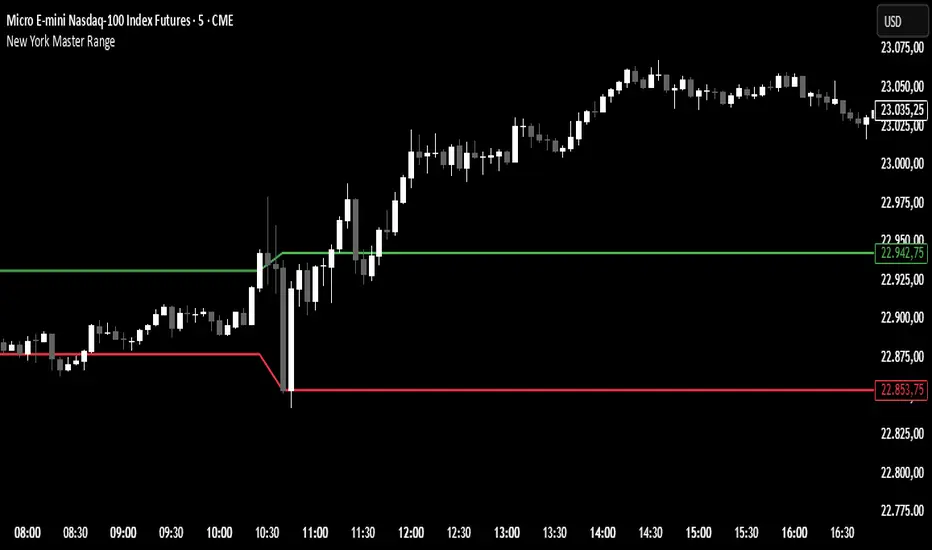
New York Master Range📈 New York Master Range (5-Min Timeframe)
Description:
This custom TradingView indicator captures the opening range based on the body high and low of the first 3 candles after 10:30 AM (BRT – Brasília Time) on the 5-minute timeframe — a technique often used during the New York market session.
🔍 How it works:
At exactly 10:30 AM (BRT), the indicator starts collecting the highs and lows of candle bodies (not wicks) for the next 3 five-minute candles.
Once the 3 candles are processed, the highest close/open (body high) and lowest close/open (body low) are plotted as static green and red lines on the chart.
These levels can act as key intraday support/resistance zones or range breakout triggers.
Reversal IndicatorWhat does this indicator do?
This indicator is designed to help traders spot potential reversal points in the market by combining multiple conditions:
✅ Multi-Timeframe RSI – Checks RSI on a lower timeframe (like 5m) to see if the market is oversold or overbought.
✅ Higher Timeframe SMA Filter – Uses a higher timeframe SMA (like 1h) as a trend filter, so signals only trigger in the direction of the bigger trend.
✅ Candle Pattern Confirmation – Looks for bullish or bearish engulfing candles to confirm price exhaustion before signaling a reversal.
When all these conditions align, the indicator plots a triangle under/above the candle to highlight a possible reversal.
Why is this useful?
Many traders struggle with false RSI signals or candle patterns that fail because they don’t respect the larger trend.
This indicator filters out weak setups by requiring alignment between:
A lower timeframe RSI oversold/overbought condition,
A higher timeframe trend filter (SMA),
And a strong candle reversal pattern.
This multi-layer approach helps avoid chasing every RSI dip and focuses only on high-probability reversal zones.
How does it work?
Bullish reversal signal → appears when RSI on the lower TF is oversold, price is still above the higher TF SMA (trend still intact), AND a bullish engulfing candle forms.
Bearish reversal signal → appears when RSI on the lower TF is overbought, price is below the higher TF SMA, AND a bearish engulfing candle forms.
When all conditions match, the indicator plots a triangle under the candle for bullish signals and above the candle for bearish signals.
How to use it?
Choose your timeframes:
A timeframe for trend filtering (e.g. 1h).
A timeframe for RSI (e.g. 4h).
NOTICE: THE RSI TIMEFRAME SHOULD BE GREATER THEN THE TIMEFRAME FOR THE SMA
Otherwise it will not generate that much signals.
Watch for signals ONLY in the direction of the higher trend.
Use the signals as potential reversal points, not as guaranteed entries. Combine with your own confluence.
Optionally set alerts for bullish or bearish reversal conditions so you never miss a setup.
Customization
✅ Choose your RSI length & overbought/oversold levels.
✅ Select which timeframes you want for SMA & RSI.
✅ Toggle the higher TF SMA display on/off.
✅ Adjust signal appearance (triangles).
Important Notes
⚠️ This is not a standalone trading system. It’s a tool to help spot possible reversal areas. Always confirm with price action, support/resistance, or your own strategy

Fibonacci retracementHi all!
This indicator will show you the most recent Fibonacci retracement in the current trend. So if the trend is bullish the Fibonacci retracement will be drawn from swing low to high and from swing high to low in a bearish trend.
The uniqueness in this script lies in the adaptation to trend. To only plot the Fibonacci retracements according to the current market trend.
The trend is determined through break of structures (BOS) and change of characters (CHoCH). A change of character can be of type change of character plus (with a failed swing) and will then be shown as CHoCH+. This is possible through my library 'MarketStructure' (). It only uses break of structures and change of characters to be able to determine the trend, if you want a more detailed picture of the market structure you can use my script 'Market structure' ().
History and what to look for
Fibonacci retracement levels are used by many traders and are levels that are not Fibonacci sequence numbers themselves but they deriver from them. Some examples are:
23,6% - Divide a number by one three places ahead (e.g. 13/55)
38,2% - Divide a number by the one two places ahead (e.g. 21/55)
50% - Not from the Fibonacci sequence, but it's a number that price has reacted from in the past. Markets tend to retrace half a move before continuing
61,8% - The "golden retracement level". It derives from the "golden ratio" and is a core component of the Fibonacci sequence. The further you go in the Fibonacci sequence the preceding number divided by the current number will get closer and closer to this "golden ratio". This level is considered the most important Fibonacci retracement level by many traders
78,6% - Square root of 61.8%. This is often considered a deep correction (but not a trend reversal) and are often used for late entries
These levels are considered "key" and most significant. You want to look for a retracement of the price (down in a bullish trend and up in a bearish trend) to give you good entries.
Settings
For the trend you can set the pivot/swing lengths (right and left) and use the checkbox if you want these pivots to have labels. This can be done in the 'Market strucure' section.
In the 'Fibonacci retracement' section there is settings for the actual Fibonacci retracement. You can enable the trendline, set the color and the style of it. You can select which levels that should be shown by the indicator. There are 11 levels enabled by default, they are; 0-4.236. All settings in this section tries to be as similar to the "Fib Retracement" tool in Tradingview. You can also select the style of these lines (solid, dashed or dotted) and if you want them to extend to the right or not.
After this you can select if the Fibonacci retracement should be reversed or not, if prices should be displayed, if levels should be displayed and if to show the decimal levels or percentages and lastly the font size of these labels.
All defaults are based on the "Fib Retracement" tool by Tradingview.
Visualization
This indicator aims to be as visually similar to the default ("Fib Retracement") tool here on Tradingview. It will plot the Fibonacci retracement (called Auto Fibonacci/Auto fib) according to the trend from the library 'MarketStrucure'. The big differences from the "Fib Retracement" tool by Tradingview is that it's automatic (that adapts to trend), the market structure is visualized through lines and labels (showing 'BOS' for break of structures and 'CHoCH'/'CHoCH+' for change of characters) and that the labels showing information about the levels are positioned to be highly visible (left if <50% otherwise right if in a bullish trend, vice versa in a bearish trend or if reversed).
Don't hesitate if you have any feedback or nice feature suggestions!
Best of trading luck!

Sylvain Zig-Zag [Mark804]> Overview:
The Sylvain Zig-Zag is a premium trend-tracking and structural turning-point indicator designed to identify precise market reversals, swing points, and support/resistance zones using a dynamic ATR-based Zig-Zag logic.
> Key Features:
Dynamic Zig-Zag Algorithm powered by ATR, percentage moves, absolute and tick-based reversal logic.
Support & Resistance Zones auto-drawn from key swing points for real-time structural mapping.
New Trend & Continuation Icons highlight trend shifts and extended moves with visual clarity.
Customizable Colors & Line Widths to match your chart’s style or branding.
Live Bar Coloring based on bullish or bearish trend structure.
Highly Configurable: Adjust ATR period, reversal %, tick distance, absolute threshold, and more.
> Ideal For:
Swing Traders looking for clean structural highs/lows
Smart Money Concept (SMC) practitioners
Price Action traders
Support/Resistance zone mappers
Those who value premium visuals and minimal clutter
> How It Works: This Zig-Zag engine calculates new swing highs or lows using a hybrid logic combining:
ATR-based price movement filter
Reversal percentage confirmation
Optional absolute price or tick-based padding
It plots each pivot, draws connecting lines, and generates real-time support/resistance levels based on recent pivots.
> Visual Enhancements:
Multi-layer polylines for deep contrast and style
Optional trend labels (e.g., "Up Trend", "Down Trend")
Transparent multi-line S/R stacking
Real-time continuation icons for ongoing strength
> Note:
This indicator is Pine Script v5 compatible and follows TradingView's latest visual architecture. Publishing-ready. Fully customizable

WaveTrend w/ Crosses & MTFWaveTrend Oscillator from LazeBear, modified to plot crosses and amplified delta.

Zone Reversal ProSmart Zones Pro is a multi-functional indicator that identifies key institutional levels using Smart Money Concepts (SMC).
It includes:
🔹 Breaker Blocks – shows strong momentum shift zones
🔹 Order Blocks – highlights potential reversal points
🔹 Overlapping Zones – marks high-confluence areas
🔹 Support/Resistance – auto-detected using pivots
🔹 Buy/Sell Signals – based on moving average crossovers
This tool is ideal for intraday and swing trading.
Clean visuals, optimized zones, and precision-based signals make it a powerful addition to your strategy.
For educational use only. Always test before live trading.
