AI Breakout Bands (Zeiierman)█ Overview
AI Breakout Bands (Zeiierman) is an adaptive trend and breakout detection system that combines Kalman filtering with advanced K-Nearest Neighbor (KNN) smoothing. The result is a smart, self-adjusting band structure that adapts to dynamic market behavior, identifying breakout conditions with precision and visual clarity.
At its core, this indicator estimates price behavior using a two-dimensional Kalman filter (position + velocity), then enhances the smoothing process with a nonlinear, similarity-based KNN filter. This unique blend enables it to handle noisy markets and directional shifts with both speed and stability — providing breakout traders and trend followers a reliable framework to act on.
Whether you're identifying volatility expansions, capturing trend continuations, or spotting early breakout conditions, AI Breakout Bands gives you a mathematically grounded, visually adaptive roadmap of real-time market structure.
█ How It Works
⚪ Kalman Filter Engine
The Kalman filter models price movement as a state system with two components:
Position (price)
Velocity (trend direction)
It recursively updates predictions using real-time price as a noisy observation, balancing responsiveness with smoothness.
Process Noise (Position) controls sensitivity to sudden moves.
Process Noise (Velocity) controls smoothing of directional flow.
Measurement Noise (R) defines how much the filter "trusts" live price data.
This component alone creates a responsive yet stable estimate of the market’s center of gravity.
⚪ Advanced K-Neighbor Smoothing
After the Kalman estimate is computed, the script applies a custom K-Nearest Neighbor (KNN) smoother.
Rather than averaging raw values, this method:
Finds K most similar past Kalman values
Weighs them by similarity (inverse of absolute distance)
Produces a smoother that emphasizes structural similarity
This nonlinear approach gives the indicator an AI feature — reacting fast when needed, yet staying calm in consolidation.
█ How to Use
⚪ Trend Recognition
The line color shifts dynamically based on slope direction and breakout confirmation.
Bullish conditions: price above the mid band with positive slope
Bearish conditions: price below the mid band with negative slope
⚪ Breakout Signals
Price breaking above or below the bands may signal momentum acceleration.
Combine with your own volume or momentum confirmation for stronger entries.
Bands adapt to market noise, helping filter out low-quality whipsaws.
█ Settings
Process Noise (Position): Controls Kalman filter’s sensitivity to price changes.
Process Noise (Velocity): Controls smoothing of directional component.
Measurement Noise (R): Defines how much trust is placed in price data.
K-Neighbor Length: Number of historical Kalman values considered for smoothing.
Slope Calculation Window: Number of bars used to compute trend slope of the smoothed Kalman.
Band Lookback (MAE): Rolling period for average absolute error.
Band Multiplier: Multiplies MAE to determine band width.
-----------------
Disclaimer
The content provided in my scripts, indicators, ideas, algorithms, and systems is for educational and informational purposes only. It does not constitute financial advice, investment recommendations, or a solicitation to buy or sell any financial instruments. I will not accept liability for any loss or damage, including without limitation any loss of profit, which may arise directly or indirectly from the use of or reliance on such information.
All investments involve risk, and the past performance of a security, industry, sector, market, financial product, trading strategy, backtest, or individual's trading does not guarantee future results or returns. Investors are fully responsible for any investment decisions they make. Such decisions should be based solely on an evaluation of their financial circumstances, investment objectives, risk tolerance, and liquidity needs.
Penunjuk dan strategi

Advanced Range Theory - ART📊 Advanced Range Theory (ART): The Institutional Blueprint
Stop drawing lines. Start reading the blueprint of the market. Advanced Range Theory (ART) is not another support and resistance indicator; it is a military-grade market structure engine designed to decode the language of institutional capital. It operates on a single, powerful premise: markets move in phases of consolidation and expansion, and the key to anticipation lies in understanding the complete lifecycle of these phases.
ART provides a living, breathing map of the battlefield, identifying institutional accumulation zones and tracking them with unparalleled precision from their inception as "Pending" ranges to their ultimate classification after a breakout. This is your X-ray into the market's skeletal structure.
🔬 THEORETICAL FRAMEWORK: THE ARCHITECTURE OF PRICE ACTION
ART is built on a multi-layered system of logic that moves beyond static levels. It treats ranges as dynamic entities with a narrative—a beginning, a middle, and an end. The core of the system is the dynamic classification engine, which analyzes not just the range, but the character of the price action that resolves it.
1. The Range Lifecycle: From Accumulation to Classification
This is the revolutionary heart of ART. A range's true identity is only revealed by how it is broken.
Phase 1: PENDING (Yellow): A new range is identified based on a period of price consolidation (a "parent" candle followed by a minimum number of "inside" candles). At this stage, it is a neutral zone of potential energy—an area where institutions are likely building positions. It is a question the market has not yet answered.
Phase 2: MITIGATION & CLASSIFICATION: When price breaks out and reaches a calculated extension level, the range is considered "mitigated." At this exact moment, ART analyzes the breakout's DNA to classify the range's true intent:
TYPE 1 - BREAKOUT (Blue): Characterized by a strong, impulsive move with confirming volume. This is a high-conviction breakout, signaling aggressive institutional participation and the likely start of a new trend. It is a statement of intent.
TYPE 2 - REVERSAL (Orange): Occurs when price attempts to break one way but is aggressively rejected, reversing and breaking out the other side. This signals absorption and a "failed auction," often marking significant market turning points.
TYPE 3 - PIVOT (Green): A more balanced breakout, lacking the explosive momentum of a Type 1. This often represents a resolution after a period of indecision or a pivot within a larger trading range.
2. The Hierarchical Map: Source & S/R Levels
ART doesn't just draw boxes; it builds a genealogical map of market structure.
SOURCE LEVEL (Thick Gold Line): This is the "genesis" point—the most recently mitigated range. It acts as the primary point of origin for the current market swing and serves as a critical level for determining overall bias. Price action above the Source is generally bullish; below is bearish.
S/R LEVELS (Cyan Lines): When a range is mitigated, the price level where it broke becomes a key Support/Resistance zone for the future. ART tracks the two most recent S/R levels, as these often act as powerful magnets or rejection points for price.
3. The Multi-Factor Validation Engine
To eliminate noise and focus only on institutionally significant ranges, every potential range must pass a rigorous quality control check:
Time-Based Consolidation: Requires a minimum number of consecutive inside candles (minInsideCandles), ensuring a true period of balance.
Volatility-Based Significance: The range's size must be greater than a multiple of the Average True Range (minRangeSize), filtering out insignificant micro-consolidations.
Participation Confirmation: The parent candle of the range is checked against average volume to ensure there was meaningful activity during its formation.
⚙️ THE COMMAND CONSOLE: CONFIGURING YOUR ART ENGINE
Every input is designed to give you granular control over the detection engine, allowing you to tune ART to any market or timeframe with precision. Each tooltip in the script provides a deep dive, but here is a summary of the core controls.
🎯 ART Detection Engine
Minimum Inside Candles: The soul of the detection algorithm. It defines the minimum number of bars that must be contained within a single "parent" candle to qualify as a range. Higher values (3-4) find major, significant consolidation zones. Lower values (1-2) are more sensitive and will identify shorter-term accumulation patterns.
Extension Multiplier & Fibonacci Extension: These control the profit target projections. The Extension Multiplier uses a simple measured move (e.g., 1.0 = a 1:1 projection of the range's height). The Fibonacci Extension uses the golden ratio (1.618) for harmonically-derived targets.
Mitigation Method (Cross vs. Close): Determines how a breakout is confirmed. Cross is more responsive, triggering as soon as price touches the extension. Close is more conservative, requiring a full candle to close beyond the level, which helps filter out fake-outs from wicks.
Min Range Size (ATR): A crucial noise filter. It ensures that ART ignores tiny, insignificant ranges by requiring a range's height to be a certain multiple of the current market volatility (ATR).
📊 Display & Visual Configuration
These settings give you full control over the visual interface. You can toggle every single element—from the Webb Scanner to the S/R Levels—to create a clean or a comprehensive view. Choose a color theme that suits your charting environment or define a fully custom palette.
🕸️ Webb Analysis Scanner
This is a unique real-time flow analysis tool. It draws dynamic, animated lines from the current price to recent historical points. This visualization helps reveal hidden "tendrils" of momentum and short-term support/resistance that are not immediately obvious, acting as a "sonar" for immediate price flow.
📊 THE ANALYTICS HUB: YOUR DASHBOARD DECODED
The dashboard provides a real-time, at-a-glance intelligence briefing on the current state of market structure as seen by the ART engine.
RANGE METRICS: This section is a "census" of the market's structure. It tells you the total number of ranges identified, how many are still Pending (awaiting a breakout), how many are Unmitigated (active but not yet broken), and how many have been Mitigated (classified and complete).
TYPE BREAKDOWN: This is a powerful gauge of market character. A high count of Type 1 (Breakout) ranges suggests a strong, trending environment. A rising number of Type 2 (Reversal) ranges can signal market exhaustion and potential trend changes. A dominant Type 3 (Pivot) count indicates a balanced, rotational market.
KEY GUIDE: The Large dashboard includes a full legend, so you never have to guess what a line or color represents. It's your built-in user manual.
🎨 DECODING THE BLUEPRINT: A VISUAL INTERPRETATION GUIDE
Every line and color in ART is designed for instant, intuitive understanding.
The Range Lines:
Yellow Lines: A Pending range. This is an active zone of accumulation. Pay close attention.
Colored Lines (Blue/Orange/Green): An unmitigated, classified range. The color tells you its breakout character.
Dotted Lines: A Mitigated range. Its story has been told. These historical levels can still act as support or resistance.
The Identification Zones: These colored boxes appear at a range's origin point after it has been classified. They are the "birth certificate" of the range, permanently marking its type (Breakout, Reversal, or Pivot) and providing an immediate visual history of market behavior.
The Hierarchical Lines:
Thick Gold Line (Source): The most important line on your chart. It is the anchor for your bias.
Cyan Lines (S/R): High-probability decision points. Expect reactions here.
Purple Dotted Lines (Extensions): Logical, calculated profit targets for breaking ranges.
🔧 THE ARCHITECT'S VISION: THE DEVELOPMENT JOURNEY
ART was born from a deep frustration with the static and subjective nature of traditional market structure analysis. Drawing lines by hand is inconsistent, and most indicators are reactive, only confirming what has already happened. The goal was to create a proactive, objective, and dynamic framework that could think about the market in terms of phases and lifecycles.
The breakthrough came from a simple shift in perspective: a range's true character isn't defined when it forms, but by how it resolves. This led to the development of the "post-breakout classification engine," which waits for the market to show its hand before assigning a definitive type. The Webb Scanner was inspired by the desire to visualize the unseen, to create a tool that could feel the immediate "pull" and "push" of price flow. The result is not just an indicator; it is a new language for interpreting price action, built on a foundation of logic, clarity, and precision.
⚠️ RISK DISCLAIMER & BEST PRACTICES
Advanced Range Theory is a professional-grade analytical tool designed to enhance a trader's decision-making process. It does not provide direct buy or sell signals. The levels and classifications it generates are based on historical price action and mathematical probabilities. All trading involves substantial risk, and past performance is not indicative of future results. Always use this tool in conjunction with a robust risk management plan.
"I fear not the man who has practiced 10,000 kicks once, but I fear the man who has practiced one kick 10,000 times."
— Dskyz, Trade with insight. Trade with anticipation.
— Bruce Lee

Multi Ranges Volume Distribution [LuxAlgo]The Multi Ranges Volume Distribution tool allows traders to see the volume distribution by price for three different timeframes simultaneously. Each distribution can report the total amount of accumulated volume or the accumulated buy/sell volume separately.
Levels are displayed at the top and bottom of each timeframe's range, as well as the POC or level with the most volume.
🔶 USAGE
By default, the tool displays daily, weekly, and monthly volume distributions, highlighting the accumulated volume within each row.
Each distribution shows the volume at each price, as well as three lines: the top and bottom prices, and the price at which the most volume was traded.
The reported accumulated volume can be useful for highlighting which price areas are of the most interest to traders, with the specific timeframe specifying whether this interest is long-term or short-term.
🔹 Timeframes & Rows
Traders can adjust the timeframe and the number of rows for each volume distribution.
This is useful for multi-timeframe analysis of volume at the same price levels, or for obtaining detailed data within the same timeframe.
The chart above shows three volume distributions with the same monthly timeframe but a different number of rows; each is more detailed than the previous one.
🔹 Total vs Buy & Sell Volume
Traders can choose to display either the total volume or the buy and sell volumes.
As we can see on the above chart, the background of each row uses a gradient that is a function of the delta between the buy and sell volumes.
This is useful to determine which areas attract buyers and sellers.
🔶 SETTINGS
Volume Display: Select between total volume and buy and sell volume.
Distance between each box: Adjust the spacing of the volume distributions.
Period A: Select a timeframe and the number of rows.
Period B: Select a timeframe and the number of rows.
Period C: Select a timeframe and the number of rows.

Buy & Sell Arrows with Candle Line [mark804]The TrendZone FVG Suite is a premium trading toolkit that combines three powerful strategies into one clean and professional display. Designed for clarity and precision, this indicator helps traders make confident entries and exits across any market or timeframe.
1. Detects precise Buy & Sell zones using dual Moving Average crossover logic.
2. Multi-timeframe support gives more accurate trend confirmation.
3. Automatically highlights Bullish & Bearish Fair Value Gaps (FVGs).
4. Plots Support and Resistance zones using smart swing logic.
5. Displays clean Buy/Sell arrows with vertical candle lines for clarity.
6. Fully customizable — MA types, timeframes, visibility toggles.
7. Color-coded zones and labels give visual confirmation of structure.
8. Built-in alerts for trend shifts — great for real-time or automation use.

Liquidity Swings [Nix]Liquidity Swings Indicator!
It marks recent swing highs and lows on the chart using lines and labels.
Another great feature is that it tracks whether those swing levels are SWEPT (price crosses them again) and either:
Removes swept levels, or
Fades them to indicate they’ve been taken.
You can customize:
Number of swings shown.
Colors, styles, and visibility of lines/labels.
Whether to show highs, lows, or both.
Useful for liquidity analysis.
Usually when these special swings are swept, you can consider moving stops to BE. This is because there should be enough stop losses at the swing points to liquidate others and give more fuel to your trade direction!

SOL Technical Confluence DashboardHow to Use This Confluence Dashboard
Setup Instructions:
Use the other script published as the 1 of 2 scripts to add to your 4-hour SOL chart.
What You'll See:
1. RSI Panel with Enhancements
Colored RSI line (Green = oversold, Red = overbought)
Divergence detection (triangles mark divergences)
Background color changes on strong signals
2. Confluence Table (Top Right)
Shows real-time status of:
RSI: Current value and signal
MACD: Trend direction
Volume: Spike detection and relative volume
Divergence: Bull/Bear divergence alerts
Confluence Scores: 0-10 scale for bull/bear strength
Overall Signal: STRONG BUY/SELL, BUY/SELL, or WAIT
3. Net Confluence Histogram (Bottom)
Green bars = Bullish confluence
Red bars = Bearish confluence
Height = Strength of signal
How It Works with Elliott Waves:
Scenario 1: Wave 5 Top Detection
Elliott Wave shows Wave 5 approaching 261.8%
Confluence Dashboard shows:
RSI: 78 (overbought) ❌
MACD: Bearish cross ❌
Volume: Declining ❌
Divergence: Bearish ❌
Signal: STRONG SELL 🔴
Scenario 2: Wave 2 Bottom
Elliott Wave shows Wave 2 at 61.8% retracement
Confluence Dashboard shows:
RSI: 28 (oversold) ✅
MACD: Bullish cross ✅
Volume: Spike ✅
Divergence: Bullish ✅
Signal: STRONG BUY 🟢
Confluence Scoring System:
The script uses a weighted scoring system:
Divergences: 3 points (most reliable)
RSI extremes: 2 points
Volume spikes: 2 points
MACD signals: 1.5 points
Price action: 1 point
Signals:
Score ≥ 5 = STRONG signal
Score ≥ 3 = Moderate signal
Score < 3 = WAIT
Pro Tips for Maximum Accuracy:
Best Setups: When Elliott Wave completion aligns with STRONG signals
Avoid: Taking trades when confluence is mixed
Volume Confirmation: Always check if volume supports the move
Divergence Priority: RSI divergence at wave endpoints is highly reliable
Alerts Available:
Strong Bullish Confluence
Strong Bearish Confluence
Bullish Divergence
Bearish Divergence
This gives you a complete technical analysis suite that works seamlessly with your Elliott Wave indicator. The combination significantly improves accuracy by confirming wave counts with momentum, volume, and divergence analysis!

Expansion Triangle [TradingFinder] MegaPhone Broadening🔵 Introduction
The Expanding Triangle, also known as the Broadening Formation, is one of the key technical analysis patterns that clearly reflects growing market volatility, increasing indecision among participants, and the potential for sharp price explosions.
This pattern is typically defined by a sequence of higher highs and lower lows, forming within two diverging trendlines. Unlike traditional triangles that converge to a breakout point, the expanding triangle pattern becomes wider over time, leaving no precise apex for a breakout to occur.
From a price action perspective, the pattern represents a prolonged tug-of-war between buyers and sellers, where neither side has taken control yet. Each aggressive swing opens the door to new opportunities whether it's a trend reversal, range trading, or a momentum breakout. This dual nature makes the pattern highly versatile across market conditions, from exhausted trend ends to volatile consolidation zones.
The custom-built indicator for this pattern uses a combination of smart algorithms and detailed analysis of swing dynamics to automatically detect expanding triangles and highlight low-risk entry points.
Traders can use this tool to capitalize on high-probability setups from shorting near the upper edge of the structure with confirmation, to trading bearish breakouts during trend continuations, or entering long positions near the lower boundary during bullish reversals. The chart examples included in this article demonstrate these three highly practical trading scenarios in live market conditions.
A major advantage of this indicator lies in its structural filtering engine, which analyzes the behavior of each price leg in the triangle. With four adjustable filter levels from Very Aggressive, which highlights all potential patterns, to Very Defensive, which only triggers when price actually touches the triangle's trendlines the indicator ensures that only structurally sound and verified setups appear on the chart, reducing noise and false signals significantly.
Long Setup :
Short Setup :
🔵 How to Use
The pattern typically forms in conditions of heightened uncertainty and volatility, where price swings generate a series of higher highs and lower lows. The expanding triangle consists of three key legs bounded by diverging trendlines. The indicator intelligently analyzes each leg's direction and angle to determine whether a valid pattern is forming.
At the core of the indicator’s logic is its leg filtering system, which controls the quality of the pattern and filters out weak or noisy setups. Four structural filter modes are available to suit different trading styles and risk preferences. In Very Aggressive mode, filters are disabled, and the indicator detects any pattern purely based on the sequence of swing points.
This mode is ideal for traders who want to see everything and apply their own discretion.
In Aggressive mode, the indicator checks whether each new leg extends no more than twice the length of the previous one. If a leg overshoots excessively, the structure is invalidated.
In Defensive mode, the filter enforces a minimum movement requirement each leg must move at least 2% of the previous one. This prevents the formation of shallow, weak patterns that visually resemble triangles but lack substance.
The strictest setting, Very Defensive, combines all previous filters and additionally requires the price to physically touch the triangle’s trendlines before issuing a signal. This ensures that setups only appear when real market interaction with key structural levels has occurred, not based on assumptions or geometry alone. This mode is ideal for traders seeking maximum precision and minimal risk.
🟣 Bullish Setup
A bullish setup within the Expanding Triangle pattern occurs when price revisits the lower support boundary after a series of broad swings typically near the third leg of the formation. This area often represents a shift in momentum, where sellers begin to lose strength and buyers prepare to take control.
Ideally, the setup is accompanied by a bullish reversal candle (e.g. doji, pin bar, or engulfing) near the lower trendline. If the Very Defensive filter is active, the indicator will only issue a signal if price makes a confirmed touch on the trendline and reacts from that level. This significantly improves signal accuracy and filters out premature entries.
After confirmation, traders may choose to enter a long position on the bullish candle or shortly afterward. A logical stop-loss is placed just below the recent swing low within the pattern. The target can be set at or near the upper trendline, or projected using the full height of the triangle added to the breakout point. On higher timeframes, this reversal often marks the beginning of a strong uptrend.
🟣 Bearish Setup
A bearish setup forms when price climbs toward the upper resistance trendline, usually as the third leg completes. This is where buyers often begin to show exhaustion, and sellers step in with strength providing an ideal low-risk entry point for short positions.
As with the bullish setup, if the Candle Confirmation filter is enabled, the indicator will only show a signal when a bearish reversal candle forms at the point of contact. If Defensive or Very Defensive filters are also active, the setup must meet strict criteria of proportionate leg movement and an actual trendline touch to qualify.
Once confirmed, traders can enter on the reversal candle, placing a stop-loss slightly above the recent high. The target can be set at the lower trendline or calculated based on the triangle's full height, projected downward. This setup is particularly useful at the end of weak bullish trends or in volatile market tops.
🔵 Settings
🟣 Logic Settings
Pivot Period : Defines how many bars are analyzed to identify swing highs and lows. Higher values detect larger, slower structures, while lower values respond to faster patterns. The default value of 13 offers a balanced sensitivity.
Pattern Filter :
Very Aggressive : Detects all patterns based on point sequence with no structural checks.
Aggressive : Ensures each leg is no more than 2x the size of the previous one.
Defensive : Requires each leg to be at least 2% the size of the previous leg.
Very Defensive : The strictest level; only confirms patterns when price touches trendlines.
Candle Confirmation : When enabled, the indicator requires a valid confirmation candle (doji, pin bar, engulfing) at the interaction point with the trendline before issuing a signal. This reduces false entries and improves entry precision.
🟣 Alert Settings
Alert : Enables alerts for SSS.
Message Frequency : Determines the frequency of alerts. Options include 'All' (every function call), 'Once Per Bar' (first call within the bar), and 'Once Per Bar Close' (final script execution of the real-time bar). Default is 'Once per Bar'.
Show Alert Time by Time Zone : Configures the time zone for alert messages. Default is 'UTC'.
🔵 Conclusion
The Expanding Triangle pattern, with its wide structure and volatility-driven nature, represents chaos but also opportunity. For traders who can read its behavior, it provides some of the most powerful setups for reversals, breakouts, and range-based trades. While the pattern may seem messy at first glance, it is built on clear logic and when properly detected, it offers high-probability opportunities.
This indicator doesn’t just draw expanding triangles it intelligently evaluates their structural quality, validates price interaction through candle confirmation, and allows the trader to fine-tune the detection logic through adjustable filter levels. Whether you’re a reversal trader looking for a turning point, or a breakout trader hunting momentum, this tool adapts to your strategy.
In volatile or uncertain markets, where fakeouts and sudden shifts are common, this indicator can become a cornerstone of your trading system helping you turn volatility into structured, high-quality opportunities.

MTF FVGs [Fadi x MMT]The MTF FVGs indicator is a powerful tool for identifying and visualizing Fair Value Gaps (FVGs) across multiple timeframes on TradingView. It provides traders with customizable options to display bullish and bearish FVGs, control their appearance, and manage mitigated gaps, making it ideal for price action and imbalance-based trading strategies.
Features
Multi-Timeframe Support : Analyzes FVGs on up to seven timeframes, including an auto-adjusted timeframe and user-defined periods (e.g., 5m, 15m, 1H, 4H, 1D, 1W).
Customizable Display : Toggle visibility of FVG open, close, central equilibrium (C.E.), and connecting lines with adjustable styles (solid, dashed, dotted) and sizes.
Background Fill : Option to fill FVG areas with customizable transparency for better visualization.
Mitigation Settings : Show or hide mitigated FVGs with configurable mitigation criteria (e.g., touched, wick-filled, body-filled) and extend mitigated lines.
Labeling Options : Display labels for timeframes, FVG types (BISI/SIBI), and levels (open, close, C.E.) with customizable colors and sizes.
Proximity Filtering : Hide FVGs outside a specified price range based on daily or monthly ATR for cleaner charts.
Timeframe Filtering : Hide lower or current timeframe FVGs to focus on higher timeframe imbalances.
Performance Optimization : Limits the number of displayed FVGs and supports up to 5000 bars back, 500 lines, labels, and boxes.
Settings
Higher Timeframe (HTF) FVG Settings
Show/Hide : Enable or disable FVGs for each timeframe.
Timeframe Selection : Choose specific timeframes (e.g., 5m, 15m, 1H, 4H, 1D, 1W) or use auto-selection based on the current chart.
Colors : Set bullish (default: green) and bearish (default: red) FVG colors.
Max Count : Limit the number of FVGs displayed per timeframe (default: 5).
Display Settings
Open/Close Lines : Toggle visibility, style (solid, dashed, dotted), and size (1-4) for FVG boundaries.
Central Equilibrium (C.E.) : Show/hide the midpoint line with customizable style, size, and colors (default: white with transparency).
Link Line : Display a connecting line between FVG boundaries with adjustable style and size.
Background Transparency : Enable/disable fill between FVG boundaries with adjustable transparency (50%-98%).
Mitigation Settings
Show Mitigated FVGs : Toggle visibility of mitigated gaps.
Mitigation Type : Choose criteria for mitigation (None, Touched, Wick Filled, Body Filled, Wick Filled Half, Body Filled Half).
Mitigated Colors : Set colors for mitigated bullish and bearish FVGs (default: gray with transparency).
Extend Mitigated Lines : Extend mitigated FVG lines by a specified number of bars (default: 5).
Labeling Settings
Label Display : Toggle labels for FVGs with customizable color, background color, and size (tiny, small, normal, large, huge).
Label Levels : Show labels for open, close, or C.E. levels.
Label Content : Include timeframe, FVG type (BISI/SIBI), or level information in labels.
Advanced Settings
Proximity Filter : Hide FVGs outside a price range based on daily ATR (adjustable factor: 1-10).
Label Combine Factor : Control label visibility to avoid clutter (default: 1.0).
ATR Range : Set the number of candles for ATR calculation (default: 10).
Line Extension : Extend FVG lines by a set number of bars (default: 4) or based on price range conditions.
Timeframe Spacing : Adjust spacing between FVGs from different timeframes (default: 4 bars).
How to Use
Add the indicator to your TradingView chart.
Configure the desired timeframes and settings via the indicator's input menu.
Analyze FVGs to identify potential support/resistance zones or imbalance areas for trading decisions.
Use mitigation settings to track filled gaps and proximity filters to focus on relevant price levels.
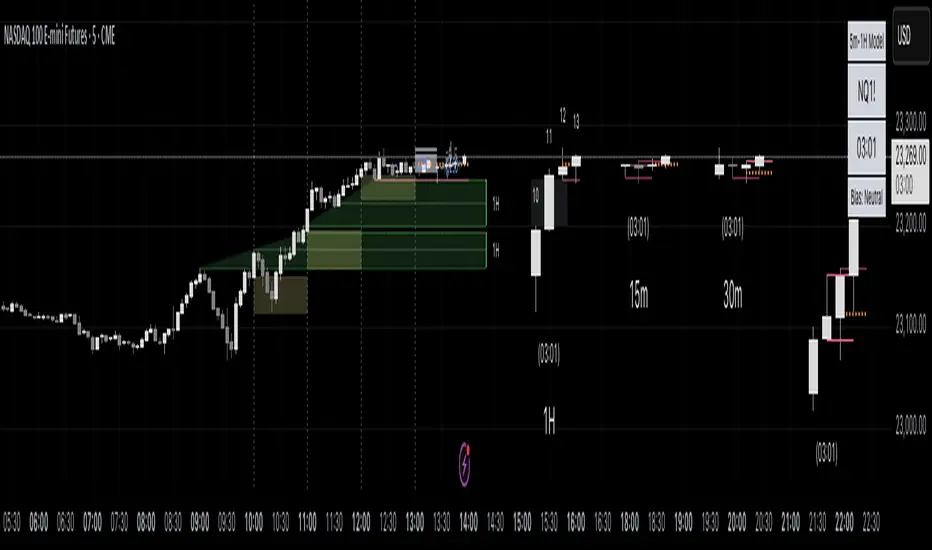
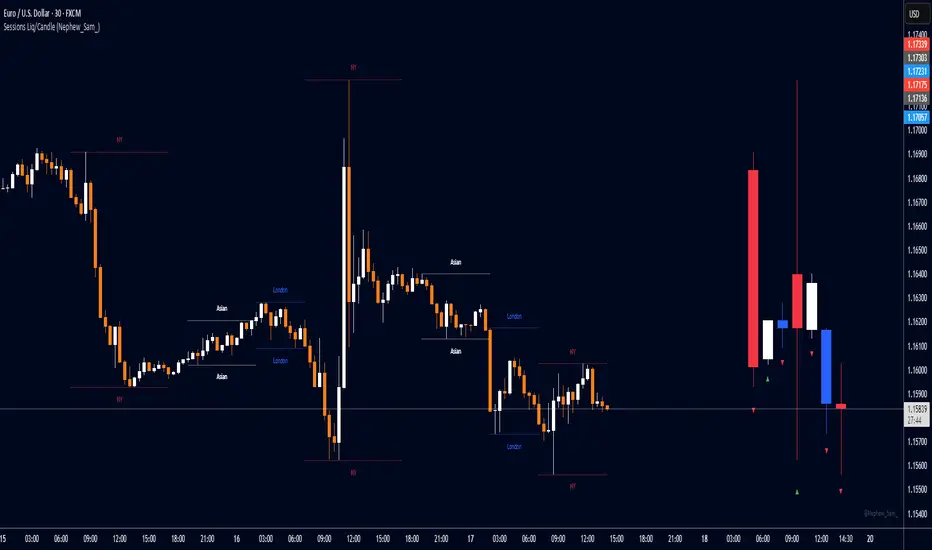
Session HL + Candles + AMD (Nephew_Sam_)Session HL + Candles + AMD (Nephew_Sam_)
This indicator marks out intraday sessions summarized into single candles, with an additional option to mark out the HL of each session. Perfect for understanding AMD within a glance (accumulation-manipulation-distribution)
Features:
Session High/Low lines with customizable colors and labels
Optional session candles displayed on the right side of the chart
Timezone support for global traders
Customizable bull/bear candle colors
Works on timeframes up to 1 hour
Perfect for:
Identifying session liquidity levels
Tracking session ranges and breakouts
Multi-timeframe session analysis
ICT methodology traders
Settings:
Choose your timezone for accurate session detection
Toggle session candles and HL lines independently
Customize colors, line styles, and labels
Set maximum timeframe (up to 1 hour)
Sylvain Zig-Zag [Mark804]> Overview:
The Sylvain Zig-Zag is a premium trend-tracking and structural turning-point indicator designed to identify precise market reversals, swing points, and support/resistance zones using a dynamic ATR-based Zig-Zag logic.
> Key Features:
Dynamic Zig-Zag Algorithm powered by ATR, percentage moves, absolute and tick-based reversal logic.
Support & Resistance Zones auto-drawn from key swing points for real-time structural mapping.
New Trend & Continuation Icons highlight trend shifts and extended moves with visual clarity.
Customizable Colors & Line Widths to match your chart’s style or branding.
Live Bar Coloring based on bullish or bearish trend structure.
Highly Configurable: Adjust ATR period, reversal %, tick distance, absolute threshold, and more.
> Ideal For:
Swing Traders looking for clean structural highs/lows
Smart Money Concept (SMC) practitioners
Price Action traders
Support/Resistance zone mappers
Those who value premium visuals and minimal clutter
> How It Works: This Zig-Zag engine calculates new swing highs or lows using a hybrid logic combining:
ATR-based price movement filter
Reversal percentage confirmation
Optional absolute price or tick-based padding
It plots each pivot, draws connecting lines, and generates real-time support/resistance levels based on recent pivots.
> Visual Enhancements:
Multi-layer polylines for deep contrast and style
Optional trend labels (e.g., "Up Trend", "Down Trend")
Transparent multi-line S/R stacking
Real-time continuation icons for ongoing strength
> Note:
This indicator is Pine Script v5 compatible and follows TradingView's latest visual architecture. Publishing-ready. Fully customizable

TrendZoneTrendZone - Fibonacci Trendline Indicator
TrendZone is a custom Pine Script indicator that automatically draws fibonacci-based trendlines between key pivot points on your chart.
Key Features:
3 Pivot Points: Set start point, major pivot (reversal), and end point
Dual Trendlines: First trendline (Point 1 → 2) and second trendline (Point 2 → 3)
Fibonacci Levels: Automatically draws 25%, 50%, and 100% fibonacci levels for each trendline
Auto Trend Detection: Automatically identifies bullish/bearish trends and adjusts colors accordingly
Customizable: Full control over colors, line styles, and widths for each fibonacci level
How it Works:
The indicator uses your selected pivot points to create two connected trendline systems. Point 2 serves as the major pivot where the first trend ends and the reversal begins. Each trendline system includes fibonacci retracement levels that extend to the right, helping identify potential support/resistance zones.
Use Cases:
Identifying trend reversals at key pivot points
Finding potential support/resistance levels using fibonacci projections
Visualizing market structure changes between different time periods
Planning entries/exits based on fibonacci trendline interactions
Perfect for traders who use fibonacci analysis combined with trend structure to identify high-probability trading zones.

CandelaCharts - HTF Sweeps📝 Overview
This indicator lets you overlay a higher timeframe (HTF) onto your current chart, giving you a clearer view of broader market movements without switching timeframes.
This indicator also detects liquidity sweeps and plots them on both the higher timeframe (HTF) and the current lower timeframe (LTF), helping traders clearly spot potential reversal points. It adds LTF dividers for better structure clarity, making it easier to align with HTF shifts and refine entry timing with greater precision.
📦 Features
This indicator identifies price sweeps and their invalidations, helping traders spot potential liquidity grabs and failed breakout attempts.
Overlay a configurable higher timeframe (HTF) on the current chart
Detects and plots liquidity sweeps on both HTF and LTF
Adds lower timeframe (LTF) dividers for improved structure clarity
Ideal for ICT-style top-down analysis and precision entries without switching charts
⚙️ Settings
Customize the indicator to suit your strategy. Alert options are also available, so you can stay informed when key market events are triggered.
Timeframes: Select the higher timeframe (HTF) to overlay on your current chart.
HTF Coloring: Customize the color scheme for HTF candles.
HTF Offset: Space of HTF Candles and current chart.
HTF Size: Adjust the size of HTF candles.
HTF Labels: Toggle labels for HTF.
LTF H/L Line: Show or hide high/low lines from the lower timeframe.
LTF O/C Line: Display open/close lines from the lower timeframe.
Sweep: Enable detection and plotting of liquidity sweeps.
I-sweep: Toggle invalidated sweep detection.
Alerts: Enable Sweep Formation or Invalidation alerts
⚡️ Showcase
See the indicator applied in live market scenarios, illustrating how sweep detections and invalidations unfold on various charts.
HTF Candles
HTF Sweeps
LTF Sweeps
Invalidated Sweeps
🚨 Alerts
This indicator includes built-in alert functionality to keep you informed of key market events in real time. It supports the following customizable alerts on TradingView:
Sweep Detection: Notifies you when a price sweep is detected—either a liquidity sweep above recent highs or below recent lows. This can be a strong signal of potential reversals or liquidity grabs by larger market participants.
Sweep Invalidation: Alerts you when a previously detected sweep becomes invalidated due to price action moving beyond a defined threshold. This helps traders stay adaptive and avoid acting on outdated signals.
These alerts are fully integrated with TradingView’s native alert system, so you can receive notifications via app, email, or pop-up—ensuring you're always up to date, even when you're away from the chart.
⚠️ Disclaimer
Trading involves significant risk, and many participants may incur losses. The content on this site is not intended as financial advice and should not be interpreted as such. Decisions to buy, sell, hold, or trade securities, commodities, or other financial instruments carry inherent risks and are best made with guidance from qualified financial professionals. Past performance is not indicative of future results.

SOL Elliott Wave 4H with Enhanced ProjectionsThis 4H-optimized version includes:
Key Features for 4H Timeframe:
Optimized Default Settings:
Wave Detection Period: 7 (perfect for 4H)
ZigZag Depth: 3% (captures significant moves on 4H)
Visual Indicators:
Small circles mark pivot points as they form
Blue background on the last bar shows script is active
Clean zigzag lines between pivots
Wave numbers at each pivot
Immediate Feedback:
Pivots show up as soon as they're confirmed
Table shows pivots found count
Current price always visible
To Use This:
Add to your 4H SOL chart
You should immediately see:
Small circles marking recent pivots
The info table in top-right
Blue highlight on the current bar
If you don't see lines yet, try:
Reduce Wave Detection Period to 5
Reduce ZigZag Depth to 2%
Make sure you have at least 100-200 bars of history loaded
Fine-tuning for current market:
If SOL is ranging: Lower ZigZag Depth to 2%
If SOL is trending strongly: Increase to 4-5%
The indicator will start drawing zigzag lines and counting waves as soon as it finds valid alternating highs and lows that meet the minimum percentage move requirement.

TZanalyserTZanalyser (Trend Zone Monitor With Trend Strength, Volume Focus And -Events Markers)
Before I used TrendZones to manage my portfolio I used Fibonacci Zone Oscillator as my favorite in the sub panel, accompanied with another subpanel indicator which I never published called IncliValue and also REVE Cohorts.
TZanalyser inherits Ideas and code from all three of them: The visual and the idea of using a channel as the basis for an oscillator depicted as a histogram, is taken from the FibZone Oscillator. The idea of providing a number to evaluate the trend is taken from IncliValue. The idea to create a horizontal line which indicates high and low volume focus completed with markers for volume events, is taken from REVE-cohorts.
These ideas are combined in one sleek visual called TZanalyser. TZ stand for TrendZones, because the histogram is based on it.
The histogram.
Depicted is the distance of the price from COG as percent. The distance between Upper Curve and Lower Curve is used as 100%. The values may reach between 300 and -300. The colors indicate in which zone the candle lives, blue in the blue zone, green in the green zone etc. Despite the absence of a gray zone, there are gray bars. These depict candles that wrap around COG. Because hl2 is used as price, some gray bars point up and others down. The orange and red bars point down because the orange and red downtrend zones are below COG.
Use of the histogram.
Sometimes I need to create a list of stocks which are in uptrend in monthly, weekly and daily charts from the stocks I follow in my universe. This job is done fast and easy by looking at the last bar of the histogram. The histogram also gives a quick evaluation of how the stock fared in the past.
The number.
Suppose I need to allocate some money to another stock, selected a few, looked into news and gurus and they look equally good. Then it is nice to be able to find out which has the best charts. Which one has the strongest uptrend. For this purpose this number can be consulted, because it indicates somehow the strength of the trend. It is an integer between 20 and -20, the closer to 20 the stronger the uptrend, closer to -20 indicates a stronger downtrend. The color of the background is the same as the last column of the histogram.
Volume focus and events
The horizontal lines depict volume focus, the line below the focus that comes with the uptrend columns pointing up, the one above the focus for the downtrend columns pointing down. Thes line have tree colors: maroon for high volume focus, green for normal volume and gray for low volume situations. Between the lines and the histogram triangles appear at volume events, a green triangle when the candle comes with high volume, i.e. 120-200 percent of normal, maroon when extreme volume, i.e. more than 200 percent of normal.
The direction of these triangles is that of the histogram, i.e. when the price is higher, direction is up and vice versa.
Take care and have fun.

Auto-Calculated Pivot Line/Zone (Based on Time Range)Automatically Calculated Pivot Line/Zone
Harness the power of precision with this Custom Time Range Average Line indicator—designed to pinpoint key equilibrium and pivot levels within consolidation zones after a breakout. Select any start and end time to capture the critical price action shaping the market structure between swings, and calculate the true average price using your choice of open, close, high, low, or midpoint.
Once the defined period concludes, the indicator freezes the average and extends it forward as a clear horizontal ray, acting as a powerful reference for fair value and market balance. This dynamic line shines brightest within consolidation phases, helping traders identify pivot points and equilibrium zones that often serve as magnets for price after a breakout.
Customize the line width to suit your style—use a thinner line width input for a precise single average line, or increase the width to visually represent a broader range or zone. Fully adjustable line color and thickness options ensure this tool integrates seamlessly into any chart setup.
Elevate your trading edge by visualizing the hidden balance points between market swings—turning consolidation chaos into clear, strategic opportunities!

MP MTF FVG/IFVG/BPRMP MTF FVG/IFVG/BPR — Script Description
Overview:
The “MP MTF FVG/IFVG/BPR” indicator is a multi-timeframe (MTF) trading tool that automatically identifies and visualizes three key Smart Money Concepts (SMC) price imbalances:
FVG (Fair Value Gap)
IFVG (Improved/Mitigated Fair Value Gap)
BPR (Balanced Price Range)
The script allows traders to monitor these liquidity zones across multiple custom timeframes (up to 6), helping them spot high-probability trade setups and market structure shifts. Designed for intraday and swing traders, it adapts to any market—forex, stocks, indices, or crypto.
Key Features:
Multi-Timeframe Support:
Select up to 6 different timeframes for simultaneous analysis.
Toggle visibility, set custom max number of imbalances to show per TF, and choose custom colors for each type and timeframe.
FVG Detection:
Automatically marks Fair Value Gaps (price imbalances where rapid moves may leave “inefficiency” between candles), highlighting both bullish and bearish gaps.
IFVG Identification:
Optionally marks mitigated or improved FVGs based on user logic or additional filters, to highlight areas where imbalances have been partially filled.
BPR Highlighting:
Detects and draws Balanced Price Ranges—zones where price efficiently rebalances after filling a previous gap or sweep.
Visualization:
Draws clean colored boxes/lines for each zone, with options for border style, fill opacity, and label display (including timeframe tags).
Option to enable or disable the midline for BPRs.
Performance Optimization:
Limits max active boxes/lines per TF to prevent chart clutter or performance lag.
Works Only On Closed Bars:
The indicator is designed to avoid drawing liquidity zones on unfinished candles, ensuring only valid, confirmed imbalances are shown.
Use Cases:
Identify high-probability entry/exit zones based on institutional trading concepts.
Spot potential reversal, retracement, or continuation areas.
Combine with your own execution model or other SMC tools for more robust strategies.
Parameters:
Enable/disable each timeframe (TF1–TF6)
Custom timeframe selection for each
Max FVGs, IFVGs, BPRs per TF
Custom color for each type/timeframe
Optional BPR midline and color
Notes:
This script is for educational purposes and should be used with risk management.
For best results, combine with additional confirmation signals and trade planning.

LANZ Strategy 5.0🔷 LANZ Strategy 5.0 — Intraday BUY Signals, Dynamic Lot Size per Account, Real-Time Dashboard and Smart Execution
LANZ Strategy 5.0 is a powerful intraday tool designed for traders who need a visual-first, data-backed BUY system, enhanced with risk-aware lot size calculation and a real-time performance dashboard. This indicator intelligently detects strong momentum setups and provides visual and statistical clarity throughout the session.
📌 This is an indicator, not a strategy — It does not place trades automatically but provides precise conditions, alerts, and visual guides to support execution.
🧠 Core Logic & Features
BUY Entry Conditions (Signal Engine)
A BUY signal is triggered when:
The current price is above the EMA200 (trend filter)
The last 3 candles are bullish (candle body close > open)
You are within the defined session window (NY time)
When all conditions are met and you haven’t reached the daily trade limit, a signal appears on the chart and an optional alert is triggered.
Operational Hours Filter (NY Time)
You define:
Start time (e.g., 01:15 NY)
End time (e.g., 16:00 NY)
The system only evaluates and executes signals within this period. If a BUY setup occurs outside the window, it’s ignored. The chart is also highlighted with a transparent teal background to visually show active trading hours.
Lot Size Panel with Per-Account Risk Management
Designed for traders managing multiple accounts or capital sources. You can enable up to 5 accounts, each with:
Its own capital
Its own risk percentage per trade
The system uses the defined SL in pips, plus the instrument’s pip value, to calculate the lot size per account. All values are shown in a dedicated panel at the bottom-right, automatically updating with each new trade.
The emojis (🐣🦊🦁🐲🐳) distinguish each account visually.
Trade Visualization with Customizable Lines
When a signal is triggered:
An Entry Point (EP) line is drawn at the candle’s close.
A Stop Loss (SL) line is placed X pips below the entry.
A Take Profit (TP) line is placed Y pips above the entry.
All three lines are fully customizable in style, color, and thickness. You define how many bars the lines should extend.
Outcome Tracking & Real-Time Dashboard
Each trade outcome is measured:
SL hit = –1.00%
TP hit = +3.00%
Manual close = calculated dynamically based on price at close time
Each result is labeled on the chart near its level, and stored.
The top-right dashboard updates in real time:
✅ Number of trades
📈 Cumulative % gain/loss of the day (color-coded)
Alerts You Can Trust:
You’ll get a Buy Alert when a valid signal is formed
You’ll get a Trade Executed Alert when the visual operation is plotted
You’ll get a SL/TP Hit Alert with price and result
You’ll get a Manual Close Alert if the configured time is reached and the trade is still active
⚙️ Step-by-Step Execution Flow
At every bar, the system checks:
Are we within the session time window?
Is price above EMA?
Are the last 3 candles bullish?
✅ If yes:
A BUY signal is plotted
Entry/SL/TP lines are drawn
Lot sizes are calculated and displayed
Trade is added to the daily count
🕐 At the configured Manual Close time (e.g., 16:00 NY):
If the trade is still open, it's closed
A label is added with the exact result in %
💡 Ideal For:
Intraday traders who operate within fixed time sessions
Traders managing multiple accounts or capital pools
Anyone who wants full visual clarity of every decision point
Traders who appreciate dynamic lot size calculation and clean execution tracking
👨💻 Credits:
💡 Developed by: LANZ
🧠 Strategy concept & execution model: LANZ
🧪 Tested on: 1H charts with visual-only execution
📈 Designed for: Clarity, adaptability, and full intraday control


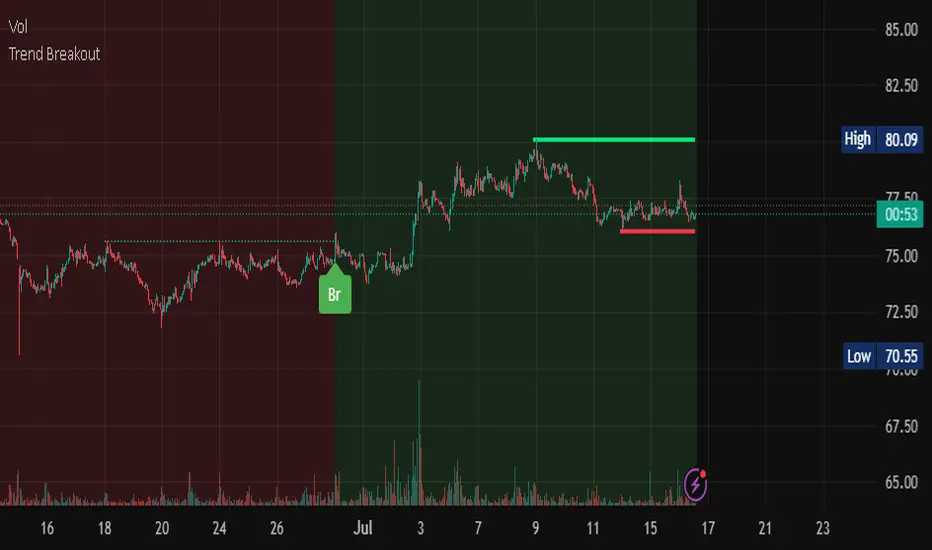
Trend Breakout Description:
This Pine Script indicator identifies pivot high and pivot low points based on user-defined left and right candle legs, detecting breakouts to signal potential trend changes. It plots horizontal lines at pivot highs (lime) and pivot lows (red), marking breakout signals with labels ("Br") when the price crosses above a pivot high or below a pivot low. The indicator also changes the background color to reflect the trend (green for uptrend, red for downtrend) with adjustable transparency. The indicator primarily focuses on recognizing specific pivot patterns to define trends and generate trading signals.
How It Works
• Pivot Detection: Identifies pivot highs and lows using configurable left (Left side Pivot Candle) and right (Right side Pivot Candle) periods.
• Pivot Highs (PH): A pivot high is identified when a candle's high is greater than a specified number of preceding candles (left leg) and succeeding candles (right leg).
• Pivot Lows (PL): Similarly, a pivot low is identified when a candle's low is less than a specified number of preceding and succeeding candles.
The script then tracks the last three pivot highs and pivot lows.
Trend Detection and Breakouts
1. High Line (Resistance): When a middle pivot high (out of the three tracked) is higher than both the previous and the next pivot high, a lime green line is drawn from that pivot high. This line acts as a dynamic resistance level.
2. Low Line (Support): Conversely, when a middle pivot low is lower than both the previous and the next pivot low, a red line is drawn from that pivot low. This line acts as a dynamic support level.
________________________________________
Trading Signals : The indicator generates signals based on price crossing these dynamically drawn lines .
• Long Signal (Uptrend):
o A "Long" signal is triggered when the close price crosses above the current high line (resistance), and the indicator is not already in an uptrend.
o When a long signal occurs, the background turns green, and the high line becomes dotted and thinner. A "Br" (Breakout) label appears below the candle.
• Short Signal (Downtrend):
o A "Short" signal is triggered when the close price crosses below the current low line (support), and the indicator is not already in a downtrend.
o When a short signal occurs, the background turns red, and the low line becomes dotted and thinner. A "Br" (Breakout) label appears above the candle.
________________________________________
Customizable Settings
The indicator provides three user-adjustable inputs:
• Right Side Pivot Candle (fpivotLeg): This setting (default 10) determines the number of candles to the right that must have lower highs/higher lows for a pivot to be confirmed.
• Left Side Pivot Candle (bpivotLeg): This setting (default 15) determines the number of candles to the left that must have lower highs/higher lows for a pivot to be confirmed.
• Adjust Color Visualization (Colortrnp): This setting (default 85) controls the transparency of the background color changes, allowing you to adjust how prominently the green (uptrend) and red (downtrend) backgrounds are displayed.
________________________________________
How to Use It
This indicator can be used by traders to:
• Identify potential reversals: The formation of new pivot highs and lows can signal shifts in market direction.
• Spot breakout opportunities: Crossing above the high line or below the low line can indicate the start of a new trend or the continuation of an existing one.
• Confirm trend strength: The presence and extension of the high and low lines can provide visual cues about the prevailing trend.
• Ideal for swing traders or trend-following strategies.
• Use the breakout labels ("Br") and background color to confirm trend direction.
• Adjust pivot leg inputs to fine-tune sensitivity for different timeframes or assets.
• Customize transparency to suit chart readability.
Example:
On a breakout above a pivot high, a green "Br" label appears, the background turns green, and the pivot line becomes dotted. This signals a potential uptrend, helping traders identify entry points or trend confirmations.
Disclaimer: No indicator guarantees profits. Always use this indicator in conjunction with other analysis methods and proper risk management.
N-Pattern Detector (Advanced Logic)Introduction
The N-Pattern Detector (Advanced Logic) is a powerful Pine Script-based tool designed to identify a specific price structure known as the "N-pattern", which often indicates trend continuation or potential breakout points in the market. This pattern combines zigzag pivot logic, retracement filters, volume confirmation, and trend alignment, offering high-probability trading signals.
It is ideal for traders who want to automate pattern detection while applying smart filters to reduce false signals in various markets — including stocks, forex, crypto, and indices.
What is the N-Pattern?
The N-pattern is a 3-leg price formation consisting of points A-B-C-D. It typically follows this structure:
Bullish N-Pattern:
A → Low Pivot
B → Higher High (Impulse)
C → Higher Low (Retracement)
D → Breakout above B (Confirmation)
Bearish N-Pattern:
A → High Pivot
B → Lower Low (Impulse)
C → Lower High (Retracement)
D → Breakdown below B (Confirmation)
The pattern essentially reflects a trend–pullback–breakout structure, making it suitable for continuation trades.
Key Features
1. Intelligent ZigZag Pivot Detection
Uses pivot highs/lows to define key swing points (A, B, C).
Adjustable ZigZag depth to control pattern sensitivity.
Filters noise and avoids false signals in volatile markets.
2. Retracement Validation
Validates the B→C leg as a proper pullback using Fibonacci-based thresholds.
User-defined min and max retracement settings (e.g., 38.2% to 78.6% of A→B leg).
3. Trend Filter via EMA
Filters patterns based on trend direction using a customizable EMA (e.g., 200 EMA).
Only detects bullish patterns above EMA and bearish patterns below EMA (optional).
4. Volume Confirmation
Ensures that impulse legs (A→B, C→D) are supported by stronger volume than the correction leg (B→C).
Adds another layer of confirmation and reliability to detected patterns.
5. Target Projections
Automatically draws 100% A→B projected target from point C.
Optional Fibonacci extensions at 1.272 and 1.618 levels for take-profit planning.
Visually plotted on the chart with colored dashed/dotted lines.
6. Clear Visuals & Labels
Connects all pattern points with colored lines.
Clearly labels points A, B, C, D on the chart.
Uses customizable colors for bullish and bearish patterns.
Includes real-time alerts when a valid pattern is detected.
How to Use It
Add to Chart
Apply the indicator to any chart and time frame. It works across all asset classes.
Adjust Inputs (Optional)
Set ZigZag Depth to control pivot detection sensitivity.
Define Min/Max Retracement levels to match your trading style.
Enable or disable Trend and Volume filters for cleaner signals.
Customize EMA length (default: 200) for trend validation.
Wait for Pattern Confirmation
The indicator constantly scans for valid N-patterns.
A pattern is confirmed only after point D forms (breakout or breakdown).
You’ll see the full pattern drawn with target levels.
Set Alerts
Alerts trigger automatically on confirmation of a bullish or bearish pattern.
You can customize these in TradingView’s alerts panel.

market rsi vs chart rsi🔍 Key Features:
- Aggregate RSI Sentiment: Measures average momentum across major crypto assets including BTC, ETH, SOL, and others.
- Custom Weighting Options: Choose between equal weighting, volume-based, or market cap-based influence.
- Dual RSI Display:
- Chart RSI: Line plot with color-coded overbought/oversold zones.
- Market RSI: Circular markers for added clarity.
- Dynamic Background Alerts: Highlights periods of collective bullish or bearish pressure.
🎯 Use Cases:
- Spot market-wide divergences.
- Detect chart-specific outliers in momentum.
- Improve decision-making for entries and exits by overlaying local RSI against macro signals.
Not financial advice. Only for crypto trading.

Ultra BUY SELL//@version=5
indicator("Ultra BUY SELL", overlay = false)
// Inputs
src = input(close, "Source", group = "Main settings")
p = input.int(180, "Trend period", group = "Main settings", tooltip = "Changes STRONG signals' sensitivity.", minval = 1)
atr_p = input.int(155, "ATR Period", group = "Main settings", minval = 1)
mult = input.float(2.1, "ATR Multiplier", step = 0.1, group = "Main settings", tooltip = "Changes sensitivity: higher period = higher sensitivty.")
mode = input.string("Type A", "Signal mode", options = , group = "Mode")
use_ema_smoother = input.string("No", "Smooth source with EMA?", options = , group = "Source")
src_ema_period = input(3, "EMA Smoother period", group = "Source")
color_bars = input(true, "Color bars?", group = "Addons")
signals_view = input.string("All", "Signals to show", options = , group = "Signal's Addon")
signals_shape = input.string("Labels", "Signal's shape", options = , group = "Signal's Addon")
buy_col = input(color.rgb(0, 255, 8), "Buy colour", group = "Signal's Addon", inline = "BS")
sell_col = input(color.rgb(255, 0, 0), "Sell colour", group = "Signal's Addon", inline = "BS")
// Calculations
src := use_ema_smoother == "Yes" ? ta.ema(src, src_ema_period) : src
// Source;
h = ta.highest(src, p)
// Highest of src p-bars back;
l = ta.lowest(src, p)
// Lowest of src p-bars back.
d = h - l
ls = ""
// Tracker of last signal
m = (h + l) / 2
// Initial trend line;
m := bar_index > p ? m : m
atr = ta.atr(atr_p)
// ATR;
epsilon = mult * atr
// Epsilon is a mathematical variable used in many different theorems in order to simplify work with mathematical object. Here it used as sensitivity measure.
change_up = (mode == "Type B" ? ta.cross(src, m + epsilon) : ta.crossover(src, m + epsilon)) or src > m + epsilon
// If price breaks trend line + epsilon (so called higher band), then it is time to update the value of a trend line;
change_down = (mode == "Type B" ? ta.cross(src, m - epsilon) : ta.crossunder(src, m - epsilon)) or src < m - epsilon
// If price breaks trend line - epsilon (so called higher band), then it is time to update the value of a trend line.
sb = open < l + d / 8 and open >= l
ss = open > h - d / 8 and open <= h
strong_buy = sb or sb or sb or sb or sb
strong_sell = ss or ss or ss or ss or ss
m := (change_up or change_down) and m != m ? m : change_up ? m + epsilon : change_down ? m - epsilon : nz(m , m)
// Updating the trend line.
ls := change_up ? "B" : change_down ? "S" : ls
// Last signal. Helps avoid multiple labels in a row with the same signal;
colour = ls == "B" ? buy_col : sell_col
// Colour of the trend line.
buy_shape = signals_shape == "Labels" ? shape.labelup : shape.triangleup
sell_shape = signals_shape == "Labels" ? shape.labeldown : shape.triangledown
// Plottings
// Signals with label shape
plotshape(signals_shape == "Labels" and (signals_view == "All" or signals_view == "Buy/Sell") and change_up and ls != "B" and not strong_buy, "Buy signal" , color = colour, style = buy_shape , location = location.belowbar, size = size.normal, text = "BUY", textcolor = color.white, force_overlay=true)
// Plotting the BUY signal;
plotshape(signals_shape == "Labels" and (signals_view == "All" or signals_view == "Buy/Sell") and change_down and ls != "S" and not strong_sell, "Sell signal" , color = colour, style = sell_shape, size = size.normal, text = "SELL", textcolor = color.white, force_overlay=true)
// Plotting the SELL signal.
plotshape(signals_shape == "Labels" and (signals_view == "All" or signals_view == "Strong") and change_up and ls != "B" and strong_buy, "Strong Buy signal" , color = colour, style = buy_shape , location = location.belowbar, size = size.normal, text = "STRONG", textcolor = color.white, force_overlay=true)
// Plotting the STRONG BUY signal;
plotshape(signals_shape == "Labels" and (signals_view == "All" or signals_view == "Strong") and change_down and ls != "S" and strong_sell, "Strong Sell signal" , color = colour, style = sell_shape, size = size.normal, text = "STRONG", textcolor = color.white, force_overlay=true)
// Plotting the STRONG SELL signal.
// Signal with arrow shape
plotshape(signals_shape == "Arrows" and (signals_view == "All" or signals_view == "Buy/Sell") and change_up and ls != "B" and not strong_buy, "Buy signal" , color = colour, style = buy_shape , location = location.belowbar, size = size.tiny, force_overlay=true)
// Plotting the BUY signal;
plotshape(signals_shape == "Arrows" and (signals_view == "All" or signals_view == "Buy/Sell") and change_down and ls != "S" and not strong_sell, "Sell signal" , color = colour, style = sell_shape, size = size.tiny, force_overlay=true)
// Plotting the SELL signal.
plotshape(signals_shape == "Arrows" and (signals_view == "All" or signals_view == "Strong") and change_up and ls != "B" and strong_buy, "Strong Buy signal" , color = colour, style = buy_shape , location = location.belowbar, size = size.tiny, force_overlay=true)
// Plotting the STRONG BUY signal;
plotshape(signals_shape == "Arrows" and (signals_view == "All" or signals_view == "Strong") and change_down and ls != "S" and strong_sell, "Strong Sell signal" , color = colour, style = sell_shape, size = size.tiny, force_overlay=true)
// Plotting the STRONG SELL signal.
barcolor(color_bars ? colour : na)
// Bar coloring
// Alerts
matype = input.string(title='MA Type', defval='EMA', options= )
ma_len1 = input(title='Short EMA1 Length', defval=5)
ma_len2 = input(title='Long EMA1 Length', defval=7)
ma_len3 = input(title='Short EMA2 Length', defval=5)
ma_len4 = input(title='Long EMA2 Length', defval=34)
ma_len5 = input(title='Short EMA3 Length', defval=98)
ma_len6 = input(title='Long EMA3 Length', defval=45)
ma_len7 = input(title='Short EMA4 Length', defval=7)
ma_len8 = input(title='Long EMA4 Length', defval=11)
ma_len9 = input(title='Short EMA5 Length', defval=11)
ma_len10 = input(title='Long EMA5 Length', defval=15)
ma_offset = input(title='Offset', defval=0)
//res = input(title="Resolution", type=resolution, defval="240")
f_ma(malen) =>
float result = 0
if matype == 'EMA'
result := ta.ema(src, malen)
result
if matype == 'SMA'
result := ta.sma(src, malen)
result
result
htf_ma1 = f_ma(ma_len1)
htf_ma2 = f_ma(ma_len2)
htf_ma3 = f_ma(ma_len3)
htf_ma4 = f_ma(ma_len4)
htf_ma5 = f_ma(ma_len5)
htf_ma6 = f_ma(ma_len6)
htf_ma7 = f_ma(ma_len7)
htf_ma8 = f_ma(ma_len8)
htf_ma9 = f_ma(ma_len9)
htf_ma10 = f_ma(ma_len10)
//plot(out1, color=green, offset=ma_offset)
//plot(out2, color=red, offset=ma_offset)
//lengthshort = input(8, minval = 1, title = "Short EMA Length")
//lengthlong = input(200, minval = 2, title = "Long EMA Length")
//emacloudleading = input(50, minval = 0, title = "Leading Period For EMA Cloud")
//src = input(hl2, title = "Source")
showlong = input(false, title='Show Long Alerts')
showshort = input(false, title='Show Short Alerts')
showLine = input(false, title='Display EMA Line')
ema1 = input(true, title='Show EMA Cloud-1')
ema2 = input(true, title='Show EMA Cloud-2')
ema3 = input(true, title='Show EMA Cloud-3')
ema4 = input(true, title='Show EMA Cloud-4')
ema5 = input(true, title='Show EMA Cloud-5')
emacloudleading = input.int(0, minval=0, title='Leading Period For EMA Cloud')
mashort1 = htf_ma1
malong1 = htf_ma2
mashort2 = htf_ma3
malong2 = htf_ma4
mashort3 = htf_ma5
malong3 = htf_ma6
mashort4 = htf_ma7
malong4 = htf_ma8
mashort5 = htf_ma9
malong5 = htf_ma10
cloudcolour1 = mashort1 >= malong1 ? color.rgb(0, 255, 0) : color.rgb(255, 0, 0)
cloudcolour2 = mashort2 >= malong2 ? #4caf4f47 : #ff110047
cloudcolour4 = mashort4 >= malong4 ? #4caf4f52 : #f2364652
cloudcolour5 = mashort5 >= malong5 ? #33ff0026 : #ff000026
//03abc1
mashortcolor1 = mashort1 >= mashort1 ? color.olive : color.maroon
mashortcolor2 = mashort2 >= mashort2 ? color.olive : color.maroon
mashortcolor3 = mashort3 >= mashort3 ? color.olive : color.maroon
mashortcolor4 = mashort4 >= mashort4 ? color.olive : color.maroon
mashortcolor5 = mashort5 >= mashort5 ? color.olive : color.maroon
mashortline1 = plot(ema1 ? mashort1 : na, color=showLine ? mashortcolor1 : na, linewidth=1, offset=emacloudleading, title='Short Leading EMA1', force_overlay=true)
mashortline2 = plot(ema2 ? mashort2 : na, color=showLine ? mashortcolor2 : na, linewidth=1, offset=emacloudleading, title='Short Leading EMA2', force_overlay=true)
mashortline3 = plot(ema3 ? mashort3 : na, color=showLine ? mashortcolor3 : na, linewidth=1, offset=emacloudleading, title='Short Leading EMA3', force_overlay=true)
mashortline4 = plot(ema4 ? mashort4 : na, color=showLine ? mashortcolor4 : na, linewidth=1, offset=emacloudleading, title='Short Leading EMA4', force_overlay=true)
mashortline5 = plot(ema5 ? mashort5 : na, color=showLine ? mashortcolor5 : na, linewidth=1, offset=emacloudleading, title='Short Leading EMA5', force_overlay=true)
malongcolor1 = malong1 >= malong1 ? color.green : color.red
malongcolor2 = malong2 >= malong2 ? color.green : color.red
malongcolor3 = malong3 >= malong3 ? color.green : color.red
malongcolor4 = malong4 >= malong4 ? color.green : color.red
malongcolor5 = malong5 >= malong5 ? color.green : color.red
malongline1 = plot(ema1 ? malong1 : na, color=showLine ? malongcolor1 : na, linewidth=3, offset=emacloudleading, title='Long Leading EMA1', force_overlay=true)
malongline2 = plot(ema2 ? malong2 : na, color=showLine ? malongcolor2 : na, linewidth=3, offset=emacloudleading, title='Long Leading EMA2', force_overlay=true)
malongline3 = plot(ema3 ? malong3 : na, color=showLine ? malongcolor3 : na, linewidth=3, offset=emacloudleading, title='Long Leading EMA3', force_overlay=true)
malongline4 = plot(ema4 ? malong4 : na, color=showLine ? malongcolor4 : na, linewidth=3, offset=emacloudleading, title='Long Leading EMA4', force_overlay=true)
malongline5 = plot(ema5 ? malong5 : na, color=showLine ? malongcolor5 : na, linewidth=3, offset=emacloudleading, title='Long Leading EMA5', force_overlay=true)
fill(mashortline1, malongline1, color=cloudcolour1, title='MA Cloud1', transp=45)
fill(mashortline2, malongline2, color=cloudcolour2, title='MA Cloud2', transp=65)
fill(mashortline4, malongline4, color=cloudcolour4, title='MA Cloud4', transp=65)
fill(mashortline5, malongline5, color=cloudcolour5, title='MA Cloud5', transp=65)
leftBars = input(15, title='Left Bars ')
rightBars = input(15, title='Right Bars')
volumeThresh = input(20, title='Volume Threshold')
//
highUsePivot = fixnan(ta.pivothigh(leftBars, rightBars) )
lowUsePivot = fixnan(ta.pivotlow(leftBars, rightBars) )
r1 = plot(highUsePivot, color=ta.change(highUsePivot) ? na : #FF0000, linewidth=3, offset=-(rightBars + 1), title='Resistance', force_overlay=true)
s1 = plot(lowUsePivot, color=ta.change(lowUsePivot) ? na : #00ff0d, linewidth=3, offset=-(rightBars + 1), title='Support', force_overlay=true)
//Volume %
short = ta.ema(volume, 5)
long = ta.ema(volume, 10)
osc = 100 * (short - long) / long
//For bull / bear wicks
// This Pine Script™ code is subject to the terms of the Mozilla Public License 2.0 at mozilla.org
// © divudivu600
// Developer By ALCON ALGO
//telegram : @harmonicryptosignals
//@version = 5
//indicator(shorttitle='Oscillator Vision', title='Alcon Oscillator Vision', overlay=false)
n1 = input(10, 'Channel length')
n2 = input(21, 'Average length')
reaction_wt = input.int(defval=1, title='Reaction in change of direction', minval=1)
nsc = input.float(53, 'Levels About Buys', minval=0.0)
nsv = input.float(-53, 'Levels About Sells', maxval=-0.0)
Buy_sales = input(true, title='Only Smart Buy Reversal')
Sell_sales = input(true, title='Only Smart Sell Reversal')
Histogram = input(true, title='Show Histogarm')
//Trendx = input(false, title='Show Trendx')
barras = input(true, title='Divergence on chart(Bars)')
divregbull = input(true, title='Regular Divergence Bullish')
divregbear = input(true, title='Regular Divergence Bearish')
divhidbull = input(true, title='Show Divergence Hidden Bullish')
divhidbear = input(true, title='Show Divergence Hidden Bearish')
Tags = input(true, title='Show Divergence Lable')
amme = input(false, title='Activar media movil Extra para WT')
White = #FDFEFE
Black = #000000
Bearish = #e91e62
Bullish = #18e0ff
Strong_Bullish = #2962ff
Bullish2 = #00bedc
Blue1 = #00D4FF
Blue2 = #009BBA
orange = #FF8B00
yellow = #FFFB00
LEZ = #0066FF
purp = #FF33CC
// Colouring
tf(_res, _exp, gaps_on) =>
gaps_on == 0 ? request.security(syminfo.tickerid, _res, _exp) : gaps_on == true ? request.security(syminfo.tickerid, _res, _exp, barmerge.gaps_on, barmerge.lookahead_off) : request.security(syminfo.tickerid, _res, _exp, barmerge.gaps_off, barmerge.lookahead_off)
ha_htf = ''
show_ha = input.bool(true, "Show HA Plot/ Market Bias", group="HA Market Bias")
ha_len = input(7, 'Period', group="HA Market Bias")
ha_len2 = input(10, 'Smoothing', group="HA Market Bias")
// Calculations {
o = ta.ema(open, ha_len)
c = ta.ema(close, ha_len)
h1 = ta.ema(high, ha_len)
l1 = ta.ema(low, ha_len)
haclose = tf(ha_htf, (o + h1 + l1 + c) / 4, 0)
xhaopen = tf(ha_htf, (o + c) / 2, 0)
haopen = na(xhaopen ) ? (o + c) / 2 : (xhaopen + haclose ) / 2
hahigh = math.max(h1, math.max(haopen, haclose))
halow = math.min(l1, math.min(haopen, haclose))
o2 = tf(ha_htf, ta.ema(haopen, ha_len2), 0)
c2 = tf(ha_htf, ta.ema(haclose, ha_len2), 0)
h2 = tf(ha_htf, ta.ema(hahigh, ha_len2), 0)
l2 = tf(ha_htf, ta.ema(halow, ha_len2), 0)
ha_avg = (h2 + l2) / 2
// }
osc_len = 8
osc_bias = 100 *(c2 - o2)
osc_smooth = ta.ema(osc_bias, osc_len)
sigcolor =
(osc_bias > 0) and (osc_bias >= osc_smooth) ? color.new(Bullish, 35) :
(osc_bias > 0) and (osc_bias < osc_smooth) ? color.new(Bullish2, 75) :
(osc_bias < 0) and (osc_bias <= osc_smooth) ? color.new(Bearish, 35) :
(osc_bias < 0) and (osc_bias > osc_smooth) ? color.new(Bearish, 75) :
na
// }
nsc1 = nsc
nsc2 = nsc + 5
nsc3 = nsc + 10
nsc4 = nsc + 15
nsc5 = nsc + 20
nsc6 = nsc + 25
nsc7 = nsc + 30
nsc8 = nsc + 35
nsv1 = nsv - 5
nsv2 = nsv - 10
nsv3 = nsv - 15
nsv4 = nsv - 20
nsv5 = nsv - 25
nsv6 = nsv - 30
nsv7 = nsv - 35
nsv8 = nsv - 40
ap = hlc3
esa = ta.ema(ap, n1)
di = ta.ema(math.abs(ap - esa), n1)
ci = (ap - esa) / (0.015 * di)
tci = ta.ema(ci, n2)
wt1 = tci
wt2 = ta.sma(wt1, 4)
direction = 0
direction := ta.rising(wt1, reaction_wt) ? 1 : ta.falling(wt1, reaction_wt) ? -1 : nz(direction )
Change_of_direction = ta.change(direction, 1)
pcol = direction > 0 ? Strong_Bullish : direction < 0 ? Bearish : na
obLevel1 = input(60, 'Over Bought Level 1')
obLevel2 = input(53, 'Over Bought Level 2')
osLevel1 = input(-60, 'Over Sold Level 1')
osLevel2 = input(-53, 'Over Sold Level 2')
rsi = ta.rsi(close,14)
color greengrad = color.from_gradient(rsi, 10, 90, #00ddff, #007d91)
color redgrad = color.from_gradient(rsi, 10, 90, #8b002e, #e91e62)
ob1 = plot(obLevel1, color=#e91e6301)
os1 = plot(osLevel1, color=#00dbff01)
ob2 = plot(obLevel2, color=#e91e6301)
os2 = plot(osLevel2, color=#00dbff01)
p1 = plot(wt1, color=#00dbff01)
p2 = plot(wt2, color=#e91e6301)
plot(wt1 - wt2, color=wt2 - wt1 > 0 ? redgrad : greengrad, style=plot.style_columns)
// fill(p1,p2,color = wt2 - wt1 > 0 ? redgrad: greengrad) // old
fill(p1,p2,color = sigcolor)
// new
fill(ob1,ob2,color = #e91e6350)
fill(os1,os2,color = #00dbff50)
midpoint = (nsc + nsv) / 2
ploff = (nsc - midpoint) / 8
BullSale = ta.crossunder(wt1, wt2) and wt1 >= nsc and Buy_sales == true
BearSale = ta.crossunder(wt1, wt2) and Buy_sales == false
Bullishh = ta.crossover(wt1, wt2) and wt1 <= nsv and Sell_sales == true
Bearishh = ta.crossover(wt1, wt2) and Sell_sales == false
plot(BullSale ? wt2 + ploff : na, style=plot.style_circles, color=color.new(Bearish, 0), linewidth=6, title='BuysG')
plot(BearSale ? wt2 + ploff : na, style=plot.style_circles, color=color.new(Bearish, 0), linewidth=6, title='SellsG')
plot(Bullishh ? wt2 - ploff : na, style=plot.style_circles, color=color.new(Strong_Bullish, 0), linewidth=6, title='Buys On Sale')
plot(Bearishh ? wt2 - ploff : na, style=plot.style_circles, color=color.new(Strong_Bullish, 0), linewidth=6, title='Sells on Sale')
//plot(Histogram ? wt1 - wt2 : na, style=plot.style_area, color=color.new(Blue2, 80), linewidth=1, title='Histograma')
//barcolor(barras == true and Bullishh == true or barras == true and Bearishh == true ? Bullish2 : na)
//barcolor(barras == true and BullSale == true or barras == true and BearSale == true ? Bearish : na)
/////// Divergence ///////
f_top_fractal(_src) =>
_src < _src and _src < _src and _src > _src and _src > _src
f_bot_fractal(_src) =>
_src > _src and _src > _src and _src < _src and _src < _src
f_fractalize(_src) =>
f_top_fractal(_src) ? 1 : f_bot_fractal(_src) ? -1 : 0
fractal_top1 = f_fractalize(wt1) > 0 ? wt1 : na
fractal_bot1 = f_fractalize(wt1) < 0 ? wt1 : na
high_prev1 = ta.valuewhen(fractal_top1, wt1 , 0)
high_price1 = ta.valuewhen(fractal_top1, high , 0)
low_prev1 = ta.valuewhen(fractal_bot1, wt1 , 0)
low_price1 = ta.valuewhen(fractal_bot1, low , 0)
regular_bearish_div1 = fractal_top1 and high > high_price1 and wt1 < high_prev1 and divregbear == true
hidden_bearish_div1 = fractal_top1 and high < high_price1 and wt1 > high_prev1 and divhidbear == true
regular_bullish_div1 = fractal_bot1 and low < low_price1 and wt1 > low_prev1 and divregbull == true
hidden_bullish_div1 = fractal_bot1 and low > low_price1 and wt1 < low_prev1 and divhidbull == true
col1 = regular_bearish_div1 ? Bearish : hidden_bearish_div1 ? Bearish : na
col2 = regular_bullish_div1 ? Strong_Bullish : hidden_bullish_div1 ? Strong_Bullish : na
//plot(title='Divergence Bearish', series=fractal_top1 ? wt1 : na, color=col1, linewidth=2, transp=0)
//plot(title='Divergence Bullish', series=fractal_bot1 ? wt1 : na, color=col2, linewidth=2, transp=0)
plotshape(regular_bearish_div1 and divregbear and Tags ? wt1 + ploff * 1 : na, title='Divergence Regular Bearish', text='Bear', location=location.absolute, style=shape.labeldown, size=size.tiny, color=color.new(Bearish, 0), textcolor=color.new(White, 0))
plotshape(hidden_bearish_div1 and divhidbear and Tags ? wt1 + ploff * 1 : na, title='Divergence Hidden Bearish', text='H Bear', location=location.absolute, style=shape.labeldown, size=size.tiny, color=color.new(Bearish, 0), textcolor=color.new(White, 0))
plotshape(regular_bullish_div1 and divregbull and Tags ? wt1 - ploff * 1 : na, title='Divergence Regular Bullish', text='Bull', location=location.absolute, style=shape.labelup, size=size.tiny, color=color.new(Strong_Bullish, 0), textcolor=color.new(White, 0))
plotshape(hidden_bullish_div1 and divhidbull and Tags ? wt1 - ploff * 1 : na, title='Divergence Hidden Bullish', text='H Bull', location=location.absolute, style=shape.labelup, size=size.tiny, color=color.new(Strong_Bullish, 0), textcolor=color.new(White, 0))
/////// Unfazed Alerts //////
////////////////////////////////////////////////-MISTERMOTA MOMENTUM-/////////////////////////////////////
source = input(close)
responsiveness = math.max(0.00001, input.float(0.9, minval=0.0, maxval=1.0))
periodd = input(50)
sd = ta.stdev(source, 50) * responsiveness
var worm = source
diff = source - worm
delta = math.abs(diff) > sd ? math.sign(diff) * sd : diff
worm += delta
ma = ta.sma(source, periodd)
raw_momentum = (worm - ma) / worm
current_med = raw_momentum
min_med = ta.lowest(current_med, periodd)
max_med = ta.highest(current_med, periodd)
temp = (current_med - min_med) / (max_med - min_med)
value = 0.5 * 2
value *= (temp - .5 + .5 * nz(value ))
value := value > .9999 ? .9999 : value
value := value < -0.9999 ? -0.9999 : value
temp2 = (1 + value) / (1 - value)
momentum = .25 * math.log(temp2)
momentum += .5 * nz(momentum )
//momentum := raw_momentum
signal = nz(momentum )
trend = math.abs(momentum) <= math.abs(momentum )
////////////////////////////////////////////////-GROWING/FAILING-//////////////////////////////////////////
length = input.int(title="MOM Period", minval=1, defval=14, group="MOM Settings")
srcc = input(title="MOM Source", defval=hlc3, group="MOM Settings")
txtcol_grow_above = input(#1a7b24, "Above Grow", group="MOM Settings", inline="Above")
txtcol_fall_above = input(#672ec5, "Fall", group="MOM Settings", inline="Above")
txtcol_grow_below = input(#F37121, "Below Grow", group="MOM Settings", inline="Below")
txtcol_fall_below = input(#be0606, "Fall", group="MOM Settings", inline="Below")
ma(source, length, type) =>
switch type
"SMA" => ta.sma(source, length)
"EMA" => ta.ema(source, length)
"SMMA (RMA)" => ta.rma(source, length)
"WMA" => ta.wma(source, length)
"VWMA" => ta.vwma(source, length)
typeMA = input.string(title = "Method", defval = "SMA", options= , group="MA Settings")
smoothingLength = input.int(title = "Length", defval = 5, minval = 1, maxval = 100, group="MA Settings")
smoothingLine = ma(delta, smoothingLength, typeMA)
deltaText=(delta > 0 ? (delta > delta ? " MOM > 0 and ▲ Growing, MOM = " + str.tostring(delta , "#.##") :" MOM > 0 and ▼ Falling, MOM = " + str.tostring(delta , "#.##") ) : (delta > delta ? "MOM < 0 and ▲ Growing, MOM = " + str.tostring(delta , "#.##"): " MOM < 0 and ▼ Falling, MOM = " + str.tostring(delta , "#.##")))
oneDay = 24 * 60 * 60 * 1000
barsAhead = 3
tmf = if timeframe.ismonthly
barsAhead * oneDay * 30
else if timeframe.isweekly
barsAhead * oneDay * 7
else if timeframe.isdaily
barsAhead * oneDay
else if timeframe.isminutes
barsAhead * oneDay * timeframe.multiplier / 1440
else if timeframe.isseconds
barsAhead * oneDay * timeframe.multiplier / 86400
else
0
angle(_src) =>
rad2degree = 180 / 3.14159265359
//pi
ang = rad2degree * math.atan((_src - _src ) / ta.atr(14))
ang
emae = angle(smoothingLine)
emaanglestat = emae > emae ? "▲ Growing": "▼ Falling"
deltaTextxxx = "MOM MA/ATR angle value is " + str.tostring(emae, "#.##") + "° and is " + emaanglestat
deltacolorxxx = emae >0 and emae >=emae ? txtcol_grow_above : txtcol_fall_below
// Label
label lpt1 = label.new(time, -30, text=deltaTextxxx , color=deltacolorxxx, xloc=xloc.bar_time, style=label.style_label_left, textcolor=color.white, textalign=text.align_left, size=size.normal)
label.set_x(lpt1, label.get_x(lpt1) + tmf)
label.delete(lpt1 )
txtdeltaColors = (delta > 50 ? (delta < delta ? txtcol_grow_above : txtcol_fall_above) : (delta < delta ? txtcol_grow_below : txtcol_fall_below))
label ldelta1 = label.new(time, 30, text=deltaText , color=txtdeltaColors, xloc=xloc.bar_time, style=label.style_label_left, textcolor=color.white, textalign=text.align_left, size=size.normal)
label.set_x(ldelta1, label.get_x(ldelta1) + tmf)
label.delete(ldelta1 )

9:30 AM Candle High/Low Lineshelps to find intraday bullish and bearish signal...all most 80% + accuracy
