Manual PnL (Profit and Loss) % Tracker - spot long only
This is a manual profit and loss tracker. It takes the user's manual input of total cost and quantity, and then outputs a table on the bottom right of the chart showing the profit or loss %, average purchase price, gross profit or loss, and market value.
Instructions:
1. Double click the indicator title at the top left of the chart
2. Select the "Inputs" tab and click the empty field next to "Symbol" to enter the traded symbol+exchange. This entry MUST be the same as the chart you are on, for example BTCUSDT/BINANCE (indicator will not display otherwise)
3. Enter the Total Cost and Qty of shares/coins owned
4. Optional - change positive or negative colors
5. Optional - under the "Style" tab, change the color of the average price (AVG) line
Note that for the average price (AVG) line to be shown/hidden you must enable/disable "Indicator and financials labels" in the scales settings.
For crypto or other tickers that have prices in many decimal places I would suggest, for the sake of accuracy, adjusting the decimal places in the code so that for prices under $1 you will display more info.
For example let's say you purchase x number of crypto at a price of 0.031558 you should change the code displaying "0.00" on line 44 to "0.000000"
This will ensure that the output table and plotted line will calculate an average price with the same number of decimals.
Percentage

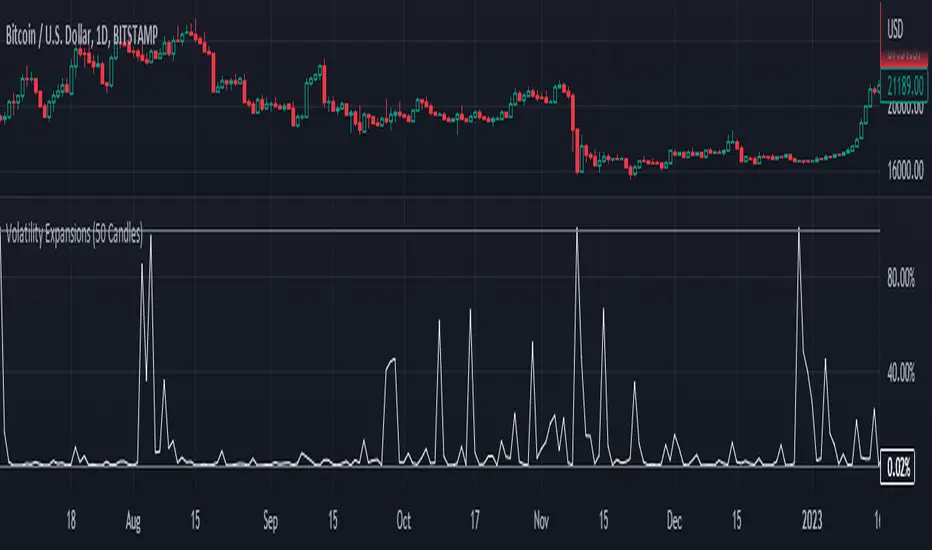
Fixed Volatility OscillatorA fixed volatility plotter set to a 0-100 range - Plots the current volatility % using the formula to calculate volatility and stdev (standard deviation) based on the candle lookback.
The indicator is Fixed, which means that regardless of the chart, the volatility will be plotted on a percentage of 0% - 100% with a 101% threshold set to indicate a volatility reset. While the volume of volatility will change depending on the chart, the volatility will ALWAYS stay within this range.
if a plot exceeds 100% it should be marked as volatility reset - not an expansion
and should also be noted that the volatility spikes are also very inconsistent in volume and vary greatly.
The candle lookbacks on standard are organized be from 10 candles to 100 candles. I found the best results using the 50 candles lookback, and therefore have set it as the default value. These different values can be used to pull the information from the # of candles on the selected option - and therefore the volatility will be calculated from the number of candles selected.
// note for other people versed in pinescript
While this indicator may be useful in trading or strategies, it is more meant to incorporated into other scripts or used as a basis that can be further expanded on. The visuals are not built at all - for that purpose.
This script has not been listed as a library for the fact that it can be used as an actual indicator within a strategy - hope you enjoy.
Percent Change of Day [ilovealgotrading]
OVERVIEW:
This indicator aims to effectively show us the percentage change of the price within the time frame we have chosen.
What is the purpose of this indicator?
This indicator shows how the price changes for each bar at different time frames we have chosen. By examining the percentage change in different time periods, we can easily look at the change in the face of the market during the time interval. Also if the price is above or below the value of 0 during the specified time, the color of our percentage line changes.
IMPLEMENTATION DETAILS:
First of all, let's understand How to Calculate Percent Change?
The difference between the old and new value of a quantity given in percentages is known as a percent change. It's rather simple to calculate the % difference between two given quantities.
The formula is given by;
Example
The price of a kilo of rice went from 10$ to12.5$, what is the percentage change?
Explanation
• The old value of sugar = $ 10
• New value = $12.5
• Now apply the percent change formula;
• Percentage change = ×100%
= x 100%
= (2.5/10) x 100%
= 25%
In this case, the percent change is positive and therefore, it is an increase.
How Is Percentage Change Used in Finance?
In the world of finance, percentage change is frequently used to analyze changes in the value of stocks or major market indexes over time.
Percentage change is used for many purposes in finance, most notably to track the price change of stocks market and crypto market.
What can we change from the settings panel ?
We can set time frame setting of the percentage change from place number 1
We are able to adjust the changing color if the percentage change is above or below zero from place 2 and 3
ALSO:
Please do not open trades without properly managing your risk and psychology!!!
If you have any ideas what to add to my work to add more sources or make calculations cooler, suggest in DM .
distance_ratioLibrary "distance_ratio"
Collection of types and functions that can be used for the calculation of the ratio of a distance
from a barrier price using several methods. Methods supported are percentagewise (PERC), atr-based (ATR), fixed
profit (PROF), tick-based (TICKS), risk reward ratio (RR) and local extrema (LOC).
This library is meant to replace my previously published "distance_percentile" library since it offers a more intuitive interface by using the method syntax.

Price & Percentage Change LabelFairly straightforward script that allows you to plot the current price and % either above the last candle and/or to the right of it. There's also 2 price "follow" lines that you can turn off and on, much like the bid/ask line that's built in to TV.
You can also choose to enable a specific % above/below current price to give you an idea on where price would be with a move north or south by X % amount from current price.

TheATR™: Volatility Extremes (VolEx)Volatility is a crucial aspect of financial markets that is closely monitored by traders and investors alike. The traditional Average True Range (ATR) oscillator is a widely used technical indicator for measuring volatility in financial markets. However, there are limitations to the ATR oscillator, as it does not account for changing market conditions and may not adequately reflect extreme price movements. To address these limitations, TheATR has developed the VolEx indicator, which aims to identify extremes in the ATR oscillator by building dynamic thresholds using either a 'percentage' or 'standard deviation' based comparison with the value of the ATR.
The VolEx indicator utilizes a dynamic approach to measure volatility by considering the current level of the ATR oscillator relative to the dynamically generated thresholds. The dynamic thresholds are calculated based on the current ATR value and the chosen method of comparison (either 'percentage' or 'standard deviation'). If the ATR value exceeds the upper dynamic threshold, the market is experiencing high volatility, while a value below the lower dynamic threshold indicates low volatility.
The VolEx indicator offers several advantages over traditional volatility indicators, such as the ATR oscillator. First, it takes into account the changing market conditions and adjusts the thresholds accordingly. Second, it offers flexibility in the choice of the comparison method, allowing traders to tailor the indicator to their specific trading strategies. Finally, it provides clear signals for identifying extremes in volatility, which can be used to inform trading decisions.
In summary, the VolEx indicator developed by TheATR is a dynamic and flexible technical indicator that offers a robust approach to measuring volatility in financial markets. By utilizing dynamic thresholds and allowing for different comparison methods, the VolEx indicator provides a valuable tool for traders and investors seeking to identify extremes in market volatility..
NOTE: It is important to note that volatility, as measured by the VolEx indicator, does not provide any directional bias for the market movement. Rather, it simply indicates the degree to which the market is moving, regardless of direction. Traders and investors must use other technical or fundamental analysis tools to determine the direction of the market and make informed trading decisions based on their individual strategies and risk tolerance.

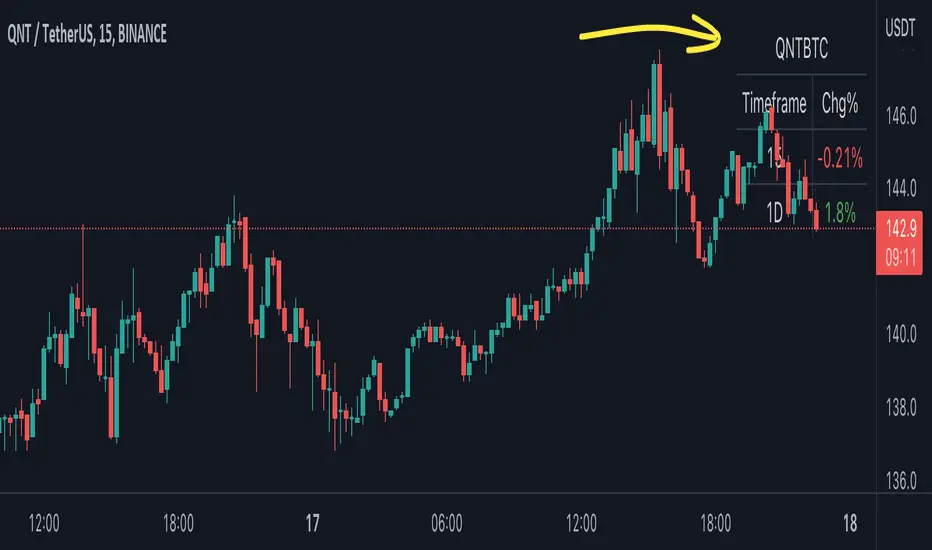
BTC Pair Change %This script makes it easier to quickly check how the BTC pair of the current symbol is performing on any pair.
It adds a " change percentage widge t" (of the BTC pair ) to the top right of the chart.
(Refer to the image for an example.)
The change percentage calculation is performed as described here:
www.tradingview.com
To match the "Chg%" that appears on TradingView watchlists, a 24H (1440min) timeframe is used, as described here:
money.stackexchange.com
In short, this script:
Searches for the BTC pair of the current symbol
Calculates the change % using the above described logic (links)
Adds a " change percentage widget " (of the BTC pair) to the top right of the chart
Allows for using 24H timeframe or the current timeframe (enable " Use current timeframe " under the script options)
Probabilities Module - The Quant Science This module can be integrate in your code strategy or indicator and will help you to calculate the percentage probability on specific event inside your strategy. The main goal is improve and simplify the workflow if you are trying to build a quantitative strategy or indicator based on statistics or reinforcement model.
Logic
The script made a simulation inside your code based on a single event. For single event mean a trading logic composed by three different objects: entry, take profit, stop loss.
The script scrape in the past through a look back function and return the positive percentage probability about the positive event inside the data sample. In this way you are able to understand and calculate how many time (in percentage term) the conditions inside the single event are positive, helping to create your statistical edge.
You can adjust the look back period in you user interface.
How can set up the module for your use case
At the top of the script you can find:
1. entry_condition : replace the default condition with your specific entry condition.
2. TPcondition_exit : replace the default condition with your specific take profit condition.
3. SLcondition_exit : replace the default condition with your specific stop loss condition.

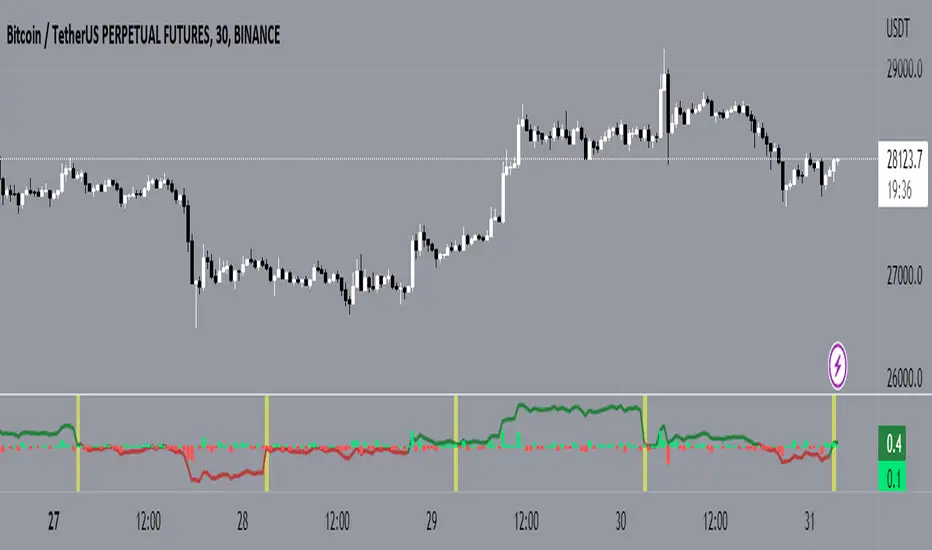
Quantum Vector AlertsIts the part 2 of Multiple Indicators 50EMA Cross Alerts.
Its more suitable for the seconds chart. Beside, you can use it in higher timeframe.
The input bars length is the sample size that the code will use to trigger all alert. 20 mean 20 bar after the current candle.
When you activate volume alert you can select an amount of volume that when volume cross it you will be notified. The volume of every bar is displayed in the screener below volume.
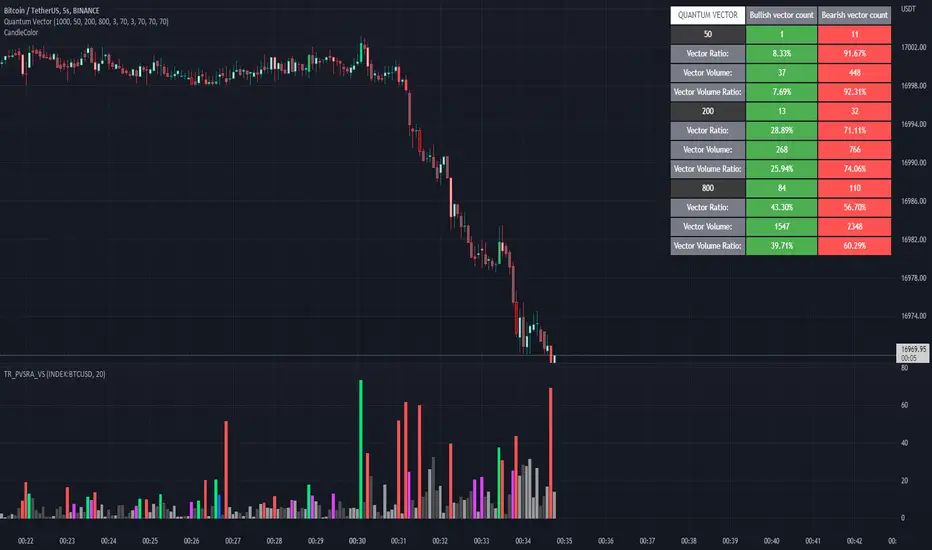
In the section percentage vector counting the script do the sum of the red vector and green vector and give a ratio. In bullish vector count percentage for alert, you can select the percentage difference that you want to receive an alert. If your sample have 3 red vectors and 7 green vectors you will receive an alert saying that there is an imbalance of 70% showing more green vectors.
You can select a variant of percentage vector. The variant will do a summation of volume. If 1 vector candle is the size of the 3 other vector, they will have the same ponderation.
Normal alert counting count the number of vectors in the bars length. You can count the red and green candle only or add the blue and violet.
Bullish vector count will show a notification when the number of green candle will appear on the chart in the selected length. The same process is valid for bearish vector count. For example, if you want 3 bullish candle in 20 bar. You select bars length 20 and bullish vector count 3.
These alerts are suitable to the hybrid system. Thanks to our teacher Trader Reality and to all the member that contribute to this great discord community.
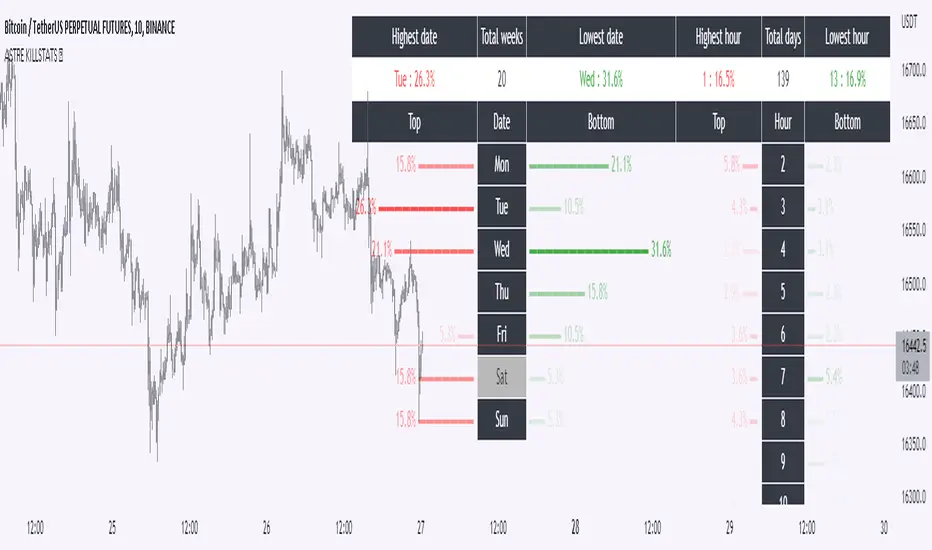
KillstatsBacktest and identify at what times/days the high/low were formed. The periods are shown on the graph along with detailed statistics.
Exemple with "days : 600" and "13h : top 12%" : we understand that over 600 days, in 12% of the cases we have formed the top of the day at 13h.
up to 1000+ days studied to find favorable reversal time slots: killstats! The data presented can sometimes be... surprising.
Increasing/decreasing the timeframe on chart = increase/decrease the studied period.
A period of 1000 days ( UT : h1) allows to have solid but not exact statistics.
A period of 30 days allows to have current statistics but too little sample to know if the data is relevant.
I recommend looking for intersections of killstats over several periods: If over 1000 days AND 30 days, 3pm was a time with a high probability of forming a top, it is interesting to look for short positions between 3pm and 4pm.
The data is displayed in the form of a diagram whose visual allows to identify effective time slots.
Caution. Timeframe: h1 maximum for the study of the day's high/low to be correct - and daily maximum for the study of the week's high/low.
Caution2. Match the timezone with the input (by default set to GMT+1). So if you are at GMT+2, you must put "2" in timezone.
I recommend using this as part of an aggressive high frequency scalping strategy to make the most of your trading session - with the aim of quickly moving to TP1/BE and leaving your winning position open.
Extension %This is a tracking tool to measure two different kinds of distances:
- Gaps, from the open/close or the high/low value to the nearest open/close or high/low value.
- Price extensions of one or two candles from a preferred starting point (open, high, low or close) to a final point (open, high, low or close). The two-candles mode includes an optional rectangle to help you visualize the first and the last point of the measurement.
The script will plot a label with a percentage when the extension reaches the value you set. Unless you choose to track the one-candle price extension, the label will always be displayed on the high/low value of the second candle.

BTC Profitable Wallets StrategyBTC Profitable Wallets Strategy - plots the percentage of profitable BTC wallets and places long orders when the profitable wallet share crosses above 50%, historically a very accurate point to catch the next Bull Run early.
The only setting is a smoothing option using the Moving Average method and length of your choice.
On Chain Data is queried from IntoTheBlock.
This is a 'HODL' strategy, with no exit given. If you'd like to see the historical performance check the Open Profit or place a sell order at the current date.

AlphaTrend Strategy with Trailing SL %this is a modified version of AlphaTrend Strategy with added trailing Stop Loss
this is my first script that I have added to tradingview community
the trailing SL makes it very effective to lower the losses and can improve the overall return

Percent above or Below Moving Average Candle colourFilter:
If green candle is 'x' % above moving average than colour of candle is turn in blue colour.
If red candle is 'x' % below moving average than colour of candle is turn in orange colour.

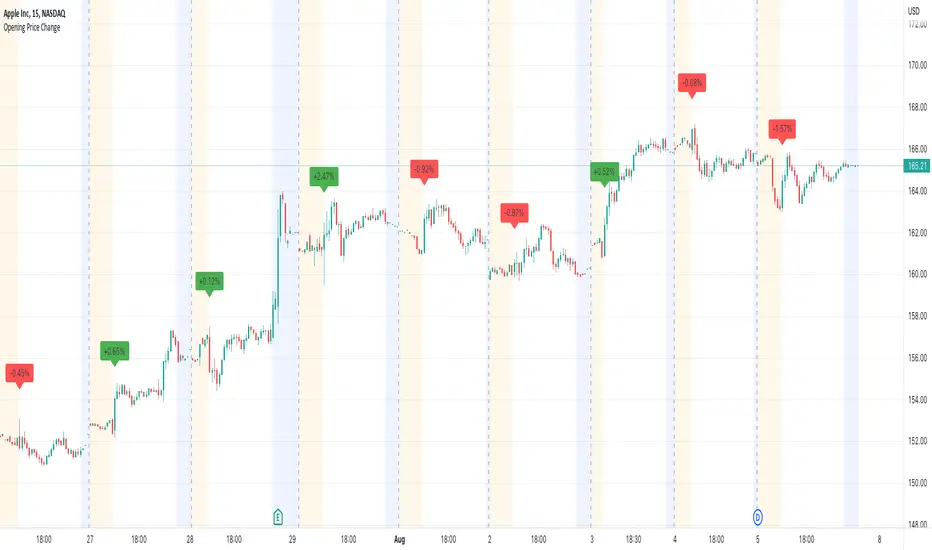
Opening Price ChangeThis script shows the change from the market opening price to the market closing price of the previous day in percent.
With this you can quickly get an overview of historical data for the change of the respective day.
Important: the market closing price is always used for the calculation and not the pre/post market price.
The label with the change value is always placed above the first opens regular market bar. If the change is positive, the label is draw with a green background, is the change is negative you will have a red background.
Month/Month Percentage % Change, Historical; Seasonal TendencyTable of monthly % changes in Average Price over the last 10 years (or the 10 yrs prior to input year).
Useful for gauging seasonal tendencies of an asset; backtesting monthly volatility and bullish/bearish tendency.
~~User Inputs~~
Choose measure of average: sma(close), sma(ohlc4), vwap(close), vwma(close).
Show last 10yrs, with 10yr average % change, or to just show single year.
Chose input year; with the indicator auto calculating the prior 10 years.
Choose color for labels and size for labels; choose +Ve value color and -Ve value color.
Set 'Daily bars in month': 21 for Forex/Commodities/Indices; 30 for Crypto.
Set precision: decimal places
~~notes~~
-designed for use on Daily timeframe (tradingview is buggy on monthly timeframe calculations, and less precise on weekly timeframe calculations).
-where Current month of year has not occurred yet, will print 9yr average.
-calculates the average change of displayed month compared to the previous month: i.e. Jan22 value represents whole of Jan22 compared to whole of Dec21.
-table displays on the chart over the input year; so for ES, with 2010 selected; shows values from 2001-2010, displaying across 2010-2011 on the chart.
-plots on seperate right hand side scale, so can be shrunk and dragged vertically.
-thanks to @gabx11 for the suggestion which inspired me to write this

Artharjan Volume AnalysisHi,
I have created Artharjan Volume Analysis indicator dashboard which gives following information about the volume to the traders.
It has two rows. The first row containing volume information is for the Daily Timeframe and the second row containing volume information for any other timeframe of your choice (Basically Chart timeframe)
It gives following information about volume to the traders.
1] Current Volume in Lakhs (Not in Millions) since this script was made keeping in mind Volumes of the Scripts traded in Indian Stock Exchanges. 1 Lakh = 1,00,000
2] Change from its previous Volume. If the change is positive it will be highlighted in Green else in Red.
3] 25 period SMA of the Volume (This period is a Long Term Moving Average and its a customizable parameter which can be changed in Indicator Settings)
4] Current Volume as a percentage of Long term SMA( Volume). If the percentage is positive it will be highlighted in Green else in Red.
5] High Volume during the Lookback period
6] Low Volume during the Lookback period
7] Is current Volume equal to Min Level or Max Level? Or its between Min Max Levels.
8] Is the current Volume rising over past 5 candles or is it falling over past 5 candles or its Swinging? (Short Term Period which is a customizable parameter and it can be changed in the Indicator Settings)
9] Current Volume as a percentage of Short term SMA( Volume). If the percentage is positive it will be highlighted in Green else in Red.
The 1st row will be shown only when the Chart Timeframe is a Daily Timeframe.
The 1st and the 2nd row will be shown only when the Chart Timeframe is not a Daily Timeframe.
With this information regarding volume, traders can identify whether the current volume is at its Highest Levels or at its Lowest Levels, can identify whether volume is rising or volume is falling in accordance to the price action and then take trading decisions.
I hope you would enjoy using this indicator in your day to day trading journey.
Regards
Rahul Desai
@Artharjan.

Distance From Moving AverageThis indicator shows the distance between the current price and the Moving Average price.
Key Features:
Show the distance between price and Moving Average (Read Distance Calculation for more information)
Show Historic Highs and Lows
Show Highest High and Lowest Low
Show current Highest High, current Lowest Low and current distance
Key Indicator Settings:
1. Distance Calculation
There are two ways to calculate the distance:
Spread - Calculate the difference between the price and the moving average
Percentage - Calculate the percentage change between the price and the moving average
2. Moving Average Types
There are 5 different Moving Averages:
EMA
SMA
WMA
VWMA
HMA
3. Highest High and Lowest Low
You can show or hide the Highest High and the Lowest Low plots of the series
4. Historic Highs and Lows
You can show or hide past Highs and Lows of the series
Lookback Length - Let's you adjust the frequency of local highs and lows of the series
5. Current Values
You can show or hide current value labels

Big Moves IndicatorThis indicator marks big candles (major moves in percentage) on the chart and, more importantly, you will be able to add an alert to them.
Indicator checks if the height (high - low) of last closed candle is bigger than the specified percent of the close of its previous. No matter if the last candle is red or green, the indicator compares the move amount with the previous close. Accordingly, seeing a mark above or below a candle means that there is a large movement in it compared to its previous candles.
Default percentage is 5 but you can change it as you with in the settings and I want to underline that the indicator ignores the non-closed candle at the moment.

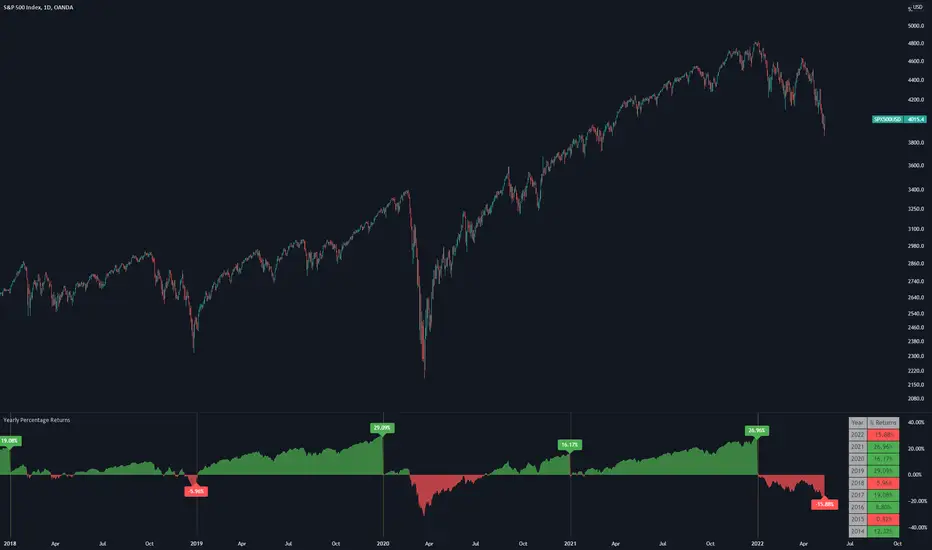
Yearly Percentage ReturnsAn indicator that lets you visualize the historical Yearly Percentage returns of any symbol .
Key Features:
Displays the yearly returns from start to end of each year
Displays a table showing all yearly returns for current symbol
Displays start of each year as a vertical line
Displays up to 5 custom horizontal levels
Table Settings:
Enable table - Show/Hide the table
Size - Sets the size of the table
Position - Sets the position of the table on the screen
Direction - Sets the direction of the table to display the data (Vertically or Horizontally)
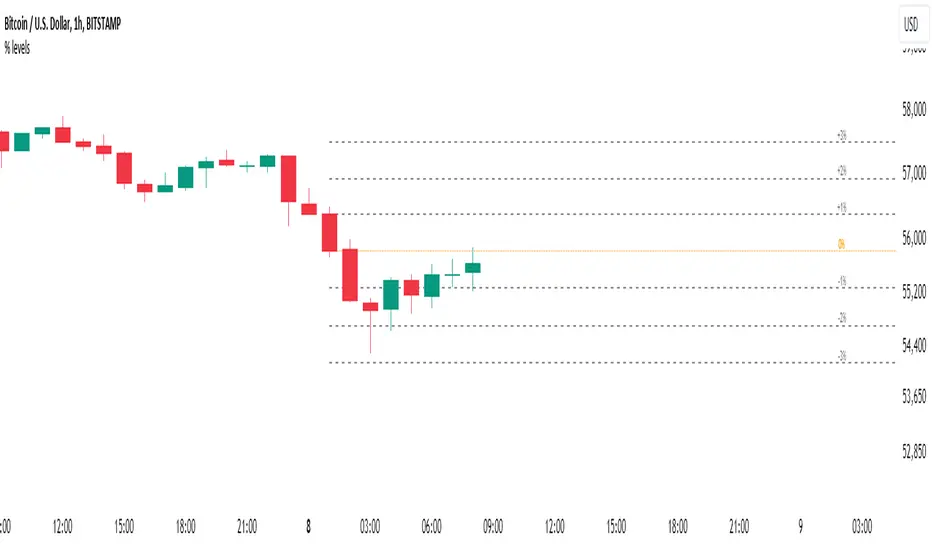
Percent Levels From Previous CloseThis indicator plots on the chart +/- 1% / 2% / 3% ranges based on the previous day's close levels.
Disclaimer :
Success in trading is all about following your trading strategy and indicators should fit into your own strategy, and not be traded purely on.
This script is for informational and educational purposes only. Use of the script does not constitute professional and / or financial advice. You are solely responsible for evaluating the outcome of the script and the risks associated with using the script. In exchange for the use of the script, you agree not to hold monpotejulien TradingView user responsible for any possible claims for damages arising out of any decisions you make based on the use of the script.
3D GATOR %HLThis indicator tracks the 3 day trading bots and measures the high and the low (%).
Usually a trend can change or continue every 3 days.
When volatility decreases and both values are the same gator is going to open its jaws so it's a good time to open a position long. Avoid shorts during low volatility.
On the other hand when volatility increases, and gator has its jaws wide open is a good time to look for shorts.
That's pretty much it.
This indicator was designed by me and created by Marketwatcher.

% Price change (by OP)To visually evaluate the percentage change in price over any time period
This handsome indicator shows exact % price change at each candle by displaying a circle at the level of the change. To read numerical value, point at the circle of the relevant bar corresponding to the candle you are interested in, and look at the scale.
