Penunjuk Pine Script®
Percentage
Cumulative Price Change %Tracking cumulative percentage change in price for each candle over a period.
Penunjuk Pine Script®

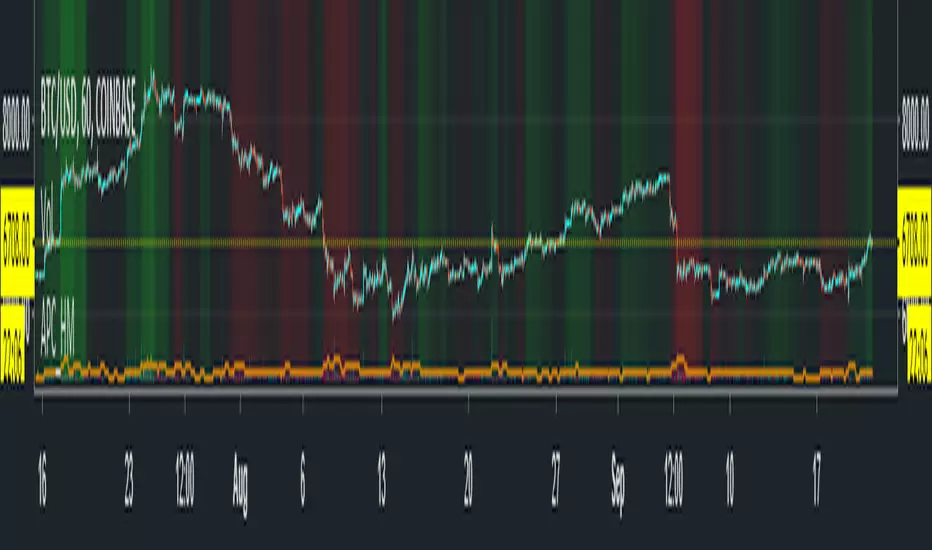
PTF_VWMA Percentage ChangeThis Indicator plots the Percentage change of the Volume Weighted Moving Average.
It takes the VWMA length and calculates the Volume Weighted Moving Average over that period, it then "Looks Back" and calculates the percentage change from that point to the current point.
This is helpful in seeing if the price has swung outside of a normal range that you can determine by adjusting an upper and lower horizontal line. These lines are just guides.
In the case of a pump and dump, the VWMA Percentage change line would swing wildly upwards and then crash back downwards, after the coin stablises again then the VWMA % Change would fit back into your "Safe Trading Zone"
Feel free to you it as you wish and if you feel generous then by all means, donate some LTC.
If you don't have PT Feeder and have now decided to get it, please use my affiliate link below.
Created 2018 - by @Squiggles#8806
LTC Tip Jar: LX4bUBdjiRPsagUbZoAczSGgDC4YqTJL7w
Pt Feeder affililiate link: cryptoprofitbot.com
Penunjuk Pine Script®

Penunjuk Pine Script®
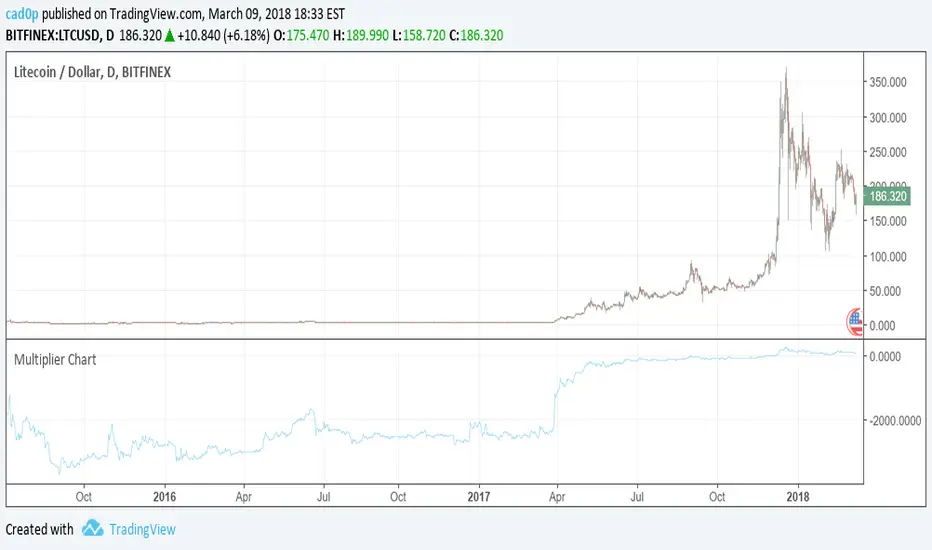
Multiplier ChartI am proposing an alternative to the percent change.
An alternative that is symmetrical to both positive and negative change, unlike percentage change.
The simple idea is to have a positive number if the reference value (called val in the script) is lower than the stock value and needs to be multiplied;
a negative number instead if the reference number is higher than the stock value, so the reference value needs to be divided.
Multiplying all by 100 to give clearer and more readable results, the Multiplier would have a huge gap between +100 and -100, because a stock multiplied by 1 or divided by 1 are the same thing.
So we need to compromise and move all positive numbers down by 100 and all negative numbers up by 100. This actually gives a similar result to percentage change, and it is actually identical in the positive range.
The fundamental difference lies on the negative range, which is completely symmetrical. So if a stock goes up 100 points one day (doubles), and the next it goes down another 100 points (halves), at the end of the second day the stock has the same value as it had at the beginning of the first day! On percentage change it would be +100% the first day and -50% the second.
We mustn't undervalue the human tendency to compare a 1% change to a -1% change, but they do not mean the same even if they seem to indicate so.
A clear example of this can be found on CMC 0.60% -3.56% -3.56% (CoinMarketCap), in which each day are shown the best and worst performing coins of the day. So you might see a +900% there in the top performing, but you'll never see a -900%, because percentage change cannot go further than -100%. It is a fundamentally asymmetric scale that can confuse people a lot especially in those fast moving new markets.ù
I am welcome to feedback and all kinds of opinions and critics.
Some interesting things to note: you can use it as a percentage change indicator or as a different perspective to a stock chart. In fact, it lets you see how big of a difference it made buying coins when they were very cheap, because when they are cheap a difference of what it might seem nothing is amplified by all the gains that the stock/coin made after. So, looking at coins charts using this indicator shows how "not flat" were the early days, which in a normal chart are flattened to 0.
Penunjuk Pine Script®
Penunjuk Pine Script®

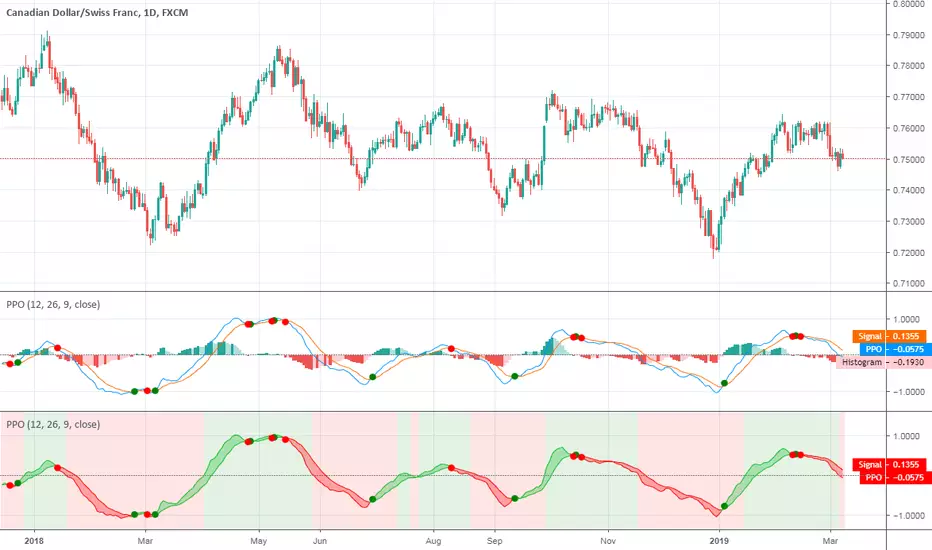
EMA Spread OscillatorEMA Spread Oscillator
Quickly see past levels where diff maxed out. Momentum and price can only keep going up for so long. This obviously differs per underlying asset. So that is where this oscillator comes in handy.
Of course you can see on the chart how far apart the moving averages are, but it is easier to spot on an oscillator.
Penunjuk Pine Script®
KAMA Divergence [DW]This study is a simple experiment that expresses divergences between price and Kaufman's Adaptive Moving Average as a percentage. The result is then smoothed using KAMA to provide a signal line.
Penunjuk Pine Script®

MgGinley Dynamic Divergence [DW]This is an experimental study designed to visualize momentum and average range by expressing divergences between price and a McGinley Dynamic as a percentage.
Penunjuk Pine Script®

Movement Percentage Tracker [DW]This is a simple study designed to show the percentage of increase and decrease for each new bar or specified interval.
Custom alerts with adjustable thresholds included.
Penunjuk Pine Script®

Gain/Loss TrackerHi,
This script's purpose is to provide a really quick view of gain/loss of a buying price.
As it is my first script, it is not perfect.
You have to select % scale and input your buying price in the options.
I'll continue to work on it to :
- make an auto selection of % scale (if possible)
- render different colors (positive/negative differentiation in relation to the buying price)
Updates 11/10/2017
- default precision set to 8 (for satoshis)
Penunjuk Pine Script®

Penunjuk Pine Script®
