Pivot Range - Fisher's Methodology(1D & 3D & W & M)Pivot Range - Fisher's Methodology(1D & 3D & W & M)
Version 2.00
Created by TWA_TradeWithAmir(TWA_PriceActionTips)
Updated 10/29/2020
Based On Mark B. Fisher's ACD Methodology
* 1D Pivot Range, 3D Pivot Range, Weekly Pivot Range & Monthly Pivot Range
Pivot

Magnetic Zones v1.1 BetaMagnetic Zones v1.1 Beta
This is one of the most powerful and effective indicator which I personally use for Intraday.
It works well for trending stocks and trending days.
What are the Zones?
The zones are basically Retracement and Reversal Zones. The price will take a halt at this zones. So it will be easy to take an entry.
How to use?
Labels:
Pivot = P
Major Zones = R1, R2, R3, S1, S2, S3
Minor Zones = R0.5, R1.5, R2.5, S0.5, S1.5, S2.5
Previous Day High & Low = PDH, PDL
Breakout:
Opens between Previous Day High or Low and R1 or S1 Zone and taking retracement at the zone can result in a breakout.
Entry Time:
No Entry: 0 to 15min. Wait for the early Algo rush to settle down. Just go through the shortlisted stocks or top gainers and top losers.
Risky Entry: 15min to 30min. It is the right or early time to participate in the beginning of a rally. But, recommended only for experienced, disciplined and planned traders.
Moderate Risk: 30min to 45min
Safe Entry: After 45min to 1hr
Stock Selection Tip:
Use Expanded Floor Pivots to spot Narrow Range stocks.
Entry Tip:
Use Opening Range Breakout (15, 30, 45 or 1hr) to spot false shoot ups.
Entry:
After the retracement on or closer to the zones.
If the retracement happens in between spaces of the zones expect next retracement at the next in between space. Imagine the levels accordingly.
Retracement is the right time to make an entry with minimum stoploss.
Stoploss:
Just below the longest candle which touches the zone.
Target:
If it is a trending stock the price will move easily from one major zone to another major zone.
If the zones are wider on a particular day use the minor zones as target.
Consider the historical support and resistance, highs and lows to confirm the entry or exit.
Indicator Features:
Inclusion of 2nd and 3rd zones: Helpful to identify the target zone and to participation in a major rally.
Clean and cluster free look
Shows only required zones
Hide historical levels
Previous day High and Low levels
Multi time-frame
Caution:
Don't solely depend on this indicator. Always use this with other analyzing tools or methods for more confirmation.
Acknowledgement:
Thanking the original formulators.
Note:
The indicator is under testing. Any errors, updates and additions will be updated in the final version.
Even though there many are other indicators similar to this in TradingView, this indicator is customized for precision, inclusion of extended levels and designed for a squeeze free chart and visual appeal.
Explore, improvise and formulate new methods with your personal experience and ideas.

Camarilla Scanner v1The script is based on Camarilla pivots for trend analysis of stock in intraday.
It will scan the selected stocks chosen in input settings displays the current status of where they are with respect to Camarilla pivots.
The day's history will show only those closed above R4/below S4.

Pocket PivotPockets Pivot were introduced by Gil Morales and Chris Katcher in the book "Trading like an O'Neil Disciple",
Pocket Pivot day occurs when the Volume has been higher than any down day 10 days prior and with a positive close.
Here is shown 5 days Pocket Pivots and 10 Days Pocket Pivots

Hancock - Pivot RangeShows central pivot point and developing central pivot point and colors both pivot ranges based on pivot criteria without using security function calls.
Green - Indicates up trend
Red - Indicates down trend
Orange - Indicates pivot point territory
Happy trading
Hancock

Derivative Pivot HL Points Hello.
This script aims to take into account mutable variable Pivot Points' periods.
While doing this, it takes the period between 2 signals that I use in the script:
And these periods in my Pivot HL function integrated into len length (Mutable variables) :
The cornerstone of the script is these facts.
Pivot can be optimized by playing with reversal periods.
These pre-formed levels can be used as Supply and Demand levels.
Regards.

Pivot Points 17 - StandardDisclaimer!
-This indicator doesn't tell you the market condition (BUY or SELL)
Cons!
- Totally dependent on your knowledge
Pros!
- Projects the Key Levels of a single time frame on the chart
Usage!
- Watch out for rejections at these levels
- Identify breakouts at these levels with strong confirmation like RETEST (as Level Role Reversal)

FTU Pivot Scalper Strategy By Ganesh This indicator is suited for intraday trader or swing trader or scalper and BTST trader AND BIG THING IS FOR TECHNOFUNDA INVESTOR
time frame to use: best suitable time frame is 5min and 15 min if ur swing trader then use hourly
intraday rule: buy when arrow suggested with buy with SL below trailing super trend
BTST rule: buy when arrow triggered buy or sell after 3:15 with sl of some tick high above trailing super trend
TECHNOFUNDA investor: buy fundamentally good script check weekly charts buy when weekly close arrow suggest buying with sl of weeks low hold till trailing sl not hit

Daily Pivot Alarmdefault Pivot
green line is the pivot Point, orange the daily open price.
You can use plots for alarm.

Pivot point labelThis script provides the user with a label containing the high and low pivot points from a period defined by the user.

Rolling Traditional Pivot Points [QuantNomad]Standard Traditional Pivot Points are calculated from the previous day (or another period) close/low/high. But what is the day close for cryptocurrencies trading 24/7 on exchange? Does it make sense to use a specific time price as a close if it continue trading after that?
So I decided to solve that issue with Rolling Traditional Pivot Points where I calculate pivot points not at the end of the period but for every bar. Every time recalculating pivot points I look at a window of period length in bars and base my calculations on these bars. This way you get smooth pivot points changing with every bar and it seems like levels might be really nice support and resistance for the price.
I implemented 6 periods: Auto, Day, Week, Month, Quarter, Year. For the Auto period, I select the most suitable period for the timeframe of your chart.
On the chart, you can see by default up to 11 levels plotted
PP – Pivot Point
S1, S2, S3, S4, S5 - Support Levels
R1, R2, R3, R4, R5 - Resistance Levels
####################
Disclaimer
Please remember that past performance may not be indicative of future results.
Due to various factors, including changing market conditions, the strategy may no longer perform as good as in historical backtesting.
This post and the script don’t provide any financial advice.
####################
It's a pro indicator, you can have access to it for a small fee.
To request access to this indicator - follow the "Pro Indicators" link in my signature on PM me.

Pivot-based EMA Bands (PEMA)This indicator draws 3 exponential moving averages.
It is coded according to the concept of pivot-based exponential moving averages. It visually reveals value opportunities during trending markets.
The moving averages are constructed based on pivot/typical price.
Typical price = (H+L+C)/3
There are 3 groups of exponential moving averages calculated using a typical price.
Moving average periods:
High Intensity: 8/13/21
Medium Intensity: 13/21/34
Low Intensity: 13/34/55

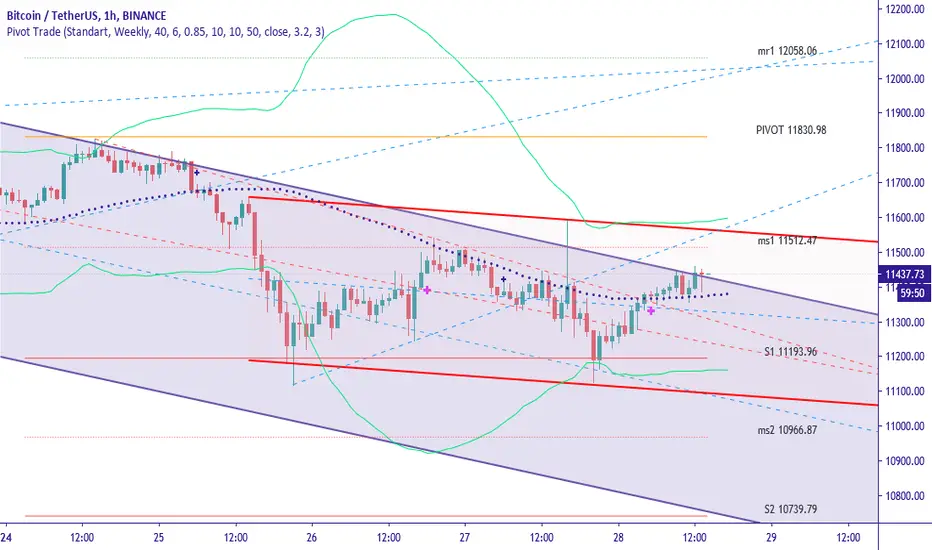
Pivot TradeThis study contains:
- A complete set of pivot calculation. Standart, Fibonacci, Woodie, Camarilla
- Standart Pivot with extended support and resistance levels.
- ALMA a new generation moving average indicator which succesfull to follow trend changes.
- System28 EMA Based trend follower. (Thanks to great master Ali Ömür)
- Auto Trend Lines drawing tool with pivot highs and lows.
- Alarm function on pivot levels.
How to Use :
UPTREND
Orange cross points to an uptrend,
Fuschia cross confirms uptrend.
DOWNTREND
Black cross points to an donwtrend,
Navy cross confirms uptrend.
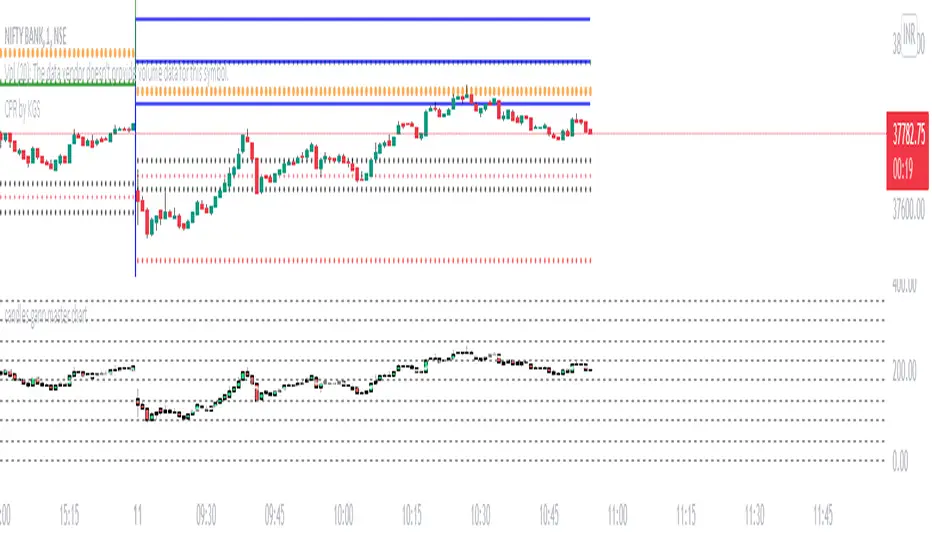
Magic CPRThis is not a simple CPR, this includes much more than a simple CPR. Typically a price action based trader use some other support and resistance combined with CPR and I am trying to combine all of them in one single indicator.
In the case of CPR this indicator supports only daily CPR but shows Weakly and Monthly pivot if you want on chart. Other than CPR, this indicator support,
1. Daily time frame Swing Low and High : Implemented, You have to set the number of days you have to consider calculating Swing high and Swing Low. yes this is not 100% automated but really useful.
2. Yesterday High
3. Yesterday Low
4. Today Open : Today Open and Yesterday Low / High will help you to see the gap.
5. Virgin CPR : Yes, I did not see any other indicator which shows Virgin CPR on your chart. This will draw virgin CPR if any virgin CPR exists in the last 6 days. I think people consider only last few days virgin CPR only .
Why This indicator
1. It is difficult for the trader to draw all the above drawings every day
2. Even if you want to use indicators to draw these, it is extremely difficult to configure and manage it in multiple indicators.
3. If you are using a free account you are limited with the number of indicators on the chart as well.
4. Most important, there is no other indicator draw virgin CPR for you
5. Typically people do not want the CPR and pivot data for older days, I provide an option to hide all older pivot data from chart
5. Even though Pivot can be calculated for the entire day, most of the pivots show pivot data till current time. In this indicator, the pivot data will be plotted to you for the entire day at 9:15 AM.
What I am expecting from you
1. Please let me know the feedback
2. Let me know if you are looking for any improvements
3. let me know if you find any bugs

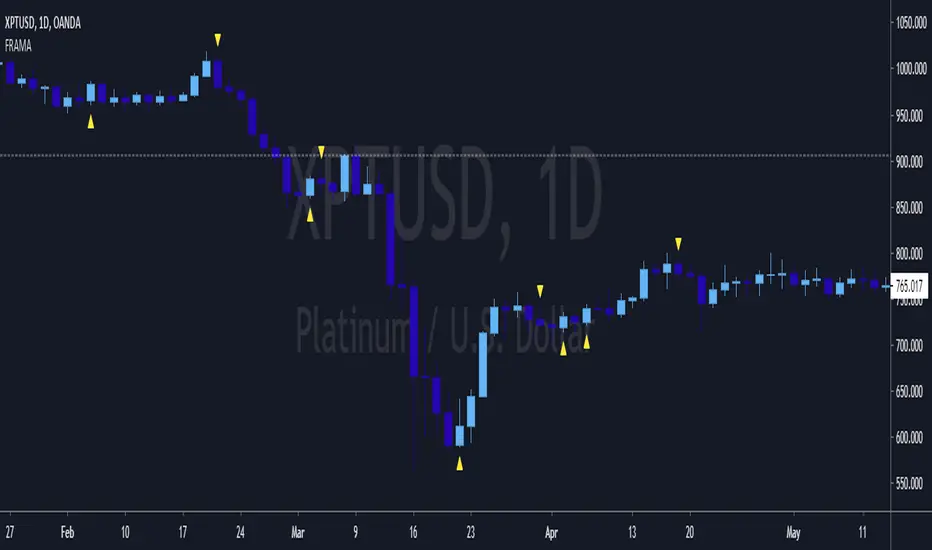
Fractal Adaptive Entry IndicatorThis entry indicator was inspired by John Ehle'rs "Fractal Adaptive Moving Average"
It's a very sensitive entry indicator that must be paired with a long-term trend detector in order to filter false positives.
Warning I have not backtested this indicator and will not make any claims to its performance.
Visually, it looks promising, however, backtesting and statistical analysis takes time.
Happy trading
<3
True Strong Classical Support/Resistance LevelsThis script is based on the approach of filtering signals by checking higher timeframes.
So basically setting higher numbers in "Strength Of Levels" option, will make the indicator check for support and/or resistance levels in timeframes higher than the current.
Unfortunately, I was forced to still use inefficient built-in functions pivothigh() and pivotlow(). I hope they fix them up soon!
I'm looking for any opinion about the idea and if you like any of my scripts, anything you send means a lot to me.
This script is published for the third time because of some moderators absurd behavior.
But thank heavens, the code is now more clean and of course the option "Strength Of Levels" accepts float numbers.

Rolling Fibonacci Pivot Points [QuantNomad]Standard Fibonacci Pivot Points are calculated from the previous day (or another period) close/low/high. But what is the day close for cryptocurrencies trading 24/7 on exchange? Does it make sense to use a specific time price as a close if it continue trading after that?
So I decided to solve that issue with Rolling Fibonacci Pivot Points where I calculate pivot points not at the end of the period but for every bar. Every time recalculating pivot points I look at a window of period length in bars and base my calculations on these bars. This way you get smooth pivot points changing with every bar and it seems like levels might be really nice support and resistance for the price.
I implemented 6 periods: Auto, Day, Week, Month, Quarter, Year. For the Auto period, I select the most suitable period for the timeframe of your chart.
On the chart, you can see by default 7 levels plotted:
PP – Pivot Point
S1 – Support on 0.382 fib level
S2 – Support on 0.618 fib level
S3 – Support on 1.000 fib level
R1 – Resistance on 0.382 fib level
R2 – Resistance on 0.618 fib level
R3 – Resistance on 1.000 fib level
Also in parameters you can display additional midpoints:
S0.5 – Support on 0.236 fib level
S1.5 – Support on 0.500 fib level
S2.5 – Support on 0.786 fib level
R0.5 – Resistance on 0.236 fib level
R1.5 – Resistance on 0.500 fib level
R2.5 – Resistance on 0.786 fib level
####################
It's a pro indicator, you can have access to it for a small fee. Link to my PRO indicators you can find in my signature.
####################
Disclaimer
Please remember that past performance may not be indicative of future results.
Due to various factors, including changing market conditions, the strategy may no longer perform as good as in historical backtesting.
This post and the script don’t provide any financial advice.

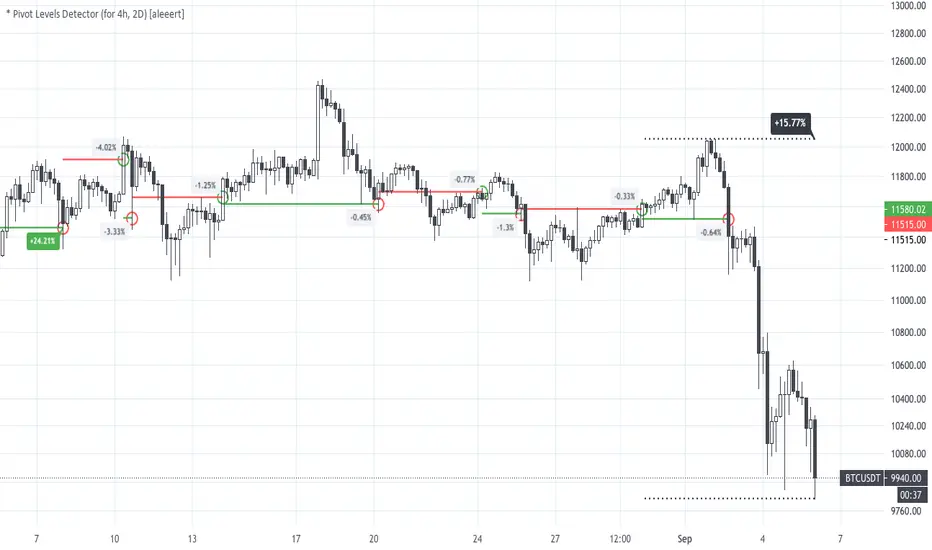
* Pivot Levels Detector (for H4, D2) [aleeert]Pivot Levels Detector is the script based on idea about breakouts of pivot levels which based on certain numbers of bars used for reaching the target and breakout the level. Working timeframes are H4 and 2D . The script works better with BTCUSD, ETHUSD, EOSBTC, AAPL, TSLA.
No repainting!
The script doesn't use any moving averages or other relative methods which cancel or change data on previous bars. Once the signal is showed it will stay forever.
NOTE: The results from Strategy Tester could slight vary from results you see on the chart. It's because of calculation method used on Strategy Tester, which uses a data from closed bars only, not by target reaching. So the results you see on the chart are more correct.
Follow me for receiving more scripts and indicators.
Regards,
aleeert

price Degree on gann master chartThis indicator calculates price degree on gann' s master chart. it will plot degree of open (red stepline), close(green stepline), high(white cross), low(red cross).
I request, only people who know how to use gann master chart and degrees of price use this. no one made this indicator till now. It is highly potential tool for gann gann fans.
happy trading!
comment if you like.
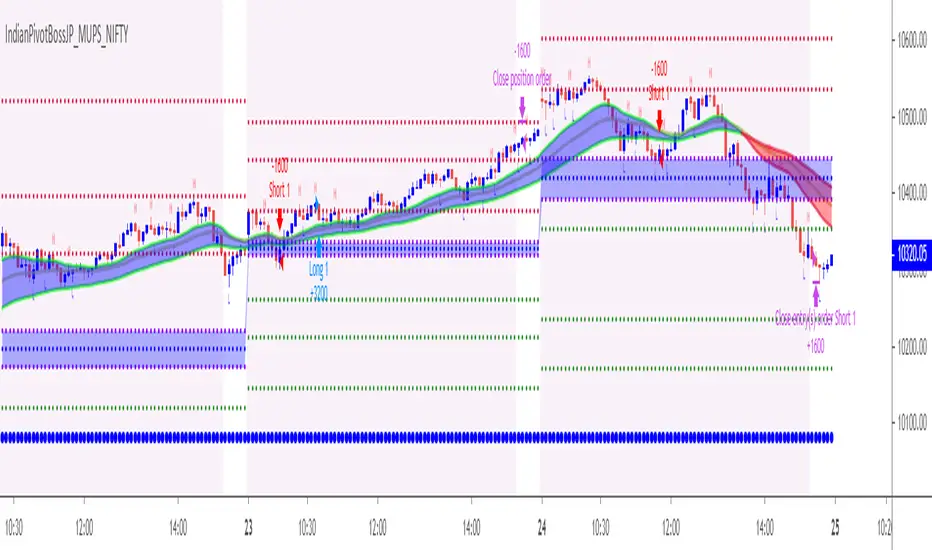
IndianPivotBossJP_MUPS_NIFTYThis is the JP_MUPS Strategy for NIFTY similar to BankNifty which is already there in JP_MUPS.
The best way to enter this strategy is as follows:
Option A :
Direct entry after signal with a stop .
Option B :
Have a Stochastic 14 / 5 / 5.
Once a short signal comes, wait for the Stochastic 14/5/5 to go to the OverBot zone above 70 and enter short after a crossunder, provided that during this period the long signal do not come.
Once a long signal comes, wait for the Stochastic 14/5/5 to go to the Oversold zone below 30 and enter long after a crossover, provided that during this period the short signal do not come.
This method will ensure that your entry is fine tuned.
Pivot Points with Monthly and Weekly optionsA pivot point indicator that has possibility to see even the monthly or the weekly pivot points .
Pivot points are very powerful if used in correct way.
most of the time the price can be rejected from the pivot point or if the price break it it will be a nice entry if retest the pivot
R2/S2 are a very strong pivots to break but of course you need a certain distance between the pivot

RVC-Trade-With-Pivot-LevelsHow to Use PIVOT Levels for Trading
Always remember ->: *Trade with trend*
About script:
1. Daily and Weekly close above Pivot Level.
-- Sentiment is highly positive. Pivot Level acts as strong support.
2. Daily Close above Pivot and Weekly Close Below Pivot
-- Sentiment is positive.Weekly Pivot Level may act as strong resistance.
3. Daily close below Pivot and weekly close above Pivot
-- Sentiment is negative but weekly Pivot Level can acts as strong support.
4. Daily and Weekly Close below Pivot Level
-- Sentiment is highly Negative. Pivot Level acts as strong resistance.
BUY/SELL -- ENTRY
BUY ABOVE 23.6% UPWARD
IF Trend is positive and price cross and sustains above 23.6%(R1) upside, then it will be entry from BUY perspective.
If R1 is entry, R2/R3/R4/R5 ... will be targets.
SELL Below 23.6% Downward
IF Trend is negative and price cross and sustains below 23.6%(S1) downside, then it will be entry from SELL perspective.
If S1 is Sell side entry, S2/S3/S4/S5 will be targets.
Before taking ENTRY on BUY or SELL Side, please know your risk levels, Stop Loss and trade EXECUTION process.
Finally:
My view is my view and remains with me only. Once you accept it and trade it, it becomes your view. So credit or blame all yours.:)
