Pivot Points [MisterMoTA]The Pivot Points indicator by MisterMoTA allow users to get pivots points calculated from last candle high, low and close on any timeframe from 1 minute to weekly.
This will help users that are trading ins small timeframes to see the pivots that are near their timeframes and not only daily timeframe.
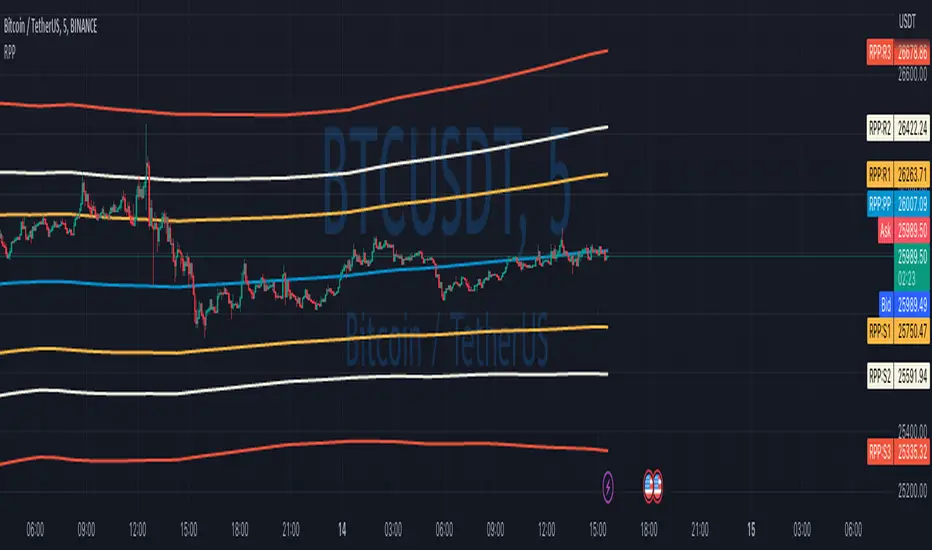
Here is an example on the chart from nex image the timeframe is set to 1 minute and pivot points displayed are at 15 minutes :
The users have control on pivots colors, pivot labels colors, text color from labels, decimal numbers displayed in the labels and style of the pivots lines.
Please follow me for other script like this one.
Kind regards,
MisterMoTA
Pivot

Double Tops & Bottoms [QuantVue]This indicator is designed to detect and plot Double Tops and Double Bottoms, by setting the initial high or low using standard pivot points.
Double Tops
A Double Top is a bearish reversal pattern, typically found when an uptrend returns back to a prior peak. It signifies a potential turning point or resistance level and could potentially reverse in direction.
The pattern is confirmed as a Double Top when the price breaks above the resistance level, but closes below it. A decisive close below this level is seen as a confirmation of the bearish trend.
Double Bottoms
A Double Bottom, on the other hand, is a bullish reversal pattern typically found after a downtrend. It signals a potential turning point or support level where the price has bottomed and could potentially reverse upwards.
The pattern is confirmed as a Double Bottom when the price breaks below the support level, but closes above it. A decisive close above this level is viewed as a confirmation of the bullish trend.
Indicator Features
🔹Double Top Detection: When a double top is identified, a downward-pointing triangle will be plotted above the bar, and if the alerts are enabled, a notification will be triggered.
🔹Double Bottom Detection: When a double bottom is identified, an upward-pointing triangle will be plotted below the bar, and if the alerts are enabled, a notification will be triggered.
🔹Pivot Lookback: Defines the number of bars to the left and right of the pivot that must be lower/higher to qualify as a pivot.
🔹Maximum Length Between Tops/Bottoms: Maximum number of bars between two tops/bottoms to be considered a double top or bottom.
🔹Style Settings: Allows the user to customize the appearance of the lines indicating the tops/bottoms. Options include color selection, line style (dotted, dashed, or solid), and line thickness.
🔹Alerts: The user can enable or disable alerts for Double Top and Double Bottom.
Give this indicator a BOOST and COMMENT your thoughts!
We hope you enjoy.
Cheers!

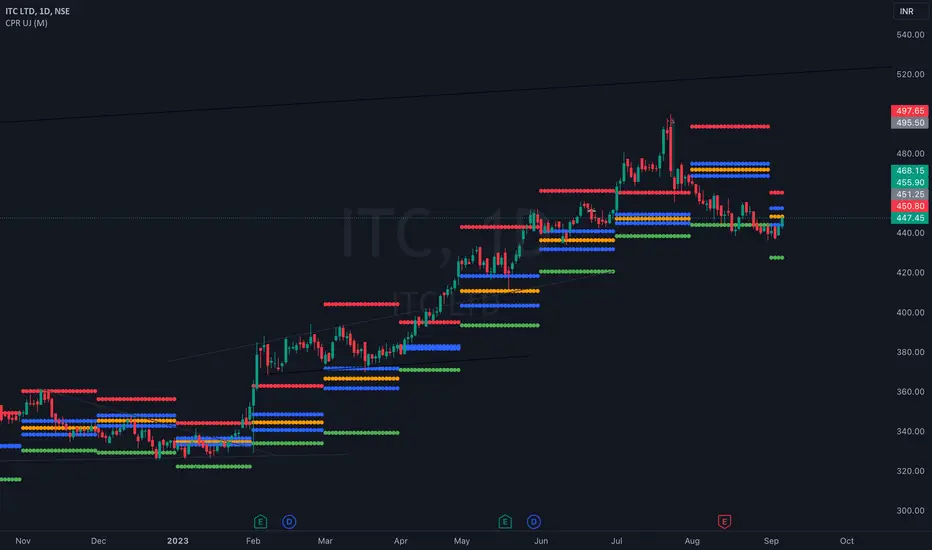
CPR UJHi i am UJ, This is Central Pivot Level which includes Daily , Weekly , Monthly Range You have to choose the range in indicator setting.
Upper red line is resistance , Lower green line is support you can buy if resistance broken , sell if support is broken go with price action or SMC confirmation which ever strategy you use indicator only indicates it wont work 100% , your accuracy will improve if you combine indicator with strategy.
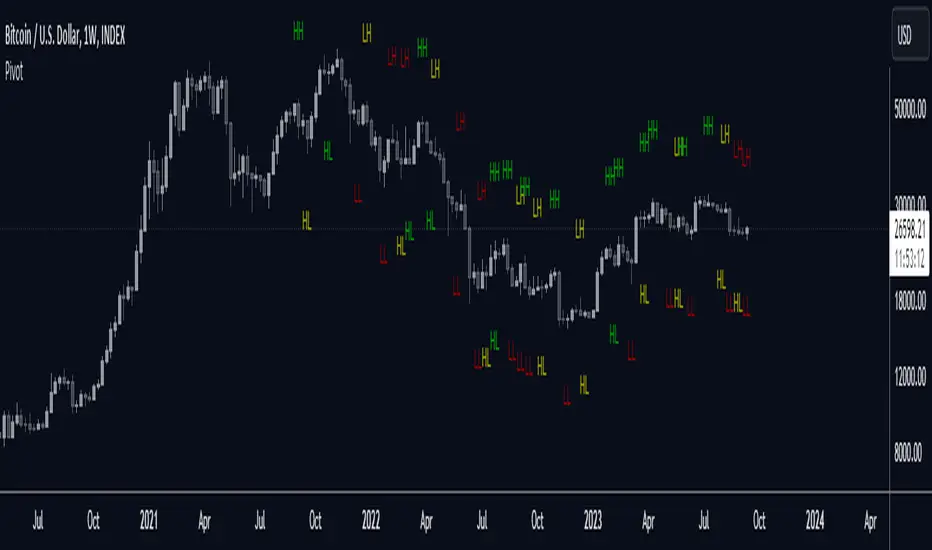
Liquidity Concepts [BigBeluga]The Liquidity Concepts indicator is designed to represent the liquidity on the chart using pivot points as potential stop-losses / liquidity grabs.
The indicator is facilitated by a market structure detector and pivot points to identify resting liquidity / stop-loss levels.
A liquidity grab or a stop-loss hunt is when retail traders place their stop-loss orders at recent highs / most recent highs or lows. This is a spot where big players attempt to push the market to trigger all the stop-loss orders and gain a better entry in their favor.
🔶 CALCULATION
The indicator uses the Higher Lower script made by @LonesomeTheBlue to determine these pivot points. When a pivot point is formed, it is displayed on the chart with the corresponding symbol (HH - HL - LH - LL). When one of these points is broken, a line is drawn between the pivot point and the candle that broke it.
A liquidity grab is only recognized after it has occurred, and it is represented with a box showing all the candles that were involved in the sweep / stop-loss hunt.
A pivot point is established only after the selected lookback period and cannot be printed beforehand in any manner. This ensures that it captures the highest point within the lookback period following the candle formation.
An HL (Higher Low) point is established when it is lower than an HH (Higher High) point, whereas an LH (Lower High) point is established when it is higher than an LL (Lower Low) point.
Boxes are formed in two different types: Major and Minor.
- Major boxes occur when LH or HL points are breached, with their high or low point crossing above or below in the specific lookback period.
- Minor boxes occur when HH or LL points are breached, with their high or low point crossing above or below in the specific lookback period.
Minor points are less efficient since they represent key highs and lows, and before taking out those liquidity levels, the HL and LH points should be cleared.
Representation of Pivot Point Formation:
Liquidity wicks are a minor representation of a stop-loss hunt during the retracement of a pivot point. This means that a pivot point is broken only by the wick and not by the entire body.
Bigger wick = more liquidity
Lower wick = less liquidity
Liquidity wicks can be used as trade confirmation or targets for your entry to enhance accuracy.
Users have the option to display candle coloring based on the currently detected trend.
🔶 VERIFICATION
Users have the option to specify the verification length for when the liquidity should occur. This means that if the length is set to 7, the indicator will search for the liquidity formation within the last 7 candles; otherwise, it will be considered invalid.
🔶 CONCEPTS
The whole idea is to help find possible zone of stop loss hunting helping having a better entry in our trading, we can utilize a lot more tools, and this shoud be used as confluence only
🔶 OPTIONS
Users have complete control over the settings, allowing them to:
- Disable pivot points.
- Disable the display of boxes.
- Disable liquidity wicks.
- Customize colors to their preferences.
- Adjust lookback settings for historical data analysis.
- Modify candle coloring settings.
- Adjust the text size of labels for better readability and customization.
🔶 RECAP
Box => Represents liquidity formation / stop-loss hunt
- Minor Box HH / LL point
- Major Box LH / HL point
Liquidity Wicks => Formed when a pivot point is broken only by the wick
BOS / CHoCH => Calculated using the pivot points from the @LonesomeTheBlue script
🔶 RELATED SCRIPTS
Price Action Concepts =>

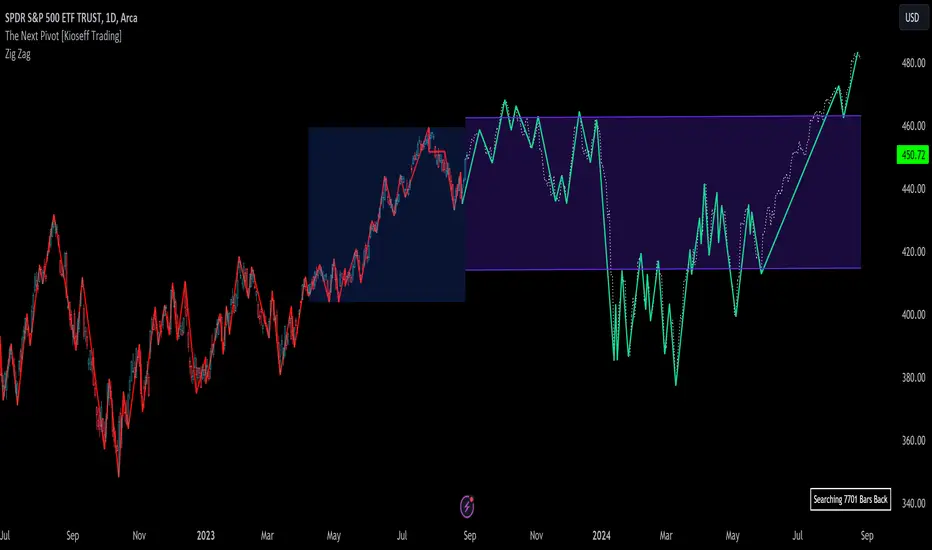
The Next Pivot [Kioseff Trading]Hello!
This script "The Next Pivot" uses various similarity measures to compare historical price sequences to the current price sequence!
Features
Find the most similar price sequence up to 100 bars from the current bar
Forecast price path up to 250 bars
Forecast ZigZag up to 250 bars
Spearmen
Pearson
Absolute Difference
Cosine Similarity
Mean Squared Error
Kendall
Forecasted linear regression channel
The image above shows/explains some of the indicator's capabilities!
The image above highlights the projected zig zag (pivots) pattern!
Colors are customizable (:
Additionally, you can plot a forecasted LinReg channel.
Should load times permit it, the script can search all bar history for a correlating sequence. This won't always be possible, contingent on the forecast length, correlation length, and the number of bars on the chart.
Reasonable Assessment
The script uses various similarity measures to find the "most similar" price sequence to what's currently happening. Once found, the subsequent price move (to the most similar sequence) is recorded and projected forward.
So,
1: Script finds most similar price sequence
2: Script takes what happened after and projects forward
While this may be useful, the projection is simply the reaction to a possible one-off "similarity" to what's currently happening. Random fluctuations are likely and, if occurring, similarities between the current price sequence and the "most similar" sequence are plausibly coincidental.
That said, if you have any ideas on cool features to add please let me know!
Thank you (:
Pivot Point SuperTrend Strategy +TrendFilterIn the dynamic world of financial markets, traders are always on the lookout for innovative strategies to identify trends and make timely trades. The "Pivot Point SuperTrend strategy +TrendFilter" has emerged as an intriguing approach, combining two popular indicators - Pivot Points and SuperTrend, while introducing an additional trend filter for added precision. This strategy draws inspiration from Lonesome TheBlue's "Pivot Point SuperTrend" script, aiming to provide traders with a reliable tool for trend following while minimizing false signals.
The Core Concept:
The strategy's foundation lies in the fusion of Pivot Points and SuperTrend indicators, and the addition of a robust trend filter. It begins by calculating Pivot Highs and Lows over a specified period, serving as crucial reference points for trend analysis. Through a weighted average calculation, these Pivot Points create a center line, refining the overall indicator.
Next, based on the center line and the Average True Range (ATR) with a user-defined Factor, upper and lower bands are generated. These bands adapt to market volatility, adding flexibility to the strategy. The heart of the "Pivot Point SuperTrend" strategy lies in accurately identifying the prevailing trend, with the indicator smoothly transitioning between bullish and bearish signals as the price interacts with the SuperTrend bands.
The additional trend filter introduced into the strategy further enhances its capabilities. This filter is based on a moving average, providing a dynamic assessment of the trend's strength and direction. By combining this trend filter with the original Pivot Point SuperTrend signals, the strategy aims to make more informed and reliable trading decisions.
Advantages of "Pivot Point SuperTrend" with Trend Filter:
1. Enhanced Precision: The incorporation of a trend filter improves the strategy's accuracy by confirming the overall trend direction before generating signals.
2. Trend Continuation: The integration of Pivot Points and SuperTrend, along with the trend filter, aims to prolong trades during strong market trends, potentially maximizing profit opportunities.
3. Reduced Whipsaws: The strategy's weighted average calculation, coupled with the trend filter, helps minimize false signals and reduces whipsaws during uncertain or sideways market conditions.
4. Support and Resistance Insights: The strategy continues to provide additional support and resistance levels based on the Pivot Points, offering valuable contextual information to traders.

Pivot Point Trend LineThis Indicator simply draw lines between high pivot points and low points.
in the code by default its used tradingview default ta.pivothigh and ta.pivotlow function to get the high and low points.
it will generate recent 4 lines of high and low pivot points.
you can change the no of days for both highs and lows pivot points.
this script is not generating any buy or sell signals its just autodraw and connect 2 pivot points. so you dont have to do it manually.

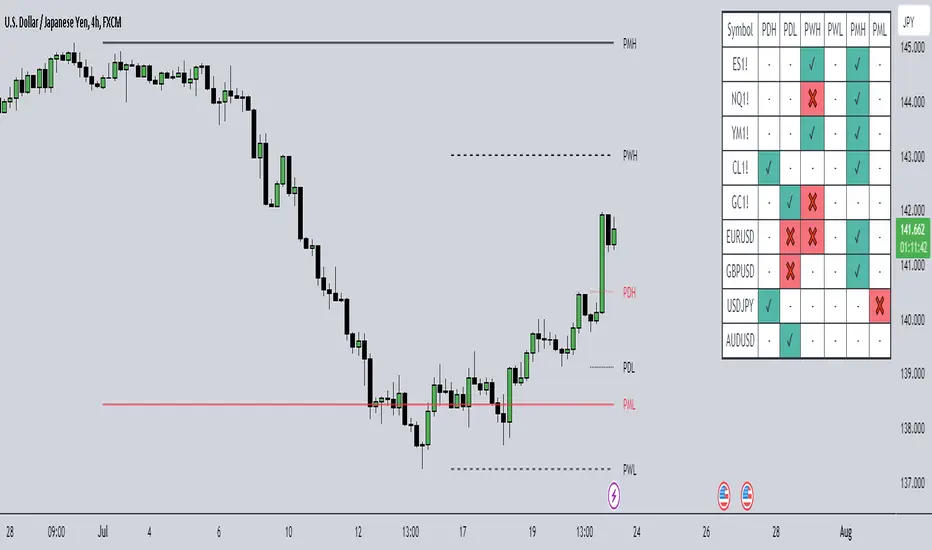
HTF Liquidity Dashboard [TFO]The purpose of this indicator is to server as a multi-symbol scanner that indicates when user-defined symbols have exceeded their previous Day/Week/Month highs and lows.
By default, the dashboard will use a compact view where the green ✔ means that price has swept and is currently exceeding the level of interest, the red ❌ implies that price swept the level but reversed back into the original range, and - indicates that the level hasn't been reached. However, the dashboard text can be toggled to show the numerical values of the highs and lows instead of these compact strings, as shown in the following image.
These levels may be shown and customized on the current chart as well via the Show Levels option. By default, levels from the selected timeframes will initially be plotted as black, and will change to red once traded through. Users can optionally increase the Session Limit parameter to show more than one previous high/low on their chart, for each selected timeframe.
Optionally, we can also plot labels to show when any of the user-defined symbols have exceeded their respective highs and lows, for any of the selected timeframes. Alerts can be created for these events as well; simply select the desired symbols and timeframes, create a new alert using this indicator, and you should be alerted when highs and lows are traded through. Note: if you encounter any issues with duplicate alerts, try deleting the alert, navigating to a lower timeframe such as the 1m, and making a new alert.
Daily Range Support & Resistance Levels [QuantVue]The Daily Range Support & Resistance Levels is an advanced analytical tool designed to assess daily price movements and provide potential support and resistance levels.
This tool examines the average daily price fluctuations over the past 150 trading days, and creates support and resistance levels based on the opening price.
The indicator also considers a standard deviation multiplier.
This enables traders and investors to identify potential price zones.
The support and resistance levels are dynamically updated every day.
Users can also choose to view previous daily levels as well.
Customizable settings for this tool include:
-Averaging Period: Adjust the number of days to calculate the average daily range.
-Standard Deviation Multiplier: Modify the standard deviation multiplier to fine-tune the sensitivity of the support and resistance levels. A higher multiplier will result in wider levels, accommodating higher price fluctuations.
-Toggle Support & Resistance Prices: Easily switch on or off the display of support and resistance price levels.
-Show Daily Open Line: Display the daily opening price as a reference point on the chart.
-Show Previous Levels: Choose whether to display past daily support and resistance levels.
Note: this indicator works best on 5 or 15 minute charts.
Give this indicator a BOOST and COMMENT your thoughts!
We hope you enjoy.
Cheers.

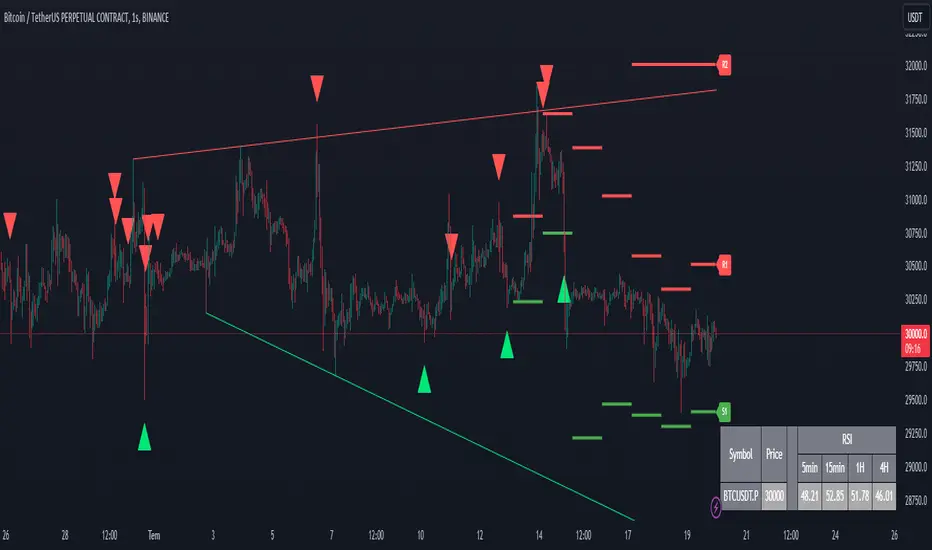
CoinFxPro Range indicator V 1.0This indicator has a structure that combines daily and weekly pivot levels, moving averages, and strength index-linked oscillators. The purpose of the indicator is designed to analyze price movements and identify potential trend reversals. Daily pivot levels are helpful in identifying critical support and resistance zones, while moving averages and oscillators indicate overbought or oversold situations in the price.
It is very simple to use and simple in appearance.
Triangular Signals appearing on the chart screen come when the price touches the daily or weekly support and resistance levels.
If you want the signals to be received less or more healthy, I added the filtering feature. In this way, you can filter the incoming signals through the volume or volatility filter, so that less signals are received.
On the other hand, the 4 timeframe rsi values of the price for daily use of the indicator are also given in the table.
You can change the RSI timeframes as you wish.
In this way, it is seen more clearly whether the signal is healthy and provides convenience while trading.
Evaluation of incoming signals;
First of all, when the signal occurs, pay attention to whether the RSI values that occur in the timeframe you trade and in other timeframes are overbought (red) or oversold (green).
When the signal comes, I buy or sell, especially if the RSI values in the 5 minutes, 15 minutes and 1 hour time periods are overbought or oversold.
If you wish, you can try a different strategy for yourself.
After the healthiest of the signals on the chart comes, the RSI values are also at overbought or oversold levels in 5-15 minutes and 1 hour timeframes and if there is a Trendline line above or below the price, it is out of that region.
A healthy buying or selling transaction can be made.
It should be noted that since risk = return, high risk means high return. High risk must be taken for high returns. Therefore, I recommend that you do not exceed 10% of your capital as margin when trading with leverage.
When trading, I always recommend trading with additional confirmation from a different indicator.
I also added a filtering feature to the indicator to block market structure related variables. Those who want to use can also use filtering.
I have added the automatic trendline for ease of trading. You can increase or decrease the number of trend lines as you wish.
I just published the indicator for daily use.
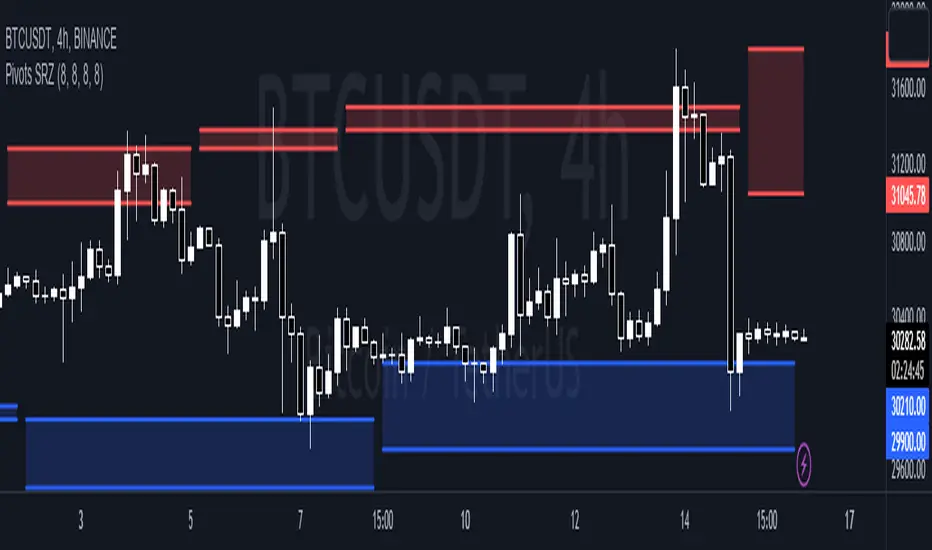
Pivots Support Resistance ZoneThis simple script base on function of Pivot High Low to plot Support and Resistance Zone on chart with detail as below:
1. Support Zone
+ New Pivot Low is plotted
+ New Pivot Low lower previous Pivot Low
+ Upper Line of Support Zone is previous Pivot Low
+ Lower Line of Support Zone is new Pivot Low
2. Resistance Zone
+ New Pivot High is plotted
+ New Pivot High higher previous Pivot High
+ Upper Line of Resistance Zone is new Pivot High
+ Lower Line of Resistance Zone is previous Pivot High
Price Legs: Average Heights; 'Smart ATR'Price Legs: Average Heights; 'Smart ATR'. Consol Range Gauge
~~ Indicator to show small and large price legs (based on short and long input pivot lengths), and calculating the average heights of these price legs; counting legs from user-input start time ~~
//Premise: Wanted to use this as something like a 'Smart ATR': where the average/typical range of a distinct & dynamic price leg could be calculated based on a user-input time interval (as opposed to standard ATR, which is simply the average range over a consistent repeating period, with no regard to market structure). My instinct is that this would be most useful for consolidated periods & range trading: giving the trader an idea of what the typical size of a price leg might be in the current market state (hence in the title, Consol Range gauge)
//Features & User inputs:
-Start time: confirm input when loading indicator by clicking on the chart. Then drag the vertical line to change start time easily.
-Large Legs (toggle on/off) and user-input pivot lookback/lookforward length (larger => larger legs)
-Small Legs (toggle on/off) and user-input pivot lookback/lookforward length (smaller => smaller legs)
-Display Stats table: toggle on/off: simple view- shows the averages of large (up & down), small (up & down), and combined (for each).
-Extended stats table: toggle on/off option to show the averages of the last 3 legs of each category (up/down/large/small/combined)
-Toggle on/off Time & Price chart text labels of price legs (time in mins/hours/days; price in $ or pips; auto assigned based on asset)
-Table position: user choice.
//Notes & tips:
-Using custom start time along with replay mode, you can select any arbitrary chunk of price for the purpose of backtesting.
-Play around with the pivot lookback lengths to find price legs most suitable to the current market regime (consolidating/trending; high volatility/ low volatility)
-Single bar price legs will never be counted: they must be at least 2 bars from H>>L or L>>H.
//Credits: Thanks to @crypto_juju for the idea of applying statistics to this simple price leg indicator.
Simple View: showing only the full averages (counting from Start time):
View showing ONLY the large legs, with Time & Price labels toggled ON:

lib_zigLibrary "lib_zig"
Object oriented implementation of ZigZag
method tostring(this, date_format)
Namespace types: Zigzag
Parameters:
this (Zigzag)
date_format (simple string)
method update(this)
Namespace types: Zigzag
Parameters:
this (Zigzag)
method draw(this, colors)
Namespace types: Zigzag
Parameters:
this (Zigzag)
colors (PivotColors type from robbatt/lib_pivot/19)
Zigzag
Fields:
max_pivots (series__integer)
hldata (|robbatt/lib_pivot/19;HLData|#OBJ)
pivots (array__|robbatt/lib_pivot/19;Pivot|#OBJ)
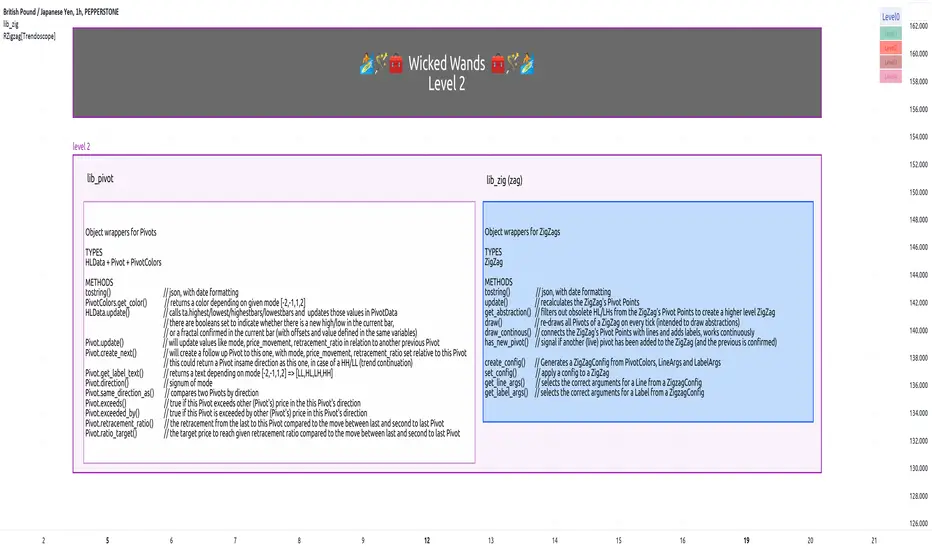
lib_pivotLibrary "lib_pivot"
Object oriented implementation of Pivot methods.
method tostring(this)
Converts HLData to a json string representation
Namespace types: HLData
Parameters:
this (HLData) : HLData
Returns: string representation of Pivot
method tostring(this, date_format)
Namespace types: Pivot
Parameters:
this (Pivot)
date_format (simple string)
method tostring(this, date_format)
Namespace types: Pivot
Parameters:
this (Pivot )
date_format (simple string)
method get_color(this, mode)
Namespace types: PivotColors
Parameters:
this (PivotColors)
mode (int)
method get_label_text(this)
Namespace types: Pivot
Parameters:
this (Pivot)
method direction(this)
Namespace types: Pivot
Parameters:
this (Pivot)
method same_direction_as(this, other)
Namespace types: Pivot
Parameters:
this (Pivot)
other (Pivot)
method exceeds(this, price)
Namespace types: Pivot
Parameters:
this (Pivot)
price (float)
method exceeds(this, other)
Namespace types: Pivot
Parameters:
this (Pivot)
other (Pivot)
method exceeded_by(this, price)
Namespace types: Pivot
Parameters:
this (Pivot)
price (float)
method exceeded_by(this, other)
Namespace types: Pivot
Parameters:
this (Pivot)
other (Pivot)
method retracement_ratio(this, lastPivot, sec_lastPivot)
Namespace types: Pivot
Parameters:
this (Pivot)
lastPivot (Pivot)
sec_lastPivot (Pivot)
ratio_target(sec_lastPivot, lastPivot, target_ratio)
Parameters:
sec_lastPivot (Pivot)
lastPivot (Pivot)
target_ratio (float)
method update(this, ref_highest, ref_lowest)
Namespace types: HLData
Parameters:
this (HLData)
ref_highest (float)
ref_lowest (float)
method update(this, bar_time, bar_idx, price, prev)
Namespace types: Pivot
Parameters:
this (Pivot)
bar_time (int)
bar_idx (int)
price (float)
prev (Pivot)
method create_next(this, bar_time, bar_idx, price)
Namespace types: Pivot
Parameters:
this (Pivot)
bar_time (int)
bar_idx (int)
price (float)
HLData
HLData wraps the data received from ta.highest, ta.highestbars, ta.lowest, ta.lowestbars, as well as the reference sources
Fields:
length (series int) : lookback length for pivot points
highest_offset (series int) : offset to highest value bar
lowest_offset (series int) : offset to lowest value bar
highest (series float) : highest value within lookback bars
lowest (series float) : lowest value within lookback bars
new_highest (series bool) : update() will set this true if the current candle forms a new highest high at the last (current) bar of set period (length)
new_lowest (series bool) : update() will set this true if the current candle forms a new lowest low at the last (current) bar of set period (length)
new_highest_fractal (series bool) : update() will set this true if the current candle forms a new fractal high at the center of set period (length)
new_lowest_fractal (series bool) : update() will set this true if the current candle forms a new fractal low at the center of set period (length)
PivotColors
Pivot colors for different modes
Fields:
hh (series color) : Color for Pivot mode 2 (HH)
lh (series color) : Color for Pivot mode 1 (LH)
hl (series color) : Color for Pivot mode -1 (HL)
ll (series color) : Color for Pivot mode -2 (LL)
Pivot
Pivot additional pivot data around basic Point
Fields:
point (Point type from robbatt/lib_plot_objects/5)
mode (series int) : can be -2/-1/1/2 for LL/HL/LH/HH
price_movement (series float) : The price difference between this and the previous pivot point in the opposite direction
retracement_ratio (series float) : The ratio between this price_movement and the previous
prev (Pivot)

Pivot HL Trading SetupThis simple script base on function of Pivot High Low to plot Trading Setup on chart with detail as below:
2. Trading Setup
2.1 Buy setup
+ New Pivot Low is plotted
+ Entry Long at market price.
+ Stoploss at Pivot Low
+ Takeprofit at Pivot High
+ Buy setup invalidation when price crossed Pivot High or Pivot Low
2.1 Sell setup
+ New Pivot High is plotted
+ Entry Short at market price.
+ Stoploss at Pivot High
+ Takeprofit at Pivot Low
+ Sell setup invalidation when price crossed Pivot High or Pivot Low

[MAD] Support / ResistanceSupport/Resistance - Multi-Timeframe Data Plotter
This Pine Script indicator provides users with the ability to analyze various technical indicators, including Bollinger Bands, Simple Moving Averages (SMA), Exponential Moving Averages (EMA), and Pivot Points, across different timeframes. It visually represents these indicators on the chart, allowing for comprehensive analysis.
Key Features:
Bollinger Bands: The indicator supports 6 different timeframes for Bollinger Bands. Users can customize the length of the Bollinger Bands for each timeframe and choose whether to display levels and plots.
Simple Moving Averages (SMA): The indicator supports 4 different timeframes for SMAs. Users can define custom lengths for the SMAs and choose which ones to display on the chart or in the S/R Screen.
Exponential Moving Averages (EMA): Similar to SMAs, the indicator supports 4 different timeframes for EMAs. Users can define custom lengths for the EMAs and choose which ones to display on the chart or in the S/R Screen.
Pivot Points: The indicator supports 4 different timeframes for Pivot Points. Users can choose between Traditional and Fibonacci calculation methods and customize the appearance of the pivot levels.
Global Switches: Users have the option to enable or disable the display of pivots, Bollinger Bands, SMAs, EMAs, open/close/high/low values, horizon plot, and VPR-style plot (weighted Gaussian addition).
Plot Limitation: Users can limit the plotting of support and resistance lines by specifying a percentage up/down.
This indicator offers extensive customization and flexibility, allowing users to analyze the market using these technical indicators across multiple timeframes.
Please refer to this screenshot for an overview of all available settings:
Additionally, the indicator includes a multiplot-chartselect feature to address the limitation of 32 data streams with colors. This feature enables the selection of 10 SMAs or EMAs from different timeframes, along with 3 timeframes of Bollinger Bands and the daily open/close values, all in a single packed indicator. Here is an example of how the data can be displayed:
Enabling all features simultaneously may result in visual overload. However, for users who wish to view specific indicators, this indicator provides all the necessary options. Please refer to this screenshot for an example of various indicators displayed:
To enhance visibility, all lines are weighted, and line and label positions can be dynamically shifted based on these weights.

Price Action Box RetracementsThe Price Action Box Retracements Indicator offers a fresh perspective on price analysis, departing from the conventional fixed-length lookback period commonly used in trading indicators. This indicator embraces a more flexible and adaptable approach, taking into account changes in price action behavior and avoiding overfitting. With a design philosophy rooted in the principle of "Keep it simple, stupid!" (KISS), this indicator allows users to customize just one variable: Price Box Size.
Imagine the price action as a journey within a box or channel, defined by significant pivots from the past that act as support and resistance levels. The Price Action Box Retracements Indicator visualizes the midpoints between these pivots, representing half-point retracements. By adjusting the "Price Box Size" variable, users can select the size of the price action box that the script will identify on the chart. A larger value will look for a larger box/channel, meaning the price will stay within it for a longer duration. Think of it as switching to a slower timeframe without changing the chart resolution.
The indicator plots a median line within the price action box, which changes color based on the position of the price action within the box. When the price action is trading below the median, the line is displayed in red, indicating a potential for short entries. Conversely, when the price action is above the box median, the line turns green, suggesting opportunities for long entries. An orange color is used when the price action breaks outside the box, signaling the start of a new trend or a measured move where the box size is expected to double.
Sudden changes in the median location are crucial signals that the price action has broken outside its previous box and created a new one. Usually, the price action will attempt to return back and test its old box boundaries or median (support/resistance) before continuing further. If the new box is positioned above the previous one, it indicates an upward channel (uptrend), while a box below the previous one suggests a descending channel (downtrend). A flat median line represents a ranging market, where the price action lacks a clear directional bias.
In addition to the median plot, the script also offers a pivot-anchored moving average, assisting traders in identifying smaller trends and potential entry points within a larger price action box.
Experience a new approach to price analysis with the Price Action Box Retracements Indicator and enhance your trading strategies with simplicity and flexibility.
K's Pivot PointsPivot points are a popular technical analysis tool used by traders to identify potential levels of support and resistance in a given timeframe. Pivot points are derived from previous price action and are used to estimate potential price levels where an asset may experience a reversal, breakout, or significant price movement.
The calculation of pivot points involves a simple formula that takes into account the high, low, and close prices from the previous trading session or a specific period. The most commonly used pivot point calculation method is the "Standard" or "Classic" method. Here's the formula:
Pivot Point (P) = (High + Low + Close) / 3
In addition to the pivot point itself, several support and resistance levels are calculated based on the pivot point value.
K's Pivot Points try to enhance them by incorporating multiple elements and by applying a re-integration strategy to validate two events:
* Found_Support: This event represents a basing market that is bound to recover or at least shape a bounce.
* Found_Resistance: This event represents a toppish market that is bound to consolidate or at least shape a pause.
K's Pivot Points are calculated following these steps:
1. Calculate the highest of highs for the previous 24 periods (preferably hours).
2. Calculate the lowest of lows for the previous 24 periods (preferably hours).
3. Calculate a 24-period (preferably hours) moving average of the close price.
4. Calculate K's Pivot Point as the average between the three previous step.
5. To find the support, use this formula: Support = (Lowest K's pivot point of the last 12 periods * 2) - Step 1
6. To find the resistance, use this formula: Resistance = (Highest K's pivot point of the last 12 periods * 2) - Step 2
The re-integration strategy to find support and resistance areas is as follows:
* A support has been found if the market breaks the support and shapes a close above it afterwards.
* A resistance has been found if the market surpasses the resistance and shapes a close below it afterwards.
The lookback period (whether 24 and 12) can be modified but the default versions work well.

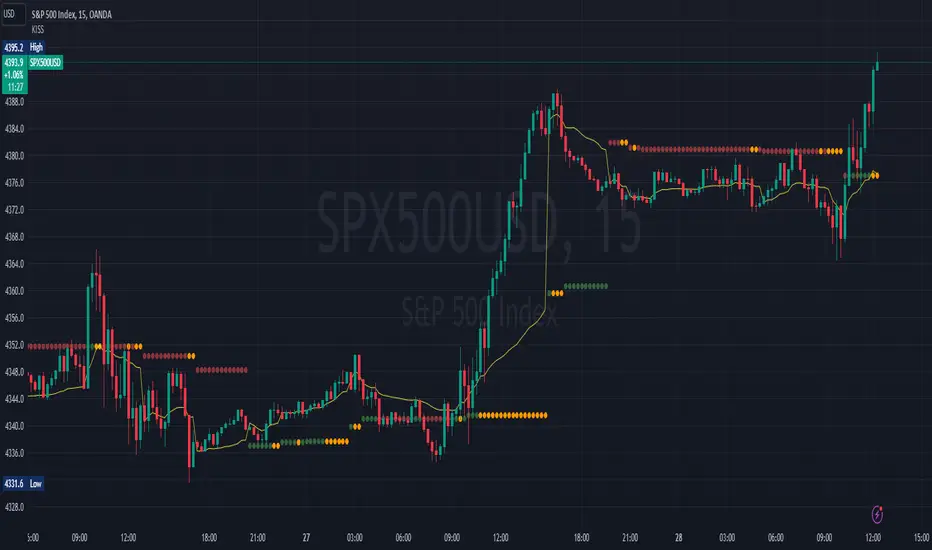
ICT Killzones + Pivots [TFO]Designed with the help of TTrades and with inspiration from the ICT Everything indicator by coldbrewrosh, the purpose of this script is to identify ICT Killzones while also storing their highs and lows for future reference, until traded through.
There are 5 Killzones / sessions whose times and labels can all be changed to one's liking. Some prefer slight alterations to traditional ICT Killzones, or use different time windows altogether. Either way, the sessions are fully customizable. The sessions will auto fit to keep track of the highs and lows made during their respective times, and these pivots will be extended until they are invalidated.
There are also 4 optional Open Price lines and 4 vertical Timestamps, where the user can change the time and style of each one as well.
To help maintain a clean chart, we can implement a Cutoff Time where all drawings will stop extending past a certain point. The indicator will apply this logic by default, as it can get messy with multiple drawings starting and stopping throughout the day at different times.
Given the amount of interest I've received about this indicator, I intend to leave it open to suggestions for further improvements. Let me know what you think & what you want to see added!

lib_trackingLibrary "lib_tracking"
tracking highest and lowest with anchor point to track over dynamic periods, e.g. to track a Session HH/LL live and get the bar/time of the LTF wick that matches the HTF HH/LL
// DESIGN DECISION
// why anchored replacements for ta.highest / ta.highestbars / ta.lowest / ta.lowestbars:
// 1. they require a fixed length/lookback which makes it easier to calculate, but
// 2. this prevents us from tracking the HH/LL of a changing timeframe, e.g. live tracking the HH/LL of a running session or unfinished higher timeframe
// 3. tracking with anchor/start/reset flag allows to persist values until the next start/reset, so no other external storage is required
track_highest(value, reset, track_this_bar)
Parameters:
value (float)
reset (bool) : boolean flag to restart tracking from this point (a.k.a anchor)
track_this_bar (bool) : allows enabling and disabling of tracking, e.g. before a session starts or after it ends, values can be kept until next reset.
track_lowest(value, reset, track_this_bar)
Parameters:
value (float)
reset (bool) : boolean flag to restart tracking from this point (a.k.a anchor)
track_this_bar (bool) : allows enabling and disabling of tracking, e.g. before a session starts or after it ends, values can be kept until next reset.
track_hl_htf(htf, value_high, value_low)
Parameters:
htf (string) : the higher timeframe in pinescript string notation
value_high (float)
value_low (float)
Returns:

PivotLibrary "Pivot"
This library helps you store and manage pivots.
bias(isHigh, isHigher, prevWasHigher)
Helper function to calculate bias.
Parameters:
isHigh (bool) : (bool) Wether the pivot is a pivot high or not.
isHigher (bool) : (bool) Wether the pivot is a higher pivot or not.
@return (bool) The bias (true = bullish, false = bearish, na = neutral).
prevWasHigher (bool)
biasToString(bias)
Parameters:
bias (bool)
biasToColor(bias, theme)
Parameters:
bias (bool)
theme (Theme)
nameString(isHigh, isHigher)
Parameters:
isHigh (bool)
isHigher (bool)
abbrString(isHigh, isHigher)
Parameters:
isHigh (bool)
isHigher (bool)
tooltipString(y, isHigh, isHigher, bias, theme)
Parameters:
y (float)
isHigh (bool)
isHigher (bool)
bias (bool)
theme (Theme)
createLabel(x, y, isHigh, isHigher, prevWasHigher, settings)
Parameters:
x (int)
y (float)
isHigh (bool)
isHigher (bool)
prevWasHigher (bool)
settings (Settings)
new(x, y, isHigh, isHigher, settings)
Parameters:
x (int)
y (float)
isHigh (bool)
isHigher (bool)
settings (Settings)
newArray(size, initialValue)
Parameters:
size (int)
initialValue (Pivot)
method getFirst(this)
Namespace types: Pivot
Parameters:
this (Pivot )
method getLast(this, isHigh)
Namespace types: Pivot
Parameters:
this (Pivot )
isHigh (bool)
method getLastHigh(this)
Namespace types: Pivot
Parameters:
this (Pivot )
method getLastLow(this)
Namespace types: Pivot
Parameters:
this (Pivot )
method getPrev(this, numBack, isHigh)
Namespace types: Pivot
Parameters:
this (Pivot )
numBack (int)
isHigh (bool)
method getPrevHigh(this, numBack)
Namespace types: Pivot
Parameters:
this (Pivot )
numBack (int)
method getPrevLow(this, numBack)
Namespace types: Pivot
Parameters:
this (Pivot )
numBack (int)
method getText(this)
Namespace types: Pivot
Parameters:
this (Pivot)
method setX(this, value)
Namespace types: Pivot
Parameters:
this (Pivot)
value (int)
method setY(this, value)
Namespace types: Pivot
Parameters:
this (Pivot)
value (float)
method setXY(this, x, y)
Namespace types: Pivot
Parameters:
this (Pivot)
x (int)
y (float)
method setBias(this, value)
Namespace types: Pivot
Parameters:
this (Pivot)
value (int)
method setColor(this, value)
Namespace types: Pivot
Parameters:
this (Pivot)
value (color)
method setText(this, value)
Namespace types: Pivot
Parameters:
this (Pivot)
value (string)
method add(this, pivot)
Namespace types: Pivot
Parameters:
this (Pivot )
pivot (Pivot)
method updateLast(this, y, settings)
Namespace types: Pivot
Parameters:
this (Pivot )
y (float)
settings (Settings)
method update(this, y, isHigh, settings)
Namespace types: Pivot
Parameters:
this (Pivot )
y (float)
isHigh (bool)
settings (Settings)
Pivot
Stores Pivot data.
Fields:
x (series int)
y (series float)
isHigh (series bool)
isHigher (series bool)
bias (series bool)
lb (series label)
Theme
Attributes for customizable look and feel.
Fields:
size (series string)
colorDefault (series color)
colorNeutral (series color)
colorBullish (series color)
colorBearish (series color)
colored (series bool)
showTooltips (series bool)
showTooltipName (series bool)
showTooltipValue (series bool)
showTooltipBias (series bool)
Settings
All settings for the pivot.
Fields:
theme (Theme)
Rolling Pivot PointsStandard Pivot Points are calculated from the previous day’s (week/month/year) close/low/high values. But what is the day close for cryptocurrencies trading 24/7 on exchange? Does it make sense to use a specific time price as a close if it continues trading after that?
So I solved that issue with Rolling Pivot Points, where I calculate pivot points not at the end of the period but for every bar on a rolling basis. Every time I recalculate pivot points, I look at a window of period length in bars and base my calculations on these bars. This way, you get smooth pivot points changing with every bar, and it should better represent support and resistance for the price.
In this indicator, I implement three types of pivot points.
Camarilla
Fibonacci
Traditional
In terms of period, you can select any one you want. If you’ll keep Auto Indicator well, compute period automatically. For two days, for example, use ‘Day’ in Period and 2 in Period Mult parameters.
You can also change the type of MA used to smooth Pivot Points.
Disclaimer
Please remember that past performance may not be indicative of future results.
Due to various factors, including changing market conditions, the strategy may perform less well than in historical backtesting.
This post and the script don’t provide any financial advice.
Supply and Demand Deluxe (Stock Justice)Introducing " Supply and Demand Deluxe (Stock Justice) " - the ultimate TradingView indicator that revolutionizes how traders identify crucial supply and demand levels. With its unrivaled capabilities across multiple timeframes, this indicator offers a comprehensive toolkit for traders seeking an edge in the market.
To fully harness the power of "Supply and Demand Deluxe," traders can fine-tune the indicator's input parameters to suit their preferences and trading strategies. Let's delve into the key components and functionalities that make this indicator truly exceptional:
Daily and Weekly Pivots :
The indicator empowers you to plot vital reference points, including the previous week's high and low, yesterday's high and low, and the midpoint of yesterday's range. These plots provide invaluable insights into market sentiment and potential turning points.
Weekly Supply and Demand Levels :
Regardless of what timeframe you are looking at, this indicator allows you to unlock the ability to plot weekly supply and demand levels directly on your chart. Enjoy the freedom to customize the number of levels to plot, choose line colors and styles, and decide whether to extend the lines. For a more comprehensive analysis, enable the "Show Price" option to view the associated prices.
Daily Supply and Demand Levels :
Similar to the weekly levels, this feature allows you to plot daily supply and demand levels with ease. Tailor the number of levels, line colors, and styles to your preferences. The "Extend Left" and "Extend Right" options provide flexibility in determining whether the lines extend to the left, right, or both. Enable the "Show Price" option to display the corresponding prices, enhancing your decision-making process.
Hourly Supply and Demand Levels :
Effortlessly plot hourly supply and demand levels on your chart. The indicator automatically identifies these levels based on the highest and lowest values of previous ranges. Customize the number of levels, line colors, and styles to match your visual preferences. As with the previous features, you can display prices associated with these levels, amplifying your trading insights.
ATR Expected Moves :
Gain a deeper understanding of potential price moves with the ATR Expected Moves feature. Based on the Average True Range (ATR), this functionality allows you to plot expected price ranges. Adjust the lookback length and multipliers to fine-tune the calculation according to your trading style. With the flexibility to extend lines, choose colors and line styles, and display prices, you can adapt the indicator to your specific needs.
Futures Levels :
For futures traders, "Supply and Demand Deluxe" provides specific levels for the Midnight Open, London Open, Asian Open, and the 8:30am EST level. These pre-defined levels act as valuable reference points, enabling you to navigate futures markets with confidence.
By incorporating these cutting-edge features, the Supply and Demand Deluxe indicator by Stock Justice empowers traders to identify key supply and demand levels across various timeframes. Its customizable visual elements and adaptable parameters allow traders to align the indicator with their unique trading strategies, amplifying their potential for success.
////////////////////////
UNIQUENESS
////////////////////////
This one-of-a-kind indicator stands out from existing tools in the market due to its unparalleled combination of features and customization options. While other indicators may focus on specific aspects of supply and demand analysis, "Supply and Demand Deluxe (Stock Justice)" brings together a comprehensive suite of tools that cater to traders across various timeframes. From daily and weekly pivots to hourly supply and demand levels, this indicator covers a wide range of trading scenarios, allowing users to gain a holistic view of market dynamics.
What truly sets "Supply and Demand Deluxe" apart is the fact that it is its emphasis on customization. Traders have the freedom to fine-tune every aspect of the indicator, from the number of plotted levels to the colors, line styles, and extension options. By providing such extensive customization capabilities, this indicator enables traders to align it precisely with their unique trading strategies and preferences. Whether you're an aggressive short-term trader or a patient long-term investor, "Supply and Demand Deluxe" adapts to your individual style, empowering you to make well-informed trading decisions.
Furthermore, the incorporation of the ATR Expected Moves feature adds an extra layer of sophistication to this indicator. By leveraging the Average True Range, traders can gain insights into expected price ranges, enhancing their risk management and trade planning. The ability to adjust the lookback length and multipliers ensures that traders can adapt the ATR calculations to suit their desired level of precision. This feature, combined with the indicator's visual plots and customizable elements, sets "Supply and Demand Deluxe (Stock Justice)" in a league of its own, providing traders with an edge in understanding and navigating the market.
In summary, the uniqueness of "Supply and Demand Deluxe (Stock Justice)" lies in its comprehensive approach to supply and demand analysis, its extensive customization options, and the incorporation of the ATR Expected Moves feature. With its ability to cater to traders across various timeframes and adapt to individual trading styles, this indicator empowers users to unlock the full potential of supply and demand analysis and make informed trading decisions with confidence.
////////////////////////
Embrace the future of trading with "Supply and Demand Deluxe (Stock Justice)" and unleash the full potential of supply and demand analysis in your trading endeavors. Elevate your trading journey with this game-changing indicator.
