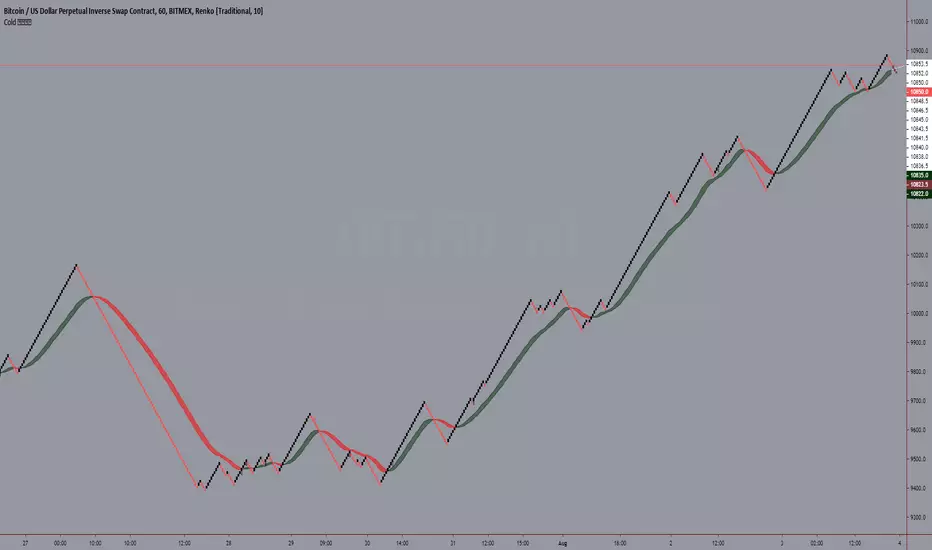
Cold 𝕃𝔼𝔾𝕆MA Ribbon
An Attempt For Smoother trend
Optional next candle forecaster for ma and its signal
Optional MA from coloring experimentation
Renko
Renko Plot StrategyThis strategy lets you plot Renko open and close values, based on your preferred Renko size brick, on normal candle chart. You can use it on any timeframe, define your preferred brick size and trailing stop.


Renko Overlay RibbonThis script has been moved to protected from this location
due to mishandling on multiple trading platforms. Since I have proprietary strategies built on this code, it has caused me to make it protected. This is not an Invite Only script anyone can use it, however the source code is no longer visible.
All calculations are performed against calculated Renko bricks form a price chart. The engine that drives this script is complex, but robust. It attempts to garner the order of nested Renko bricks inside a time candle when multiple bricks are produced. I call these "volatile bricks". In a normal Renko chart where tick data is used, this would be displayed as rapid brick production on the screen.
It is important to choose an appropriate time frame when in Traditional mode. Setting the ribbon to 1 pip on EURUSD using a Day chart is not wise, because there is no way to know just how many 1 pip bricks were produced and in which up/down sequence. ATR mode is different because the bricks are constantly changing in size, adapting to the current ATR of the chart time interval.
Please view these old videos taken from the original page for questions on why this indicator was created in the first place:
My strategy built on this indicator can be found here:
Multiple indicators based on renko bricks on time charts can be found here (they also work on renko charts in Trading View). These are special scripts that use this indicator as the engine to generate indicators "as if" you were operating on a Renko chart.
PM for questions, enjoy.

Ma'RenkoMa'Renko is simple, yet powerful trading system designed to help scalpers who use Renko charts (including ATR-based, but it should work with any type of candles as well). The thickness of color bands represents different trend characteristics (mostly volume and speed of price changing) which allow a trader to filter out false pivot points, enter and exit more wisely. The chart speaks for itself.

[ssabu] Renko Chart✅ Renko Chart Indicator
실시간으로 캔들 차트를 렌코차트로 바꿔서 배경에 렌코차트를 자동으로 그려주는 인디케이터 입니다.
It is an indicator that automatically draws a Renko chart in the background by changing the candle chart to a Renko chart in real time.
위의 사진은 캔들차트를 렌코로 바꾸고 해당 인디케이터를 적용한 스크린샷
Above picture is a screenshot of changing the candle chart to Renko and applying the indicator

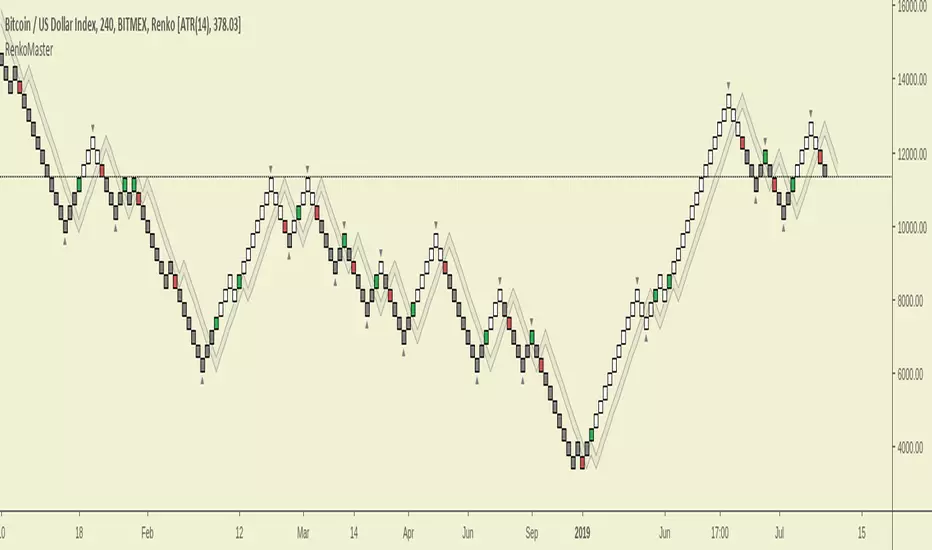
RenkoMasterRenkoMaster is a variant of our popular TrendMaster Script with adjusted parameters. It can be used to provide confluence when determining Renko entries and exits.
Setting Up The Indicator
After purchase, open the TradingView indicator library. Under the Invite-Only Scripts section, you will see RenkoMaster. Add it to your chart. Next, you must customise your theme settings to allow RenkoMaster to take over control of your candle colours. You can find a complete set-up tutorial on our website.
Candle Colours
By default, RenkoMaster will colour your candles in black and white. White candles indicate an uptrend in an asset and the candles will not change colour until the trend has reversed and a counter-trend signal has been printed. Black candles indicate a downtrend, they will remain black until a counter-trend long signal candle has been printed.
Signal candles
A signal candle is printed when the price of an asset closes above or below the moving average cloud and the medium term trend moving average. By requiring two criteria for a single candle to print we will see a drastic reduction in the number of false signals.
The RenkoMaster entry technique further reduces the likelihood of false entries. To enter a trade we do not buy the signal block immediately. Instead, we treat the signal block as an indication that a trend change is possible. We want to see confirmation of this trend before making an entry. To enter we place a pending order a few ticks above or below the high or low of the signal block. By doing this we only enter a trade when the asset has shown a continuation in the direction of the suggested trend change.
Our Story
Founded in 2018 by IchimokuScholar and C00kie, TrendMaster is a team that produces technical analysis indicators with an emphasis on simplicity and noise reduction. We support a large community with educational content, automated market scanners and mentoring in our private chat rooms. We produce technical analysis indicators geared primarily towards the emerging Cryptocurrency asset class. We provide educational material to assist trader development and host a large online trend following community. All of our products are designed to help traders distinguish relevant information from background noise. Our indicators encourage disciplined trade management to maximise the opportunity captured while minimising losses.
IchimokuScholar
IchimokuScholar – In 2017 I retired from a career in higher education to focus on Trading. I like to trade long term trends, focusing primarily on continuation setups. I am dedicated to sharing my knowledge of trading and take great pleasure in simplifying technical analysis for newer traders.
C00kie
I started trading crypto in 2017 and immediately started coding a bunch of tools to improve my quality of life. Some definitely worked out better than others. Like to trade the higher timeframes and drawing horizontal lines on charts. I am also pretty much obligated to like cookies.
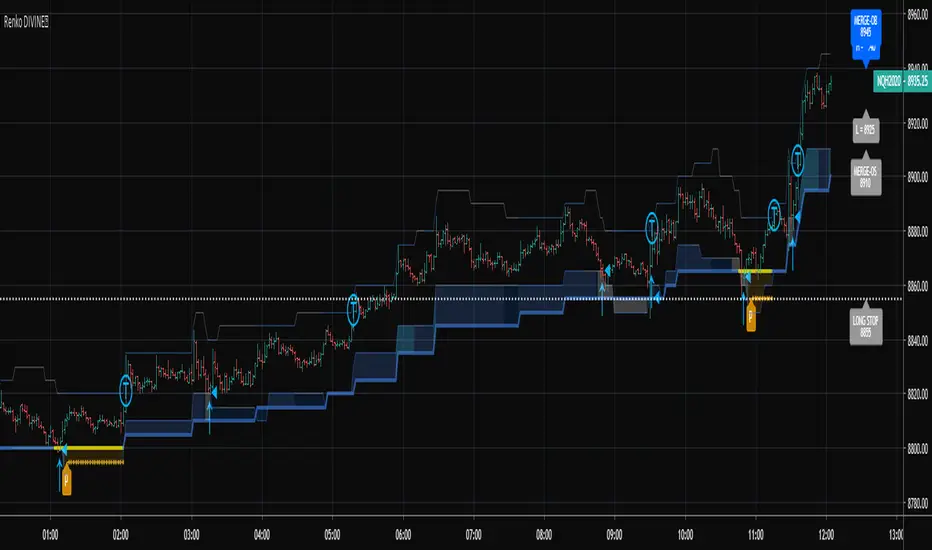
Renko Weis Wave VolumeA volume bulls vs bears power indicator that is based entirely on Wyckoff Weis Wave Volume trends. This indicator is part of my DIVINE series RENKO indicators that run on an engine capable of extracting Renko brick information from a time series. As with the Renko RSI and Renko Trend Momentum indicators, swapping between Renko and time series type charts(bar, candlestick , heikin ashi) is seamless.
The algorithm uses the cumulative volume sum during the lifetime of a Renko brick formation. It tries hard to dissect and distribute volume when multiple bricks are formed during a single time candle (bar, candlestick , heikin ashi). Both positive and negative volume are plotted simultaneously, so that any instance where multiple bricks are created in a single time candle, positive and negative volume will be shown.
4 color themes as with all of the other DIVINE series indicators and strategies.
Shows ares of accumulation, distribution, capitulation. volatility .
Shows volatile brick locations with counts that indicate the number of nested bricks that were contained in a single time based candle.
Works well with Renko Price Bars Overlay script.
Reference to explanation of volatile brick information tips.
All feature requests are welcome. PM for access.

Renkomonster, v. 5.0RenkoMonster Elite
A radical redesign of our other approaches, RenkoMonster uses deep algorithmic and pattern tracking against standard systems to produce trade logic with the quietest, most actionable, signal-to-noise certainty. Designing around the right parameters brings the best results, and for investment instruments, that means focusing on market-mirroring mathematics that produce profits. Note, however, that focus on profits also means building an engine that maximizes for return, not some abstract percentage of right guesses. RenkoMonster is therefore built to enter every high-probability trade, then evaluate ongoing metrics to stay with a winner as long as possible, but also recognizing the need to exit quickly as soon as high-probability failure signals arise. The result: consistent winning trades, but, more importantly, immense profit-to-loss ratios that bring a superior payoff. RenkoMonster keeps you in the game to catch the huge runs that bring the big returns. (see Results Chart below) A premium trading system for the discerning investor seeking robust, effortless results across a range of asset classes, contact us for a free trial to test RenkoMonster on your favorite charts.
Results Chart
The backtests below show 1-year returns against a Buy and Hold (B+H) approach for 40 of the world’s top traded instruments (as measured by price volume or similar indicator). The RenkoMonster system was run on the top 10 instruments in four major markets: Equities, ETFs, Cryptocurrencies, and Forex. All tests were on a 30min chart, set to Renko “Traditional” blocks (because TradingView does not support realtime alerts from ATR-based charts). Block size was set proportionately to price to give the instrument positive results, but there was no “cherry-picking”. (In fact, changing time frames would have produced even better returns in some cases, but it seemed best to use a consistent measure.) Subscribers to the system receive a full, step-by-step breakdown on how to customize the parameters to get the best from their favorite markets.
(For each instrument, you see listed its Symbol (name), Profit % (annual return using RenkoMonster), Winning Trade % (being “right”), ProfitFactor (Ratio of money won to money lost), Max Draw Down % (point of worst % loss during the year), and B+H (how much the asset would have returned with no trades, via "buy-and-hold" )...)
RenkoMonste
Settings: 30 min, Traditional Renko box, over 1 year (June 1, 2018 - June 1, 2019)
EQUITIES
Symbol._.Profit Profit %._.Trade %._.Pf Max DrDn._.B + H
AMZN._.._.9,935._.._.._.._.66._.._..9.4._.._.._.1._.._.._.7
AAPL._.._.._318._.._.._.._.54._.._.._7.4._.._.._.2._.._.._.5
TSLA._.._32,777._.._.._.._.60._.._.._7.8._.._.._.2._.._.(-38)
FB._.._.._.._371._.._.._.._.46._.._.._5.4._.._.._.3._.._..(-7)
BABA._.._.._671._.._.._.._.55._.._.._6.3._.._.._.2._.._.(-23)
BYND._.._.._499._.._.._.._.67._.._..24._.._.._.._1._.._.140
MSFT._.._.._.271._.._.._.._.52._.._.._6.5._.._.._.2._.._..28
AMD._.._.._..539._.._.._.._.48._.._.._4.1._.._...13._.._.._0
NFLX._.._..8,695._.._.._.._.57._.._.._.7.4._.._.._2._.._.(-5)
BA._.._.._.1,448._.._.._.._..57._.._.._7.9._.._.._1._.._..97
ETFs
Symbol._.Profit %._.Trade %._.Pf._.Max DrDn._.B + H
SPY._.._.._.775._.._..66._.._..9.7._.._.1._.._.._.4
QQQ._.._.2,918._.._..66._.._.11._.._..1._.._.._.5
EEM._.._.._.463._.._..60._.._..7.1._.._.1._.._.._0
IWM._.._..2,060._.._..62._.._..9.1._.._.1._.._.(-3)
HYG._.._.._..18._.._..45._.._..2.2._.._.1._.._.._0.5
EWZ._.._.10,426._.._..62._...11._.._.._1._.._..26
LQD._.._.._..12._.._.._45._.._.2.3._.._.1._.._.._6
EFA._.._.._.236._.._.._52._.._.6.2._.._.1._.._..(-7)
FXI._.._.._..900._.._.._62._.._.8.3._.._.1._.._.(-15)
XLF._.._.._..393._.._...60._.._.6.8._.._.1._.._..(-3)
CRYPTOCURRENCIES
Symbol._.._.Profit %._.._.Trade %._.Pf._.Max DrDn._.B + H
BTC/USD._.100 million._.._.58._.._.12._.._.2._.._.._.(-8)
ETH/USD._.232 million._.._.54._.._..6.2._..4._.._.._(-54)
XRP/USD._.840 million._.._.52._.._..7._.._.4._.._.._(-21)
LTC/USD._.14 million._.._..51._.._..6.5._..5._.._.._..13
BCH/USD._.17 million._.._.51._.._..6._.._15._.._.._.(-5)
EOS/USD._.5 million._.._..49._.._..5.3._.._7._.._.._..13
BNB/USDT._.4 billion._.._..56._...15._.._..4.._.._.._128
BSV/USD._.299,000._.._.._.67._..109._.._..2._.._.._.(-8)
XLM/USD._.94 billion._.._..64._.._11._.._..3._.._.._..34
ADA/USD._.647,000._.._.._75._.._34._.._..1._.._.._.._3
FOREX PAIRS
Symbol._.._.Profit %._.Trade %._.Pf._.Max DrDn._.B + H
EUR/USD._.._.17._.._.._.37._.._.1.5._.._.2._.._.._.(-4)
USD/JPY._.._..9._.._.._..34._.._.1.2._.._.3._.._.._.(-1)
AUD/USD._.._.35._.._.._.45._.._.2.1._.._.2._.._.._.10
USD/CAD._.._.13._.._.._.35._.._.1.4._.._.3._.._.._..3
GBP/USD._.._.46._.._.._.38._.._.1.8._.._.3._.._.._.(-5)
NZD/USD._.._.39._.._.._.50._.._.2.6._.._.1._.._.._.(-6)
GBP/JPY._.._.66._.._.._.39._.._.1.9._.._.2._.._.._.(-6)
EUR/JPY._.._.25._.._.._.45._.._.2.1._.._.3._.._.._.(-5)
AUD/JPY._.._.65._.._.._.36._.._.1.9._.._.2._.._.._(-10)
EUR/GBP._.._.25._.._.._.45._.._.2.1._.._.3._.._.._..0.1

Renko Ghost, v. 2.0Renko Ghost
Custom-designed to take advantage of the smoothing signals from Renko charting, Renko Ghost creates client-side ATR calculations to build an overlay of “ghost” Renko blocks which emulate the popular ATR blocks on top of TradingView’s Traditional Renko charts. By combining constant ATR updates with the “trend anticipation” patterning of our other systems, Renko Ghost can deliver more responsive, finely-tuned reads on market turns. (Check out results below) Contact us for a free trial to test Renko Ghost on your go-to charts. And be sure to check out our other dynamic trading systems.
We are always available for questions, comments, and suggestions. There is always room for improvement.
Results Chart
The backtests below show 1-year returns against a Buy and Hold (B+H) approach for 40 of the world’s top traded instruments (as measured by price volume or similar indicator). The Renko Ghost system was run on the top 10 instruments in four major markets: Equities, ETFs, Cryptocurrencies, and Forex. All tests were on a 30min chart, set to Renko “Traditional” blocks (because TradingView does not support realtime alerts from ATR-based charts). Block size was set proportionately to price to give the instrument positive results, but there was no “cherry-picking”. (In fact, changing time frames would have produced even better returns in some cases, but it seemed best to use a consistent measure.) Subscribers to the system receive a full, step-by-step breakdown on how to customize the parameters to get the best from their favorite markets.
(For each instrument, you see listed its Symbol (name), Profit % (annual return using Renko Ghost), Winning Trade % (being “right”), ProfitFactor (Ratio of money won to money lost), Max Draw Down % (point of worst % loss during the year), and B+H (how much the asset would have returned with no trades, via "buy-and-hold" )...)
Renko Ghost
Settings: 30 min, Traditional Renko box, over 1 year (June 1, 2018 - June 1, 2019)
EQUITIES
Symbol,_.,_.Profit %,_.Trade %,_.Pf,_.Max Dr Dn,_.B + H
AMZN,_.,_.,_.1,874,_.,_.62,_.,_.6.3,_.,_.3,_.,_.,_.,_.7
AAPL,_.,_.,_.,_.141,_.,_.48,_.,_.3.4,_.,_.5,_.,_.,_.,_.5
TSLA,_.,_.,_._6,603,_.,_.58,_.,_.5.6,_.,_.6,_.,_.,_.(-38)
FB,_.,_.,_.,_.,_.170,_.,_.48,_.,_.3,_.,_.,_8,_.,_.,_.(-7)
BABA,_.,_.,_.,_.220,_.,_.56,_.,_.3.2,_.,_.9,_.,_.,_.(-23)
BYND,_.,_.,_.,_.305,_.,_.60,_.,_.7.1,_.,_.5,_.,_.,_,_140
MSFT,_.,_.,_.,_.191,_.,_.57,_.,_.6,_.,_.,_3,_.,_.,_.,,_28
AMD,_.,_.,_.,_.,142,_.,_.45,_.,_.2.3,_.,_13,_.,_.,_.,_,0
NFLX_,_.,_.,_.1,902,_.,_.54,_.,_.1.4,_.,_11,_.,_.,_.,(-5)
BA,_.,_.,_.,_.,_.560,_.,_.54,_.,_.4.9,_.,_.3,_.,_.,_.,,_97
ETFs
Symbol,_.Profit %,_.Trade %,_.Pf,_.Max DrDn,_.B + H
SPY,_.,_.,_.724,_.,_.64,_.,_.,_8.3,_.,_.1,_.,_.,_.4
QQQ,_.,_.2,553,_.,_.63,_.,_.,_9.3,_.,_.1,_.,_.,_.5
EEM,_.,_.,_.340,_.,_.52,_.,_.,_5.5,_.,_.2,_.,_.,_.0
IWM,_.,_.,1,801,_.,_.61,_.,_.,_7.7,_.,_.1,_.,_.,(-3)
HYG,_.,_.,_.,17,_.,_.45,_.,_.,_2.5,_.,_.1,_.,_.,,0.5
EWZ,_.,_.4,855,_.,_.59,_.,_.,_9.2,_.,_.2,_.,_.,_.26
LQD,_.,_.,_.,12,_.,_.48,_.,_.,_1.7,_.,_.2,_.,_.,_.6
EFA,_.,_.,_.192,_.,_.52,_.,_.,_4.9,_.,_.2,_.,_.,_(-7)
FXI,_.,_.,_.669,_.,_.55,_.,_.,_6.3,_.,_.,1,_.,_.,(-15)
XLF,_.,_.,_.287,_.,_.55,_.,_.,_4.8,_.,_.,2,_.,_.,(-3)
CRYPTOCURRENCIES
Symbol,_.,_.Profit %,_.Trade %,_.Pf,_.Max DrDn,_.B + H
BTC/USD,_.22 million,_.,_.54,_.,8.1,_.,_3,_.,_.,_.(-8)
ETH/USD,_.15 million,_.,_.50,_.,5.1,_.,_7,_.,_.,_(-54)
XRP/USD,_.26 million,_.,_.49,_.,4.3,_.,_8,_.,_.,_(-21)
LTC/USD,_.785,000,_.,_.,_50,_.,5,_.,_.,12,_.,_.,_.13
BCH/USD,_.756,000,_.,_.,_46,_.,3.6,_.,15,_.,_.,_.(-5)
EOS/USD,_.258,000,_.,_.,_47,_.,3.5,_.,,27,_.,_.,_.13
BNB/USDT,_22 million,_.,_55,_.,7.3,_.,_.8,_.,_.,_143
BSV/USD,_.170,000,_.,_.,_64,.100,_.,_.,,4,_.,_.,_(-8)
XLM/USD,_.15 billion,_.,_.61,_.,7.7,_.,_.5,_.,_.,_.34
ADA/USD,_.136,000,_.,_.,70,_.20,_.,_.,_.2,_.,_.,_.3
FOREX PAIRS
Symbol,_.,_.Profit %,_.Trade %,_.Pf,_.Max Dr Dn,_.B + H
EUR/USD,_.,_.13,_.,_.,_36,_.,_.,1.5,_.,_.,_2,_.,_.,_(-4)
USD/JPY,_.,_.,,5,_.,_.,_31,_.,_.,1.2,_.,_.,_2,_.,_.,_(-1)
AUD/USD,_.,_.26,_.,_.,_44,_.,_.,2,_.,_.,_.,3,_.,_.,_.10
USD/CAD,_.,_.16,_.,_.,_37,_.,_.,1.6,_.,_.,_2,_.,_.,_.,3
GBP/USD,_.,_.37,_.,_.,_37,_.,_.,1.7,_.,_.,_2,_.,_.,_(-5)
NZD/USD,_.,_.24,_.,_.,_50,_.,_.,2,_.,_.,_.,2,_.,_.,_(-6)
GBP/JPY,_.,_.57,_.,_.,_41,_.,_.,1.8,_.,_.,_3,_.,_.,_(-6)
EUR/JPY,_.,_.19,_.,_.,_39,_.,_.,1.4,_.,_.,_4,_.,_.,_(-5)
AUD/JPY,_.,_.50,_.,_.,_36,_.,_.,1.7,_.,_.,_4,_.,_.,(-10)
EUR/GBP,_.,_.13,_.,_.,_41,_.,_.,1.4,_.,_.,_3,_.,_.,_0.1
TrendMaster Gold, v. 6.2xTrendMaster Gold
The ultimate refinement of last year’s TrendMaster system, TrendMaster Gold takes deep pattern recognition to a new level tracking over 20 indicators triggering seven decision gates to trade in a Renko-smoothed charting environment. Optimized for higher returns over a wider range of instruments (see returns below), you are invited to trial this market-mirroring engine. Subscribers receive full breakdown for fine-tuning results to their market favorites while avoiding bot traps. Reach out by message to get your free trial. We are always available for questions, comments, and suggestions. There’s always room for improvement.
Results Chart
The backtests below show 1-year returns against a Buy and Hold (B+H) approach for 40 of the world’s top traded instruments (as measured by price volume or similar indicator). The TrendMaster system was run on the top 10 instruments in each of four major markets: Equities, ETFs, Cryptocurrencies, and Forex. All tests were on a 30min chart, set to Renko “Traditional” blocks (because TradingView does not support realtime alerts from ATR-based charts). Block size was set proportionately to price to give the instrument positive results, but there was no “cherry-picking”. (In fact, changing time frames would have produced even better returns in some cases, but it seemed best to use a consistent measure.) Subscribers to the system receive a full, step-by-step breakdown on how to customize the parameters to get the best from their favorite markets.
(For each instrument, you see listed its Symbol (name), Profit % (annual return using TrendMaster Gold), Winning Trade % (being “right”), ProfitFactor (Ratio of money won to money lost), Max Draw Down % (point of worst % loss during the year), and B+H (how much the asset would have returned with no trades, via "buy-and-hold" )...)
TrendMaster Gold
Settings: 30 min, Traditional Renko box, over 1 year (June 1, 2018 - June 1, 2019)
EQUITIES
Symbol Profit % Trade % PF Max DrDn B + H
AMZN 2,212 62 6.6 3 7
AAPL 158 49 3.7 5 5
TSLA 8,263 57 5 6 -38
FB 179 47 3 8 -7
BABA 247 56 3.4 9 -23
BYND 348 67 17.9 6 140
MSFT 224 58 6.8 3 28
AMD 171 50 2.6 13 0
NFLX 2,132 55 5.2 11 -5
BA 560 54 4.9 3 97
ETFs
Symbol Profit % Trade % PF Max DrDn B + H
SPY 275 64 5.5 3 4
QQQ 865 62 6.1 3 5
EEM 278 60 5.3 2 0
IWM 783 61 6.1 2 -3
HYG 21 51 2.7 1 0.5
EWZ 798 58 5.6 5 26
LQD 12 54 2 1 6
EFA 121 61 4.5 2 -7
FXI 391 63 5.4 3 -15
XLF 200 58 3.4 5 -3
CRYPTOCURRENCIES
Symbol Profit % Trade % PF Max DrDn B + H
BTC/USD 3 million 55 4.7 8 -8
ETH/USD 2 million 52 4.9 21 -54
XRP/USD 6 million 52 4 13 -16.6
LTC/USD 222,000 54 3 13 13
BCH/USD 380,000 54 4.6 28 -5
EOS/USD 147,000 55 2.7 20 13
BNB/USDT 2 million 54 4.4 14 143
BSV/USD 334,000 65 18 5 -8
XLM/USD 34 million 51 2.8 12 34
ADA/USD 48,000 64 7 6 3
FOREX PAIRS
Symbol Profit % Trade % PF Max DrDn B + H
EUR/USD 13 41 1.3 5 -4
USD/JPY 3 37 1.1 4 -1
AUD/USD 24 43 1.4 4 10
USD/CAD 20 43 1.7 4 3
GBP/USD 36 46 1.8 2 -5
NZD/USD 21 47 1.6 2 -6
GBP/JPY 40 42 1.6 2 -6
EUR/JPY 18 54 3.2 2 -5
AUD/JPY 47 44 1.8 5 -10
EUR/GBP 17 46 1.7 4 0.1

RSI-RENKO Divine StrategyLive, non-repainting strategy using RENKO and RSI mixed together to multiple types of long and short positions.
- Features -
Live entry direction with trade warnings and alerts
Live trade building buy and sell limits (for buy/sell limits)
Entry location icons as well as pyramid entries (to add to existing position)
Swing trades that keep you in the trade for the maximum possible profit
1 scalp target based on the RSI settings and entry location
Dynamic trailing stop for swings and scalps
Alert conditions for every update and condition change of the strategy (Provided by indicator study)
4 pre-built color themes, including candlestick coloring
This script is used solely for alerts to the RSI-RENKO Divine Strategy , because Trading View still after 3 years of requesting does not provide the ability to use alert conditions inside a strategy script, only an indicator script. This strategy should be used to backtest your settings. Beyond alerts and strategy inputs, the strategy and indicator are identical.
RSI-RENKO Divine Strategy (Backtesting)Live, non-repainting strategy using RENKO and RSI mixed together to multiple types of long and short positions.
- Features -
Live entry direction with trade warnings and alerts
Live trade building buy and sell limits (for buy/sell limits)
Entry location icons as well as pyramid entries (to add to existing position)
Swing trades that keep you in the trade for the maximum possible profit
1 scalp target based on the RSI settings and entry location
Dynamic trailing stop for swings and scalps
Alert conditions for every update and condition change of the strategy (Provided by indicator study)
4 pre-built color themes, including candlestick coloring
This strategy is best used with the companion indicators: Renko RSI and Renko Trend Momentum using the identical RSI and Trend settings.
The linked script is identical and used solely for alerts, because Trading View still after 3 years of requesting does not provide the ability to use alert conditions inside a strategy script, only an indicator script. This strategy should be used to backtest your settings.
The approach to this strategy uses several parallel trades of different types. In order to generate multiple trade types the "pyramid trades" setting of the strategy (second tab of the settings that lets you adjust the number of pyramid contracts) should be used.
- Trade Types -
Swing: This trade is entered on the solid arrows after the RSI has become oversold or overbought. It is key that all trades wait for some degree of pullback before entering, even after the trend flips between positive and negative. This trade is held until stopped out or an opposite trade is triggered that reverses the position.
Scalp: These trades have a limit buy/sell entry and a target. The initial target is the opposing RSI overbought or oversold level and changes in real time.
Turning on/off the different trade types (strategy only) is simple done by decreasing the number of contracts used for that trade type to zero. When the quantity is set to zero, that trade is not considered.
- Session -
The session filter is used to narrow trade executions by only allowing trades that are inside the session boundaries. This can be used to isolate the London or New York session for example. The default is 24 x 7 which filters no trades (Trading View has a bug when resetting this, so simply reset the indicator to get it back to 24x7).
Please see the following 3 videos introducing the concept of this strategy.
All feature requests or bug reports are welcome either by direct messaging or comments on this page or the linked indicator page.
Please PM for access. Cheers.

Renko RSIThe goal of this indicator is to plot the RSI values "as if" the chart is a true price action based Renko chart. It can be used on a time series chart or Renko series chart. The RSI is derived from the raw price action of a time-based chart, where the historic and live price is clustered into Renko bricks. The Renko brick production algorithm is entirely backed by Renko Price Bars Overlay and thoroughly tested.
The algorithm takes into account rapid brick production within a single time candle and adjusts accordingly. The output may vary slightly between different chart time frames for the same indicator settings, but this is due to the lack of price fluctuation visibility that can occur in higher chart time frames. If the brick tick size is low, an appropriate chart interval should be selected that maximizes the amount of price volatility visible to the indicator. A bad setting would be something like a 1 tick EURUSD Renko setting on an H4 chart, there simply is no way to derive the exact and ordered price fluctuations in a single H4 candle, 1 pip at a time. A more appropriate chart time frame would be 1-3 minutes for this selected Renko brick size.
Plots user specified RSI based on Renko bricks. This would be the same (or very close to) the RSI viewed on a normal Renko chart based on price action alone.
Works well with Renko Price Bars Overlay script.
See also: Renko Trend Momentum

Renko Trend MomentumA momentum indicator that shows bulls vs bears strength of renko brick production. The algorithm takes into account rapid brick production within a single time candle and adjust accordingly. The output may vary slightly between different chart time frames for the same indicator settings, but this is due to the lack of price fluctuation visibility that can occur in higher chart time frames. If the brick tick size is low, an appropriate chart interval should be selected that maximizes the amount of price volatility visible to the indicator.
Plots the normalized rate of new Renko Up Brick production vs new Renko Down Brick production.
Custom crossover threshold to help prevent whipsaws and keep you in the trend.
Shows pending areas when a crossover is imminent.
Custom time-based buffer combined with a crossover to keep you in the trend.
Shows crossover background color changes when the direction of the Renko Trend changes.
Works well with Renko Price Bars Overlay script.

Alnami_Quantum_blocksThis is the revolution of renko... it is renko chart based on percentage movement of the underlying ..
User can set:
1- the % move that if exceeded, the channel will shift
2- entry strategy
3- exit strategy

A&M_blocks v.2This is re production of Renko chart.
It draws lines that shows the location of the current box boundaries...using percentage instead of fixed box size or average true range.
Russ Renko STCTraders,
This indicator is a Renko version of the Schaff Trend Cycle (STC). It is not meant to be used alone but as confirmation tool. Buy when green arrow appears, short when red arrow appears if your other indicators agree.
It works equally well on all time frames using ATR Renko brick sizes as well as when using custom brick sizes on a 1 min Renko chart. This is a version 3 script with no repainting.
russrenko.com
Thank you,
Russ Renko


Stochastic RSI Signal LinesThis script is for private use only. I created it as step 1 for my Renko Trading Strategy.
Tested on BitMex on XBTUSD.
