Renko GuppyI like renko blocks and I like guppy mma's so I decided to put together a study for using them with each other while I'm using other bar types.
Additionally, I added two line plots for two different renko sizes of your choice. This has a nice benefit of being able to see how price appears to be ranging between the "block sizes".
Being able to see the lines contract, especially within these "ranging" zones, gives you a great indication of an impending breakout.
The example you see above shows the guppy block size set to 15, the white line is 50 and the blue is 100. It should hopefully illustrate the idea.
The current close price (red line) can also be optionally plotted as a separate moving average, or simply the close price. I defaulted it to a 3 period EMA to smooth it out a bit so it flows a bit better with the guppy ma's. It's helpful to see how price is actually moving around within these Renko blocks.
Pick either Traditional or ATR block sizes.
There are the fast (5) / slow (5) moving averages.
Pick your poison: EMA (default), SMA, WMA, SMMA, DEMA, TEMA, HullMA, ZEMA, TMA, SSMA
There's some options to disable/enable things as you see fit.
The defaults are set to my own needs so you'll probably want to change block sizes for you preferences/symbols/timeframes.
Note: This is presumably only usable for those of you with access to Renko charts on here.
Renko

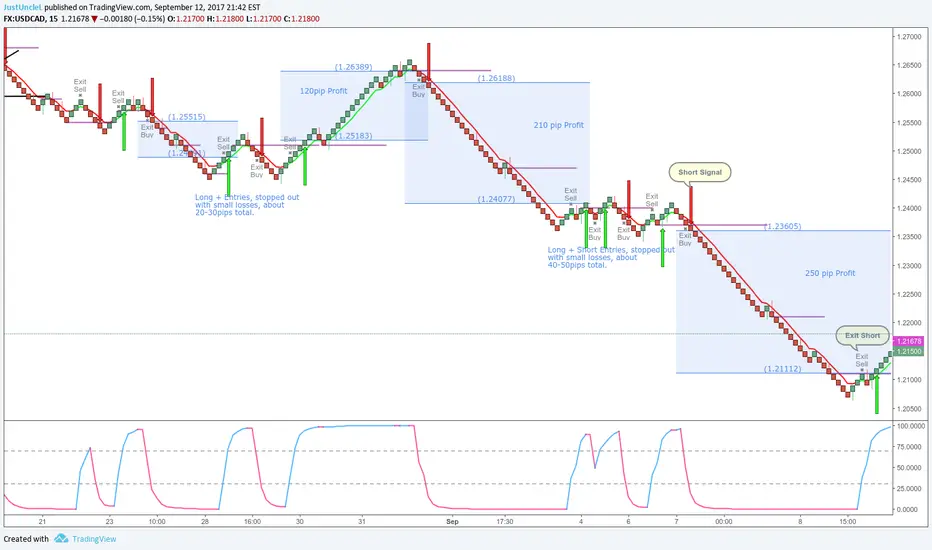
Renko+Moving Average+RMI Alert R3 by JustUncleLThis script idea is designed to be used with 10pip brick (recommended) Renko charts. It combines the Renko price action with a directional coloured EMA (default length 6) and a RMI (instead of the usual RSI) indicator to provide entry and exit signals. RMI is bit like RSI with a built-in momentum factor and works well with Renko.
Signals can optionally be filtered by Daily or Weekly Open, where by only trade long above open and short below open (this option is enabled by default). Exit occur when EMA or RMI reverses direction, or optionally (disabled by default) when the Renko prints a brick in the reverse direction. Each Entry and Exit signal creates an Alertcondition that can be picked up by the TradingView Alarm system.
TIP: To get 10pip Bricks set Renko to "Traditional" type bricks and 0.001 for non-JPY currency pairs, and 0.1 for JPY currency pairs. Also set chart Time frame to 5min or 15mins.
References:
TheLark Relative Momentum Index (RMI)
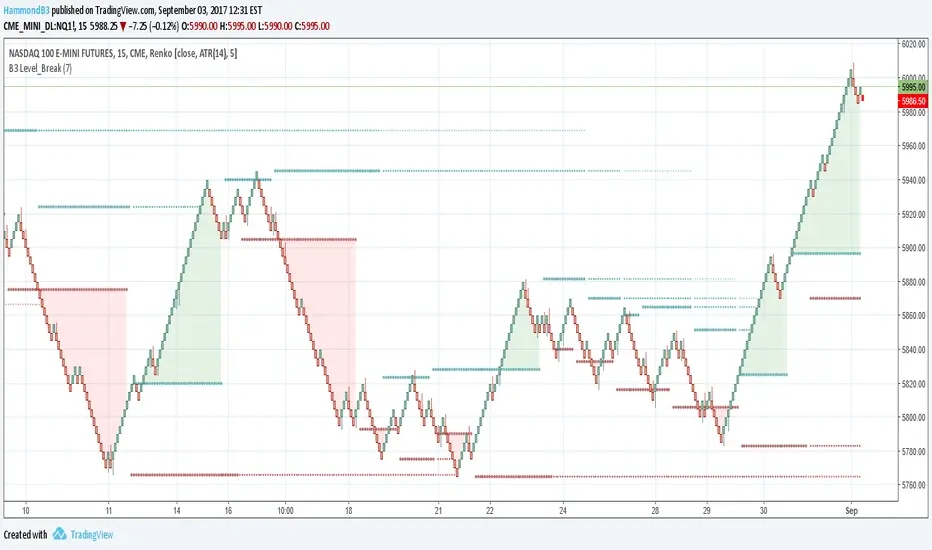
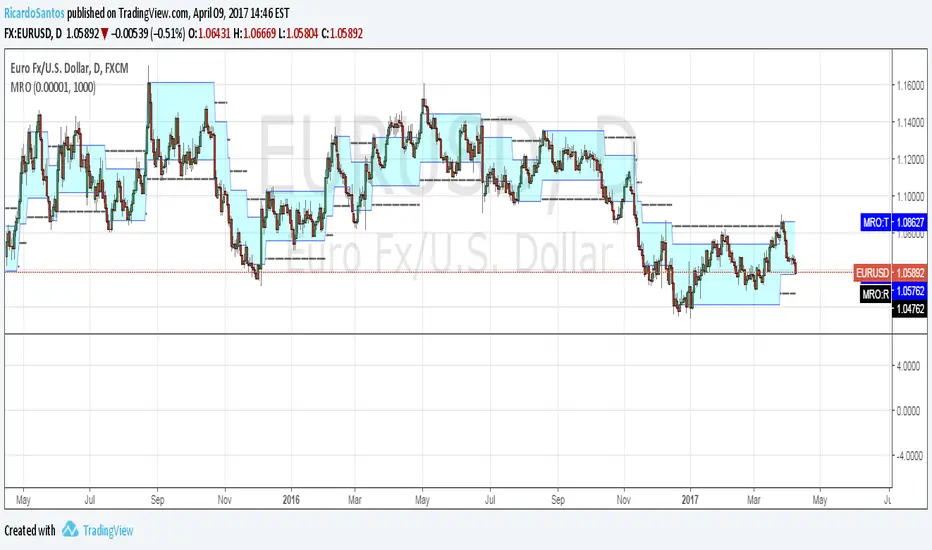
B3 Level_BreakUsable on any style chart, B3_Level_Break is simply a breakout play off the highest high or lowest low of a period. What makes this script slightly different is that it looks forward and backward for the pivotal point. This line is then carried forward with time decay; they will either erase with time, or erase when crossed by price. So many traders young and old like to draw price level lines, and this indicator certainly helps the lazy person do this.
Hedge Fund firms and trading groups around the market use indicators like this one to bring awareness to the last time price failed to reach further. When these levels are approached again, the cloud-fill will highlight the break outs, but a firm trader isn't always trading the breakout. What a good trader will do is look at the Level 3 data and the Time & Sales to determine if the story of supply and demand is pointing to a breakout, or a reversal (like a double-top or double-bottom).
I have automated this strategy to some varying degrees of success, avoiding the range reversal trades. Like any trend finding indicator, a rangy day will be tough to find a good signal from it. However, if you find range with no breakouts in this indicator, an oscillator of your choosing would be appropriate to trade the reversals within the ranges.
On a NQ1! 5m chart I have been using a length of anywhere from 7 to 16, (higher length gets you out of noise). The higher in interval you go, the less length you likely need. I have been looking at Stochastic turns at OVB OVS in combination with stocks breaking out on this indicator length set to 3 with interval Day or 4-6hr charts. Its a good catch for fading an earnings dip or bump after the call, or simply a confirming entry on the old school stochastic swing trade.
It has been some time since I have made a post. I will continue to post anything I find useful. It's best in the market to find things that work and stick with them, so it should make sense that I don't post as often. Enjoy !! :)
Renko Bar Time by JustUncleLThis indicator in designed to be used with Renko and other price only bars (ie Kagi, LineBreak, Point&Figure) and shows the number of minutes a bar was open before it was confirmed and printed.
NOTE: It will only work on currencies and symbols that are in the 24/5 market, it does account for weekend market close time but does not account for any Forex market holiday close times.
HINTS:
When the BAR TIME is long and the Renko Bricks have wicks, this is an indication of consolidation.
When the BAR TIME is short and the Renko Bricks have no wicks, this is an indication of acceleration.

Renko CandlesThis is a script to place Renko candles on your chart alongside another candle type or more importantly, using the variables from this script, you can build a strategy using Renko candles that will depict true/proper entries and exits in a strategy when using the backtest feature.
We hope this helps!
[INDICATOR]Renko Emulator OCC v1 by JustUncleLThis "Study" project has been created by request and is used in conjunction with the "Strategy" version.
*** EXPERIMENTAL ***
*** USE AT YOUR OWN RISK ***
Description:
Indicator based around Renko Bar Chart emulator (ATR) with direction change used to signal buy/sell trades.
I have generally found that setting the strategy ATR resolution to 3-5x that of the chart you are viewing tends to yield the good results, regardless of which chart time used. Positions get taken automatically following THE Renko Bar after a crossover.

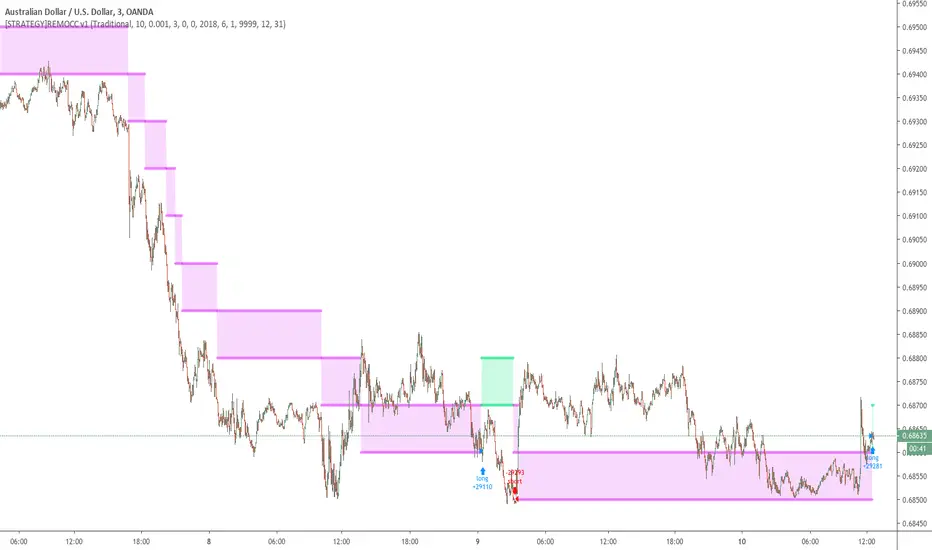
[STRATEGY]Renko Emulator OCC v1 by JustUncleLThis "Strategy" project has been created by request.
*** EXPERIMENTAL ***
*** USE AT YOUR OWN RISK ***
Description:
Strategy based around Renko Bar Chart emulator (ATR) with direction change used to signal long/short trades.
I have generally found that setting the strategy ATR resolution to 3-5x that of the chart you are viewing tends to yield the good results, regardless of which chart time used. Positions get taken automatically following THE Renko Bar after a crossover.
The emulated Renko bars can optionally be draw on the chart.

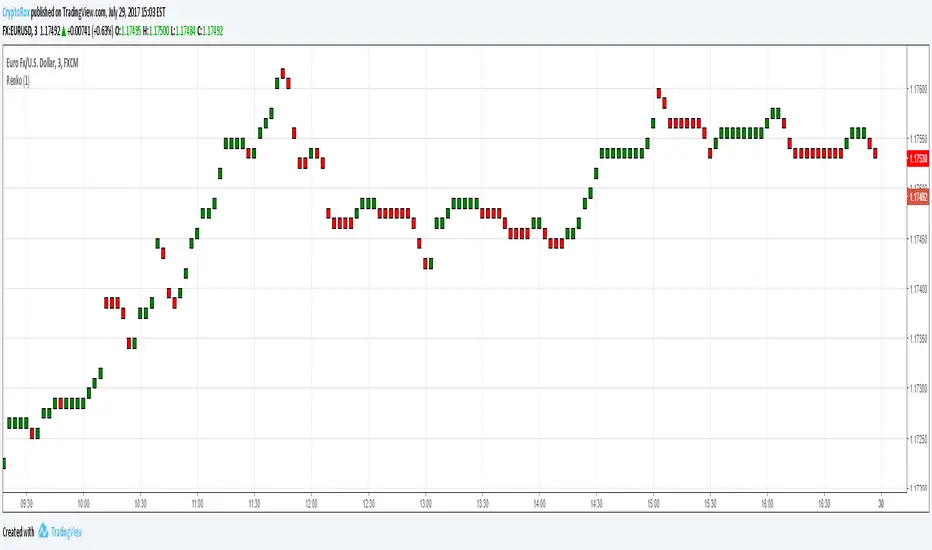
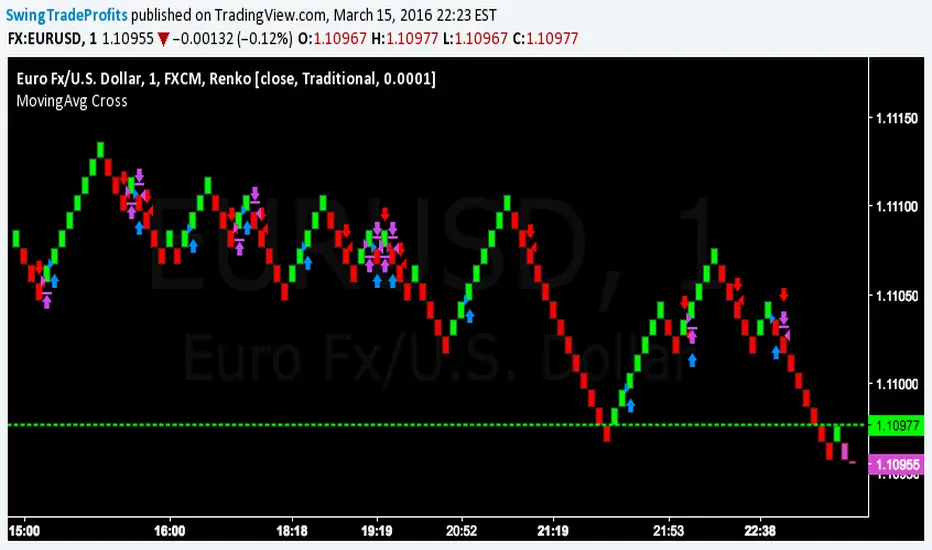
$EURUSD 1 Minute Chart StrategyYou must be using the renko chart with traditional settings with the block size set at .0001. This can be done by going to settings. Style at the bottom should be changed from ATR to traditional. The set the block size as .0001.
alpha Renko intraday wave timeI was asked to share my experimental Renko intraday wave time. So here it is warts and all. The same for the rest - except the Weis cumulative volume.
Renko wave time is in minutes. This script is strictly intraday and has not been played with extensively.
You must use traditional Renko and set the script wave size to the same size as the Renko brick size.
If you click on the sideways wishbone or "V" in the middle upper part of the chart you will get all of the scripts in this particular sandbox. After clicking the sideways wish bone click on "make it mine". You will then have the whole sandbox. The only published script is the Weis cumulative wave.
The "Boys MAs" is supposed to be a script for daily charts and from within some kind of consolidation. In any case I am intrigued by some signals. You have a variety of sandbox options in the format section of the boys MAs.
These codes are pretty rough with lots of abandoned lines of script.

[RS]Renko Overlay V0Renko Overlay:
tf: Timeframe to use.
mode: ATR or Traditional .
modeValue: can be whole number for ATR mode (ex:.15) or floating point value for Traditional (ex:.0.12345) .
showOverlay: Display renko bars.
showBarColors: Display Bar Colors.
showMa: display Renko based ma.
MA_length: moving average length.
note: should use with scale series only toggled on, so it doesnt strech.

[RS]Renko ZigZag V0Renko based zigzag:
mode: can be Traditional or ATR .
modeValue: can be whole number if you use ATR mode, or floating point number in case of Traditional mode.
showOverlay: displays basis Renko overlay.

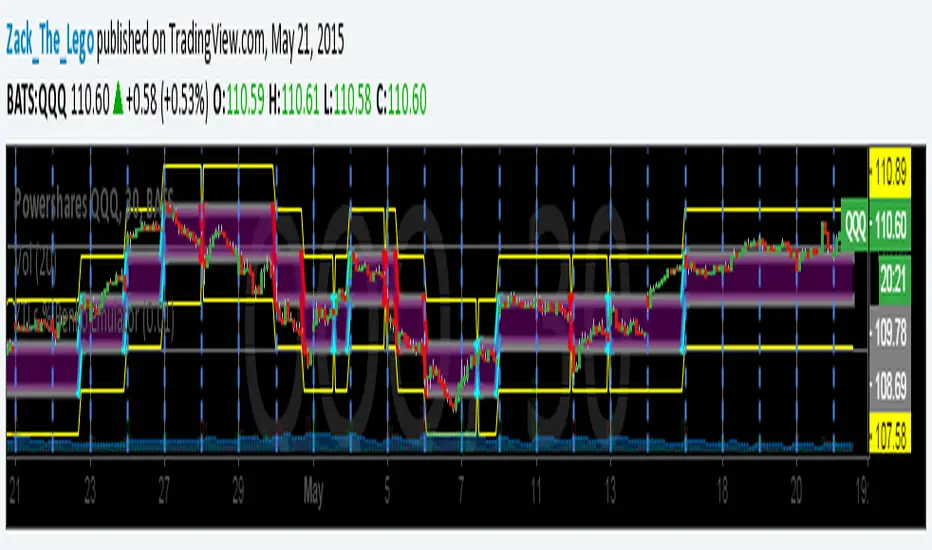
ZTLs Percentage-based Renko EmulatorHere is another version of my Flex Renko script. It is uses percentage-based brick sizes to draw the Renkos instead of ATR or static brick sizes. What makes the percentage-based drawing style great is that one doesn't need to adjust stops so many times like they would with a ATR based Renko. It also makes moving between tickers smooth as well as one doesn't have to adjust the brick-size for each name.
to use: By default the setting is ".001" or 10 basis points. So ".01" is 1 percent or 100 basis points and so-forth. This style is perfect for those traders who make trades on a percentage basis over a price-level basis. It's also good for percentage-based stops.
The yellow lines represent where the price needs to go to draw another Renko brick.

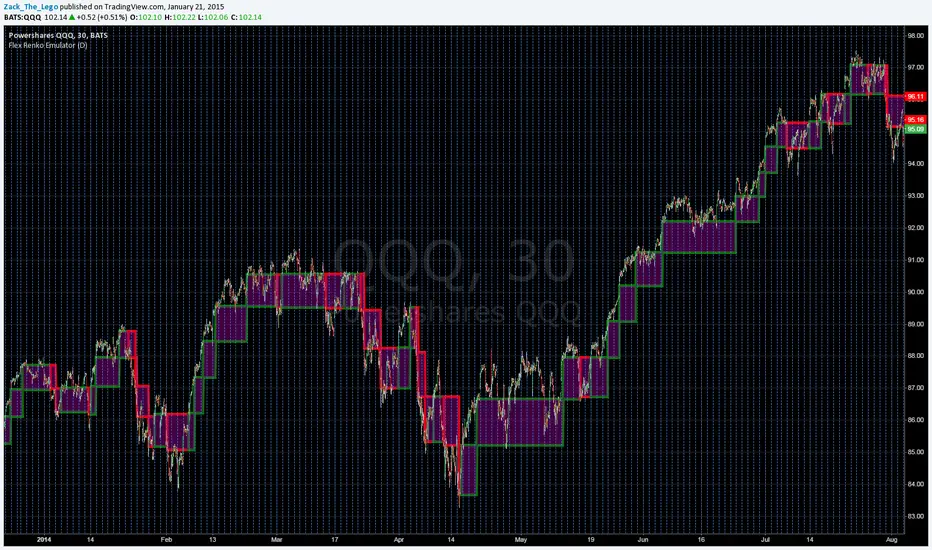
Flex Renko Emulatorupdate:
As far as my algorithm design will take me this is it. So It's complete in my eyes. Here is a "working" version of something I've been looking for for a long time: "Flex" Renko Charting.
Bricks' sizes are determined by ATR and are set by simply choosing a resolution for the ATR calculation. No need to go in and choose renko granulation(resolution) AND brick size. Renko granulation is current chart resolution. Feel free to send me feedback on how to manage the reversal bricks' calculation or any other thoughts and ideas.
Replace the "close" in the main body of the renko calculation with 'high' and 'low' to get more consistent paintings across different aggregations since renkos aren't technically based off closing prices but where the price has been. Of course it's all a matter of preference:
Brick1 = high >
nz(Brick1) + BrickSize ? nz(Brick1) + BrickSize : low <
nz(Brick1) - BrickSize ?
nz(Brick1) - BrickSize
: nz(Brick1)
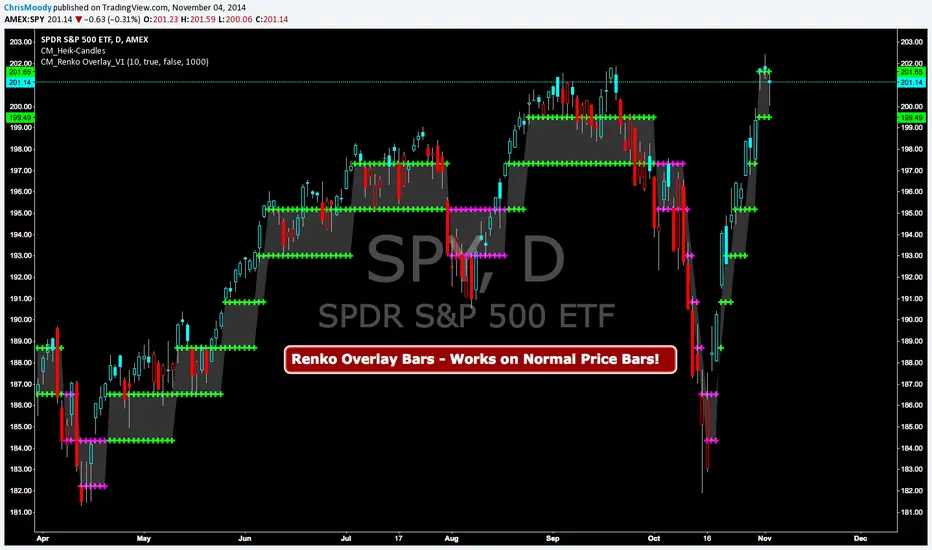
CM Renko Overlay BarsCM_Renko Overlay Bars V1
Overlays Renko Bars on Regular Price Bars.
Default Renko plot is based on Average True Range. Look Back period adjustable in Inputs Tab.
If you Choose to use "Traditional" Renko bars and pick the Size of the Renko Bars the please read below.
Value in Input Tab is multiplied by .001 (To work on Forex)
1 = 10 pips on EURUSD - 1 X .001 = .001 or 10 Pips
10 = .01 or 100 Pips
1000 = 1 point to the left of decimal. 1 Point in Stocks etc.
10000 = 10 Points on Stocks etc.
***V2 will fix this issue.