Protervus RenkoWelcome to Protervus Renko!
After over two years of research and development, I'm thrilled to present you with my take on Renko in overlay mode.
Key features
Four Renko Types: Classic, Median, Geometric, Turbo
Brick size methods: Traditional, Percentage, ATR
Renko Wicks
Higher Time-Frame selection
No repainting, all data is consolidated and obtained from regular candles
Output mode: pass Protervus Renko data to other indicators
Built-in settings validator
Renko Statistics
Bricks reversal
Complete style and color customization
Tooltips in the settings panel explaining available options
Alerts
Renko Types: Classic, Median, Geometric, Turbo
Show Candles, Levels, or Both - along with Wicks
Note: when levels are disabled Wicks are shown on the actual Renko bricks, while when enabled they are shown in the middle of the Renko level.
Understanding Renko Output
In Real Mode, the output only contains data on the Renko brick, while in Normalized mode the values are repeated for the whole Renko level.
Example with Bollinger Bands:
In Real Mode, Bollinger Bands will be calculated exclusively on the Renko Bricks. Had we used Normalized Mode instead, the output wouldn't make sense as the values are carried over on each candle.
Other indicators (like RSI, for example) would work better with Normalized output though:
Automatic settings validation
Note: if settings are Unreliable, the script will not show any Renko candles or levels. The Output can still be used on external indicators, if needed (e.g. for a more granular RSI output).
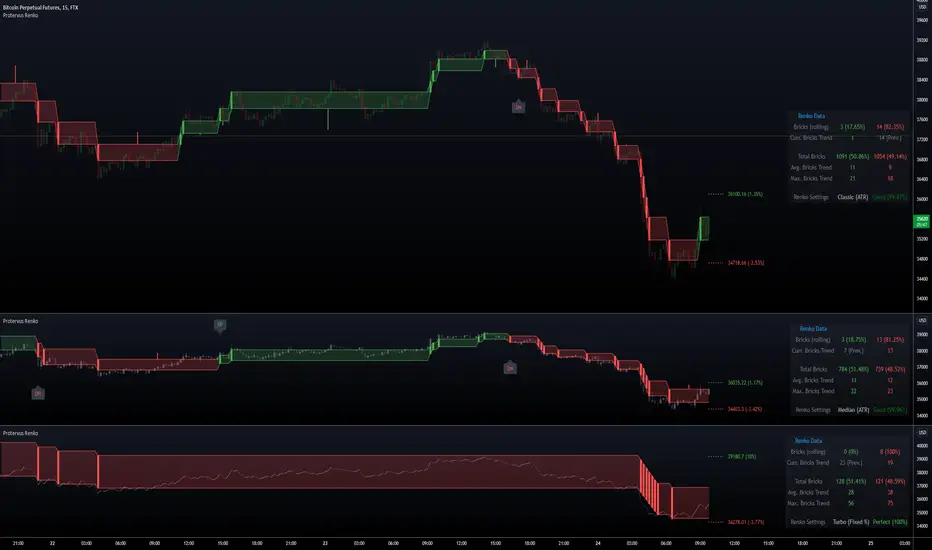
Renko Data Panel
Data Panel shows two types of statistics: Rolling and Barset. Rolling data is referring to "last X time" and can be defined in the indicator's settings (in this example it's set to one week) while "Total Bricks" are considered over the whole available barset (since the beginning of the chart).
Besides seeing Renko Bricks trends at a glance, it's also possible to spot interesting areas when Rolling bricks are coming close to either the Total Average or Total Maximum Bricks, signaling a possible reversal or continuation.
Bricks Reversal
Show reversals: configure how many opposite bricks are needed to trigger a reversal, as well as limiting their number to avoid strong opposite movements.
Tip: more conservative Traders might want to receive a signal if the minimum is close to the Average Bricks Trend, but not over the Maximum Bricks Trend.
Moving the Indicator to a separate pane and overlay price
Credits
yatrader2 (lengths in time or bars function), allanster (Heikin Ashi function)
Special thanks go to PineCoders community for their incredible efforts and learning material to help mastering PineScript!
Renko
Renko Candles OverlayHello All,
For long time I got many request for Renko Candles and now here it's, Renko Candles Overlay . I tried to make almost everything optional, so you can play with the options as you want.
Let see the options:
Method: the option for brick scaling method: ATR, ATR/2, ATR/4, Percent, Traditional
- ATR Period: period for Average True Range and it's valid if the method is ATR
- ATR/2 Period: period for Average True Range and it's valid if the method is ATR/2
- ATR/4 Period: period for Average True Range and it's valid if the method is ATR/4
- Traditional: User-defined brick size, it's valid if the method is Traditional
- Percent: Percent of Close price, it's valid if the method is Percent
if the method is not Traditional (fixed brick size) then Brick size is calculated/updated when new bricks added. so The box sizes may be different because of the calculation is dynamic.
Levels & Lines for new Bricks: if you enable this option then the script shows the levels for new brick
Change Bar Color: optionally the script changes the bar color by using direction of the bricks
and some other options for coloring.
The script shows the bricks for visible area, which is approximately 280 candles. so if you change the width and number of the bricks then number of bricks that is shown is adjusted automatically to fit the screen. you can see the examples below:
The script shows the levels to new brick as a line and label:
Because of real-time bar is not confirmed until the candle close, the script shows the bricks as Unconfirmed , and unconfirmed bricks shown in different color:
You can change the width of the bricks (width is 10 in following example):
Optionally candle colors are changde by the direction of the bricks:
If you have any recommendation then please drop a comment under the script ;)
Enjoy!

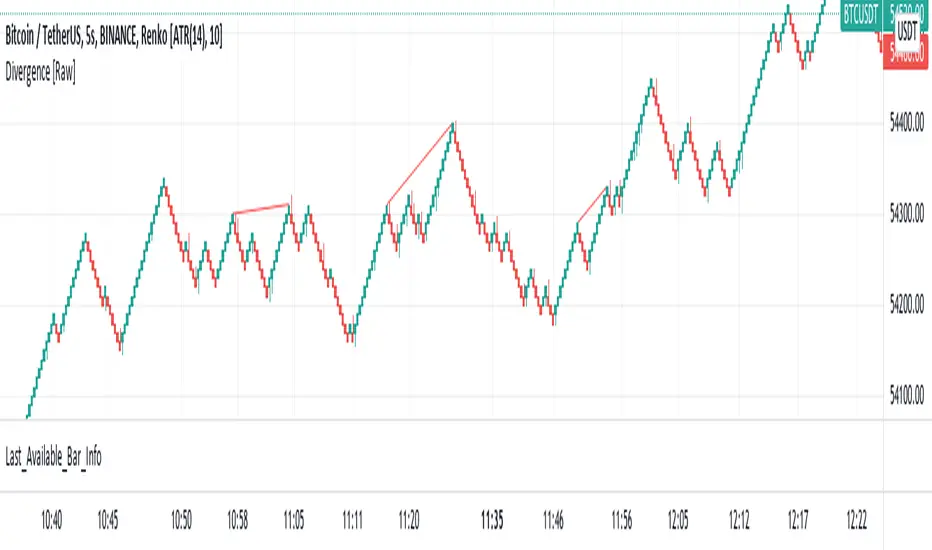
Last Available Bar InfoLibrary "Last_Available_Bar_Info"
getLastBarTimeStamp()
getAvailableBars()
This simple library is built with an aim of getting the last available bar information for the chart. This returns a constant value that doesn't change on bar change.
For backtesting with accurate results on non standard charts, it will be helpful. (Especially if you are using non standard charts like Renko Chart).
Methods
getLastBarTimeStamp()
: Returns Timestamp of the last available bar (Constant)
getAvailableBars()
:Returns Number of Available Bars on the chart (Constant)
Example
import paragjyoti2012/Last_Available_Bar_Info/v1 as LastBarInfo
last_bar_timestamp=LastBarInfo.getLastBarTimeStamp()
no_of_bars=LastBarInfo.getAvailableBars()
If you are using Renko Charts, for backtesting, it's necesary to filter out the historical bars that are not of this timeframe.
In Renko charts, once the available bars of the current timeframe (based on your Tradingview active plan) are exhausted,
previous bars are filled in with historical bars of higher timeframe. Which is detrimental for backtesting, and it leads to unrealistic results.
To get the actual number of bars available of that timeframe, you should use this security function to get the timestamp for the last (real) bar available.
tf=timeframe.period
real_available_bars = request.security(syminfo.ticker, tf , LastBarInfo.getAvailableBars() , lookahead = barmerge.lookahead_off)
last_available_bar_timestamp = request.security(syminfo.ticker, tf , LastBarInfo.getLastBarTimeStamp() , lookahead = barmerge.lookahead_off)
st_renkoThe indicator has two parameters: the period and the number of splits. For the selected period, the maximum and minimum are calculated, and the scope of the market is determined by the difference between the maximum and minimum. The scope is divided by the number of partitions, thereby determining the step of the levels. If the average price (ohlc4) falls within the range between levels, this range is drawn. A simpler analogy: we have a local minimum. and the local maximum for the selected period, we build a ladder between them, the number of steps of which is equal to the number of splits, and if the price is on some step of this ladder, then this step is drawn, so we can see how many steps separate us from the maximum and minimum.

MM CHEATCODE V2The Best Renko system out there. The second coming to the original Cheatcode Algo we made
with options to use Tradition point calculations or ATR values for price measurement
- Select up to 3 tp levels
- ATR Risk calculator
- Strategy presets for easy setting selection for certain assets
- A trailing Ma for stint entries filters
- Volatility bands (BB, Kentler,Donchain)
- ATR super trend for added trend & trade filter
- MTF filter (up to 3)
- Added Session display as well as strict filter to only trade during that session(s) selected
- Full signal Alerts (meaning the full signal will send Entry, TP, Sl )
- added MM Capo volatility filter
Also Have Automation Version Available
How to use
You can use a setting preset in for the asset selected and the settings will automatically adjust but won't apply to your setting screen. (Tradingview limitations)
For the most part the buy signal will plot when the ATR moves in up/down direction
Filter your trades with the various trend detections indicators added when they all line up you have the best probability for the trade.
Renko is the best way to trade basic market structure and now with all the confirmation you need.
ALL Links below or PM us for access to this indicator Happy Trading

HA,Renko, Linebreak,Kagi and Average all Charts Layouts in One This is an educational study, using the security functions provided by @PineCoders(big thanks to them for creating this ) in order to see the difference between multiple candle close plots using:
Heikin Ashi
Renko
Linebreak
Kagi
Average of them all.
Both the different securities and the average can be used as a source for different indicators like moving averages or oscillators getting with them some new and unique opportunities.
If you have any questions, let me know !

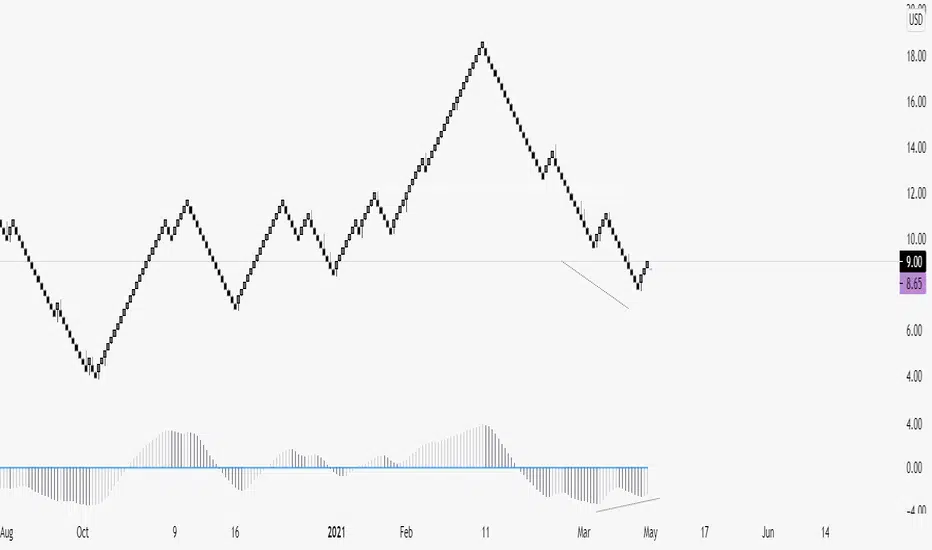
Renko chartThis script displays the renko chart of the candlesticks chart
The color of the chart is green (red) if the trend is up (down).
The following settings are available:
Renko parameters:
Style = Box Size Assignment Method: 'ATR', 'Traditional'.
Parameter = ATR Length if `Style` is equal to 'ATR', or Box Size if `style` is equal to 'Traditional'.
Timeframe parameters:
Period = Resolution, e.g. 'm' - minutes, 'D' - daily, 'W' - weekly, 'M' - monthly, or same as chart
Multiplier = Multiplier of resolution, e.g. '60' - 60m if Period is 'm'
Alerts are also provided, to catch these conditions:
trend change = up to down or viceversa
bullish reversal = down to up
bearish reversal = up to down

[blackcat] L5 Renko MasterLevel: 5
Background
Like many people in the Tradingview community, I have been studying how to apply Renko charts to backtesting and live trading for long. However, as we all know, the official Tradingview Renko chart is not recommended for backtesting because it will lead to unrealistic backtesting results. So, I thought about developing a set of customized Renko charts that can be used for backtesting and second-level trading. This "L5 Renko Master" is one of them that I am introducing today.
In fact, this is not a Renko chart based on Tick's principle. It is based on OHLC data, because this kind of chart can be used for reliable backtesting and trading in Tradingview. Therefore, the Renko Master in this script can actually coexist with the standard Japanese candlestick chart, but the trend reversal information it prompts is based on a principle similar to Renko. When the two can coexist and produce trading signals at the same time, this is really a very interesting invention.
Function
First of all, this Renko chart can coexist in the main chart with the Japanese candlestick chart. It can support up to 1 second level of display and trading. By configuring two parameters, you can adapt it to different Time Frames.
Secondly, this Renko chart can be used for backtesting strategies, because it is essentially OHLC data. Although the absolute value of the price cannot correspond to the original OHLC one-to-one, the certainty of the trend reversal is relatively high. It can be compared with Japanese candlesticks on the timeline.
Finally, this Renko chart is embedded with a Renko intrinsic trading strategy, which can be used to locate entry points through red and green labels. This strategy supports Tradingview alerts. You can get "LONG" or "SHORT" trading reminders by creating alerts. In order to obtain a clear market structure, Zen Stroke (Autolength ZigZag) and Zen Kiss (Special Moving Averages) can be checked to be superimposed and displayed on the main chart to facilitate understanding of the temporal and spatial position of prices in the market.
Indicator Set
Renko Master Boxes (砖块图)
Zen Stroke (Auto ZigZag , 自动画缠论笔)
Zen Kiss Moving Averages (缠论均线)
Inputs
Price --> Price source used to produce Renko, close is default.
RefBarBack --> Lookback period length to calculate Renko. The larger value, the less sensitive to price ripples and sideways.
BoxPerc --> Internal box percentage input. The larger value, the less sensitive to price ripples and sideways.
Show Zen Stroke (AutoLen ZigZag)? --> Switch to turn on and off ZigZag.
Shown Renko MA? --> Switch to turn on and off special moving averages.
Key Signal
Bricks
Green bricks for up trend
Red bricks for down trend
Labels
Green labels for buy/long.
Red labels for sell/short.
Zen Stroke (ZigZag)
Green line section for up stroke
Red line section for down stroke
Moving Averages
Yellow for fast line
Fuchsia for slow line
Pros and Cons
Suitable for discretionary trading and bots via alerts. However, only well selected trading pair and time frame can guarantee bot works.
Intuitive and effective, the output signal is more reliable after multi-indicator resonance
Remarks
My third L5 indicator published
Closed-source
Invite-only
Redeem Fee Life Lock Guarantee
Although I take the efforts to inform the script requesters that the best way to promote trading skills is to learn from the open source scripts I released by themself and to improve their PNIE script programming skills, there are still many people asking how to obtain or pay to use BLACKCAT L4/L5 private scripts. In fact, I do not encourage people to use Tradingview Coins ( TVC ) / Cryptocurrency to redeem the right to use BLACKCAT L4/L5 scripts. However, redeeming private script usage rights through TV Coins/ Cryptocurrency may be an effective way to force more people to learn PINE script programming seriously. And then I can concentrate on answering more valuable community questions instead of being overwhelmed by L4/L5 scripting permission reqeusts.
I would like to announce a ‘Redeem Fee Lock Guarantee’ program to further simplify the L4/L5 indicator/strategy utility offering and distinguish itself from the competition. ‘Redeem Fee lock guarantee’ is one of the major initiatives by BLACKCAT as a part of overall value packaging designed to guard BLACKCAT’s followers’ against cost-overruns and operational risks usually borne by them when it comes to PINE script innovation ecosystem. The TVCs redeemed for L4/L5 a follower signs up for with BLACKCAT is their guaranteed lifetime locked in TVC Quantity/ cryptocurrency, with no special conditions, exclusions and fine print whatsoever. Based on this scheme, I can constantly refine, expand, upgrade and improve PINE script publishing to ensure the very best experiences for my followers. The 'Redeem Fee Lock Guarantee' is a step in the direction of rewarding the valuable followers. NOTE: Every L4/L5 script redeeming service is ONLY limited to TVC or Cryptocurrency ("Win$ & Donate w/ This" Addresses displayed on script page) redeeming which the 1st signed up TVC Qty/ equivalent cryptocurrency is the lifetime offered TVC Qty/ equivalent crypto.
How to subscrible this indicator?
The script subscription period only has two options of one month or one year, and its price is floating. The latest price of the script subscription is proportional to the number of likes/agrees this script has already received. Therefore, the price of subscribing to this script shows an increasing trend, and the earliest subscribers can enjoy the price of lifetime lock to this script. As the number of likes / agrees of this script increases, the subscription fee for one month and one year will also increase linearly. Whatever, the first subscription price of the use will be locked for life.
Monthly subscription and annual subscription can be done either by tradingview coins ( TVC ) or by converting into equivalent cryptocurrency at the exchange rate (1TVC=0.01USD) for redeem.
TVC payment needs to pay TVC directly in the comments under this script. Every time I authorize a new user, I will update the latest number of subscribed users and latest price for next subscription under the script comment. If there are any conflicting scenario happened to the rules and my update. My updated price based on the rule will be the final price for next subscription. The following subscribers need to pay the corresponding amount of TVC or cryptocurrency in accordance with the latest number of users and price announced by me in accordance with the rules published.
TVC redemption is the method I strongly recommend, and I hope you can complete the redemption in the comment area of this script. This is like a blockchain structure, each comment is a block, each subscription is a chain, which is conducive to open and transparent publicity and traceability to avoid unnecessary disputes.
Monthly Subscription Charges
500TVC <50 Agrees (A)
50A<850TVC<100A
100A<1000TVC<150A
150A<1350TVC<200A
200A<1500TVC<250A
250A<1850TVC<300A
300A<2000TVC<350A
350A<2350TVC<400A
400A<2500TVC<450A
450A<2850TVC<500A
500A<3000TVC<550A
550A<3350TVC<600A
600A<3500TVC<650A
650A<3850TVC<700A
700A<4000TVC<750A
750A<4350TVC<800A
800A<4500TVC<850A
850A<4850TVC<900A
900A<5000TVC<950A
950A<5350TVC<1000A
1000A<5500TVC<1050A
And so on...
Annual Subscription Charges
5000TVC <50 Agrees (A)
50A<8500TVC<100A
100A<10000TVC<150A
150A<13500TVC<200A
200A<15000TVC<250A
250A<18500TVC<300A
300A<20000TVC<300A
350A<23500TVC<400A
400A<25000TVC<450A
500A<28500TVC<550A
500A<30000TVC<550A
550A<33500TVC<600A
600A<35000TVC<650A
650A<38500TVC<700A
700A<40000TVC<750A
750A<43500TVC<800A
800A<45000TVC<850A
850A<48500TVC<900A
900A<50000TVC<950A
950A<53500TVC<1000A
1000A<55000TVC<1050A
And so on...

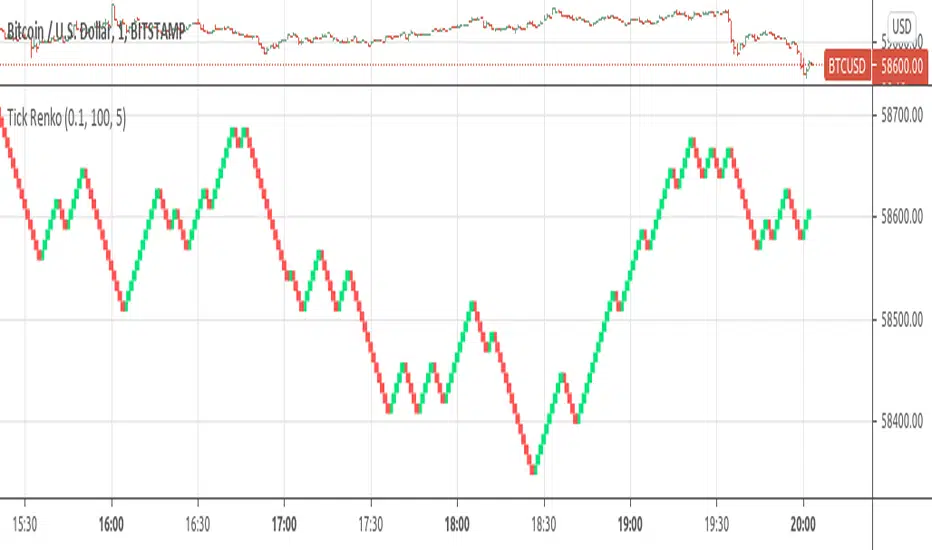
Tick Renko Chart - Percent BasedA Renko Tick chart based on continuously adjusting percentage.
Live Renko bricks formed by tick data
Adjustable brick width
Outline mode, or line mode for more bricks
Scalp with a Renko, get weird.
The settings can and will break the script if you turn them up too high. Turning off outline mode will not look as nice, but can potentially allow for a larger number of bricks.

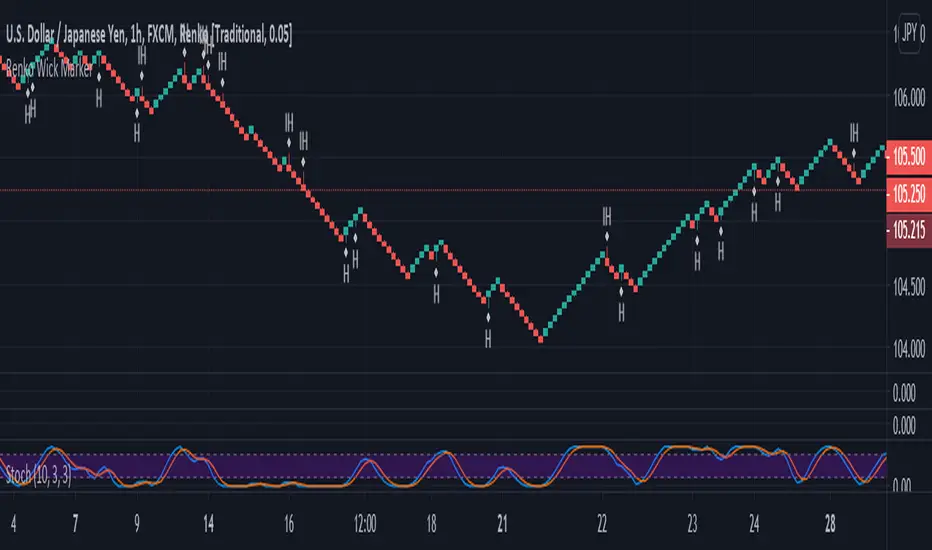
AOAHey Fam,
Welcome to the AOA.
It's my Awesome Oscillator I use every day in conjunction with Renko. Very powerful for spotting divergences and provides great confluence for level to level traders. Can also be used on a candle chart for trend confirmation.
Also includes the labels for divergences, toggleable inside the settings box when applied to your chart. (They're disabled on my chart)
Alerts include:
1. AO Bear Div
2. AO Bull Div
3. AO Crossing Down 0
4. AO Crossng Up 0
5. AO Two Tick Bear
6. AO Two Tick Bull
** Two tick is a great confirmation signal. **
Enjoy!
Renko Simple OverlaySimple Renko Overlay that attempts to deal with the delay present in the Renko function while still using brick size from the Renko function.

Tick RenkoTick Renko, bars are formed on live chart.
note:there is a issue that creates artifacts while there is not enough history loaded.
Renko + CandlesThis indicator has been designed to show you both candle chart and Renko chart in one place.
I think most of you are familiar with candle chart which is working with the time and price movements but Renko chart is based on price differences and is not related to the "time" parameter.
so if you see a Renko brick is appear up(or down) to the previous brick it means that a certain and fixed price movement has been occurred (which mostly calculate by ATR). and also this indicator works in any time frame.
Remember because we want both charts we have time parameter in this indicator, and if the price doesn't move up or down a certain percentage from previous bars, it will plot a renko bar beside the previous one.
you can use this indicator to see if the price moves up or down.
Or you can determine the important support and resistances with much less noises.
it can be used as a confirmation for you to keep your positions or exit.
go ahead and discover it...
If you have any questions, don't hesitate! ask in the comments section below.

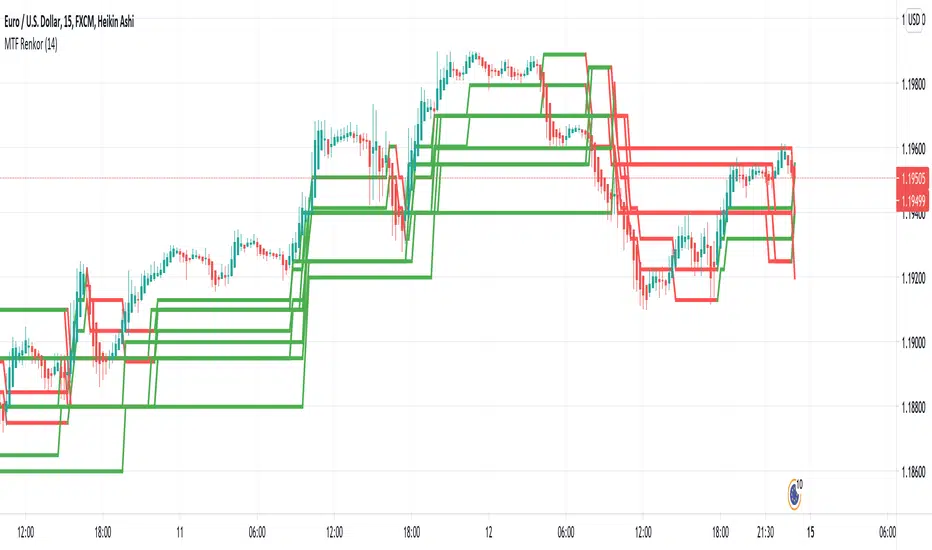
MTF RenkoThis indicator Should be opened on a 15 min chart
It will display the Renko Highs and lows of:
30 min chart
45 min chart
60 min chart
and
120 min chart
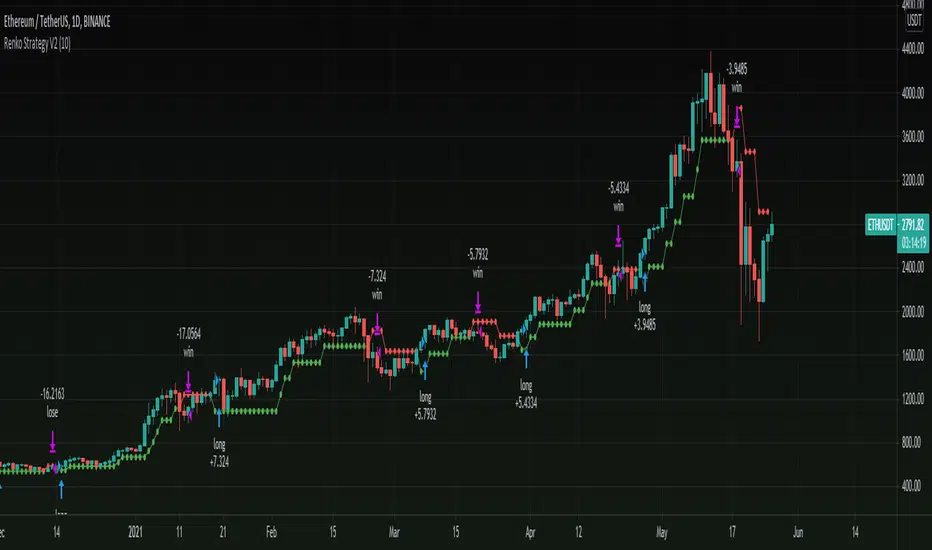
Renko Strategy V2Version 2.0 of my previous renko strategy using Renko calculations, this time without using Tilson T3 and without using security for renko calculations to remove repaint!
Seems to work nicely on cryptocurrencies on higher time frames.
== Description ==
Strategy gets Renko values and uses renko close and open to trigger signals.
Base on these results the strategy triggers a long and short orders, where green is uptrending and red is downtrending.
This Renko version is based on ATR, you can Set ATR (in settings) to adjust it.
== Notes ==
Supports alerts.
Supports backtesting time ranges.
Shorts are disabled by default (can be enabled in settings).
Link to previous Renko strategy V1:
Stay tuned for version V3 in the future as i have an in progress prototype, Follow to get updated:
www.tradingview.com
[MACLEN] HODL ZONE RENKO
PLEASE READ!
Trade at your own risk. Please read about renko charts before using this indicator. This indicator is for educational purposes only.
This Indicator is only valid in renko charts with 1 second timeframe. For BTCUSDT . With the traditional method and the size box of 80.
With this indicator we can detect zones of buy and sell. Even that is not recommended to use leverage, I use it to find an entry and use only small leverages. It could be also used to accumulate and HODL bitcoin .
Please, comment anything.
POR FAVOR LEER!
Tradea bajo tu propio riesgo. Por favor lee sobre las graficas renko antes de usar este indicador. Este indicador es solamente con fines educativos.
Este indicador es válido solamente en graficas renko con un timeframe de 1 segundo. Para BTCUSDT . Con cajas del método tradicional de un tamaño de 80.
Con este indicador podemos detectar zonas de compra y venta. A pesar de que no es recomendable usar apalancamiento, yo lo uso para encontrar entradas y solo uso apalancamientos pequeños. También podría usarse para acumular y holdear bitcoin .
Por favor, escríbeme cualquier duda o comentario.

Joseph Nemeth Heiken Ashi Renko MTF StrategyFor Educational Purposes. Results can differ on different markets and can fail at any time. Profit is not guaranteed. This only works in a few markets and in certain situations. Changing the settings can give better or worse results for other markets.
Nemeth is a forex trader that came up with a multi-time frame heiken ashi based strategy that he showed to an older audience crowd on a speaking event video. He seems to boast about his strategy having high success results and makes an astonishing claim that looking at heiken ashi bars instead of regular candlestick bar charts can show the direction of the trend better and simpler than many other slower non-price based indicators. He says pretty much every indicator is about the same and the most important indicator is price itself. He is pessimistic about the markets and seems to think it is rigged and there is a sort of cabal that created rules to favor themselves, such as the inability of traders to hedge in one broker account, and that to win you have to take advantage of the statistics involved in the game. He believes fundamentals, chart patterns such as cup and handle and head and shoulders, and fibonacci numbers don't matter, only price matters. The foundation of his trading strategy is based around heiken ashi bars because they show a statistical pattern that can supposedly be taken advantage of by them repeating around seventy or so percent of the time, and then combines this idea with others based on the lower time frames involved.
The first step he uses is to identify the trend direction in the higher time frame(daily or 4 hourly) using the color of the heiken ashi bar itself. If it is green then take only long position after the bar completes, if it is red then take only short position. Next, on a lower time frame(1 hour or 30 minutes) look for the slope of the 20 exponential moving average to be sloping upward if going long or the slope of the ema to be sloping downward if going short(the price being above the moving average can work too if it's too hard to visualize the slope). Then look for the last heiken ashi bar, similarly to the first step, if it is green take long position, if it is red take short position. Finally the entry indicator itself will decide the entry on the lowest time frame. Nemeth recommends using MACD or CCI or possibly combine the two indicators on a 5 min or 15 min or so time frame if one does not have access to renko or range bars. If renko bars are available, then he recommends a 5 or 10 tick bar for the size(although I'm not sure if it's really possible to remove the time frame from renko bars or if 5 or 10 ticks is universal enough for everything). The idea is that renko bars paint a bar when there is price movement and it's important to have movement in the market, plus it's a simple indicator to use visually. The exit strategy is when the renko or the lowest time frame indicator used gives off an exit signal or if the above conditions of the higher time frames are not being met(he was a bit vague on this). Enter trades with only one-fifth of your capital because the other fifths will be used in case the trades go against you by applying a hedging technique he calls "zero zone recovery". He is somewhat vague about the full workings(perhaps because he uses his own software to automate his strategy) but the idea is that the second fifth will be used to hedge a trade that isn't going well after following the above, and the other fifths will be used to enter on another entry condition or if the other hedges fail also. Supposedly this helps the trader always come out with a profit in a sort of bushido-like trading tactic of never accepting defeat. Some critics argue that this is simply a ploy by software automation to boost their trade wins or to sell their product. The other argument against this strategy is that trading while the heiken ashi bar has not completed yet can jack up the backtest results, but when it comes to trading in real time, the strategy can end up repainting, so who knows if Nemeth isn't involving repainting or not, however he does mention the trades are upon completion of the bar(it came from an audience member's question). Lastly, the 3 time frames in ascending or descending fashion seem to be spaced out by about factors of 4 if you want to trade other time frames other than 5/15min,30min/1hour, or 4hour/daily(he mentioned the higher time frame should be atleast a dozen times higher than the lower time frame).
Personally I have not had luck getting the seventy+ percent accuracy that he talks about, whether in forex or other things. I made the default on renko bars to an ATR size 1 setting because it looks like the most universal option if the traditional mode box size is too hard to guess, and I made it so that you can switch between ATR and Traditional mode just in case. I don't think the strategy repaints because I think TV set a default on the multi-time frame aspects of their code to not re-paint, but I could be wrong so you might want to watch out for that. The zero zone recovery technique is included in the code but I commented it out and/or remove it because TV does not let you apply hedging properly, as far as I know. If you do use a proper hedging strategy with this, you'll find a very interesting bushido type of trading style involved with the Japanese bars that can boost profits and win rates of around possibly atleast seventy percent on every trade but unfortunately I was not able to test this part out properly because of the limitation on hedging here, and who knows if the hedging part isn't just a plot to sell his product. If his strategy does involve the repainting feature of the heiken ashi bars then it's possible he might have been preaching fools-gold but it's hard to say because he did mention it is upon completion of the bars. If you find out if this strategy works or doesn't work or find out a good setting that I somehow didn't catch, please feel free to let me know, will gladly appreciate it. We are all here to make some money!

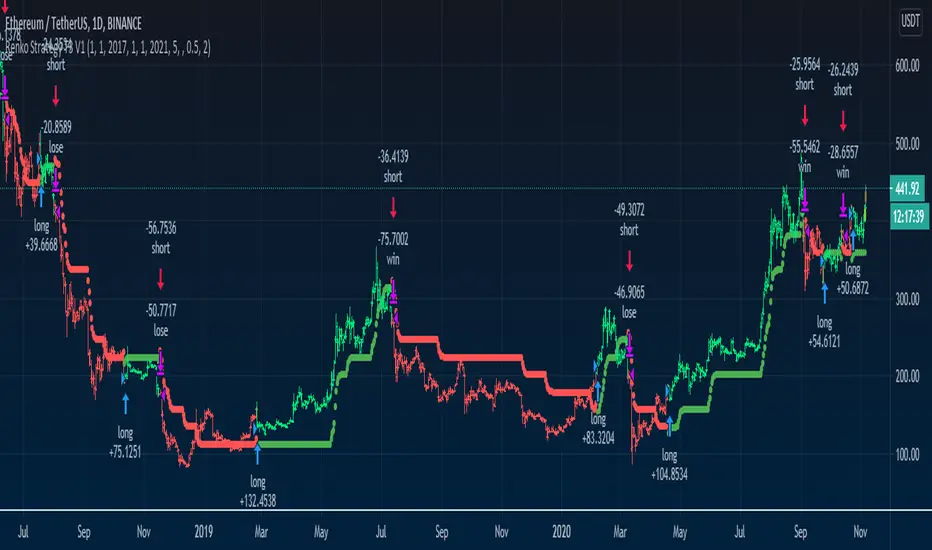
Renko Strategy T3 V1An interesting strategy using Renko calculations and Tilson T3 on normal charts targeted for cryptocurrencies but can work with different assets.
Tested on Daily but can work with lower frames using Renko Size and T3 Length adjustments.
== Description ==
Strategy get Renko close/open/high/low values and smooth them with T3 Tilson.
Base on these results the strategy triggers a long and short orders, where green uptrending and red downtrending.
Including Alerts
== Repaint ==
There seems to be some sort of inconsistency when doing 'Replay' function with the strategy, which means using Replay function won't trade like if you see the trading results without Replay. Regarding real time, it does not seem to repaint, besides that you need to wait for the last active bar to complete for it to give you indication.
You can disable strategy to use it has a sole indicator.
There might be a new strategy of Renko Strategy V2 in the future as i have an in progress prototype, Follow to get updated:
www.tradingview.com
Renko Bar ChangeI realized it's not in the TV Library so I think it's mandatory to add.
If you wish to access and use for yourself contact me - I reply on Average in less than 4 hours on a 60 day period.
---
Renko Bar Change Indicator Documentation:
Renko Parameters:
Set Box Size either via ATR or your own Float-Value after choosing the correct Renko Style-Option.
Both Renko Style Options are self-explanatory.
Alerts and Plots:
1) Green arrow visualizing a green Renko bar after a red Renko bar
2) Red arrow visualizing a red Renko bar after a green Renko bar
3) Alert for green Renko Bar after red Renko Bar
4) Alert for red Renko Bar after green Renko Bar

Renko Dots [racer8]Description:
The idea behind this indicator is to have the Renko chart alongside with your main chart. What this indicator does is that it plots the values from the Renko Chart directly onto your main chart. So, you don't have to switch between Renko and OHLC charts anymore!
Parameters:
Renko Dots has to 2 parameters: Method & Length.
Method can be either Traditional or ATR. These are 2 different styles of Renko. Personally, I prefer ATR.
Length controls traditional Renko bar's fixed price range or controls the ATR period.
Signal Interpretation:
These Renko values are plotted as "Renko Dots" on your chart. The dots can be either green, red, or blue depending on market movements.
Green - new Renko bar (bullish)
Red - new Renko bar (bearish)
Blue - no new Renko bar (consolidation)
What is a Renko chart?
A Renko chart is a special chart that modifies a regular price chart's information about the close price and transforms it into Renko values that are plotted as Renko boxes on a chart. These boxes typically have a fixed range, say 10 pips for example. So if price moves at least 10 pips, a box is formed. Alternatively, the box's range can be set to the ATR....so in this case, each box represents a move of 1 ATR.
For more information on Renko charts, visit Investopedia.com, here's the link: www.investopedia.com
Renko Dots' advantages over standard Renko chart:
- Can compare & apply it to other price charts (ohlc, candlesticks, line charts)
- Can apply it to other modified price charts (Heikin-Ashi, Renko, Line-Break)
- Can use it to trade alongside with the main chart
- Works across all instruments/markets and all time frames
- Plots consolidation (blue dots) ... (standard Renko doesn't consider time)
Enjoy :)
Renko MTF - Traditional and ATRSomehow there aren't too many renko bars that have the traditional setting built-in so I put one up. This one has the option to choose between Traditional and ATR, the size number corresponds to the option that was chosen. And just in case if anyone wanted, I put up a multi-time frame option to choose the time frame the bars take place. D is for day, W is for week, flat numbers are in minutes, and leaving it blank looks at the current time frame the chart is in. The calculation comes from how Tradingview handles renko bars.
Renko bars don't paint a color unless the market moves a certain amount based on its settings. When the market moves up it turns green, if it moves down it turns red, simple color changes alone can say a lot. They're a good way to try to find trends somewhat objectively and seem to be a good way to eliminate time and can replace other time-based indicators that can whipsaw or lag. The bars have a tendency to repeat themselves so it's a good way to find trends. There aren't too many settings for the box size, most people either just choose 5, 10, 14, etc where as other indicators have many options that differ on different markets. The numbers can be chosen easily enough to pick a sweet spot with just a single input where other indicators such as MACD have multiple inputs to pick the right number that can make it difficult to choose from(although it won't be as precise as a MACD would sometimes but can be worth the objectiveness and consistency and same setting repeatability in different markets in my opinion). Some example strategies could be to use them as an alternative trailing stop, finding trends, a simple color change for entry and exit on top of other strategies, etc. It can do the job of many in an all in one price action type indicator(although not better all the time, it can come close enough). Despite all this, it does seem to depend on which time-frame it's being looked at, how TV does the calculation for it, and how one can use this with the lack of practical information on it out there.

[NLX-L2] Renko Flip- Renko Flip -
This indicator give you signals based on non-repainting Renko blocks (ATR based) on regular candle charts and is Multi-Timeframe compatible.
- Example: How to Use -
1. Add a Trend Indicator like Trend Index MTF to your chart
2. Add this Renko Flip Indicator to your Chart and select the Trend Index MTF with Type L1 in the Settings as Signal Source
3. Add the Backtest Module to your Chart and select the Renko Flip Signal with Type L2 as Source
The Hurst-Exponent-Signal-Filter can be used as well, simply add it in between the Renko Flip and Backtest/Alert module :)
- Alerts for Automated Trading -
See my signature below. Contact me for the Alert module.