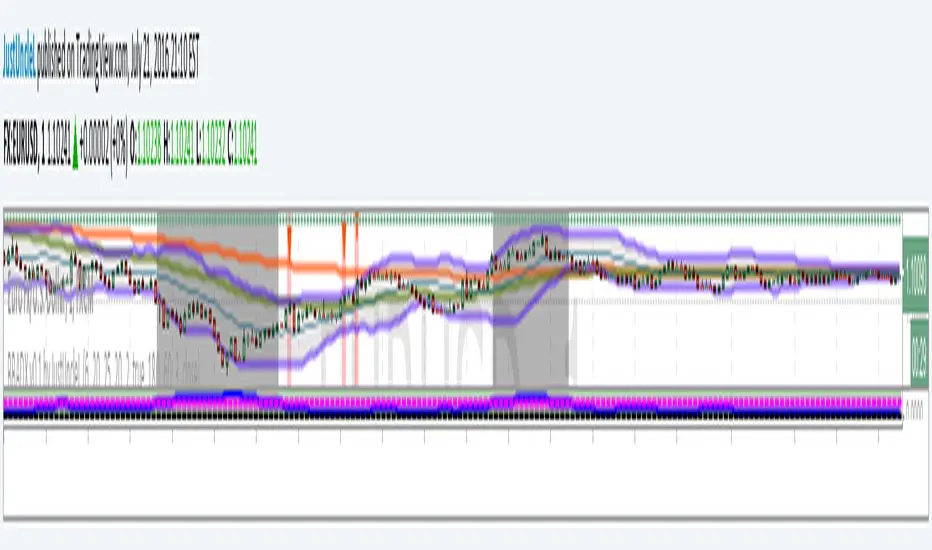
market phases - JDThis indicator shows the relation of price against different period ma's.
When put in daily Timeframe it gives the 1400 Day (= 200 Weekly) and the 200 ,100 an 50 Daily.
The lines show the 200,100 and 50 ma in relation to the 1400 ma.
JD.
#NotTradingAdvice #DYOR
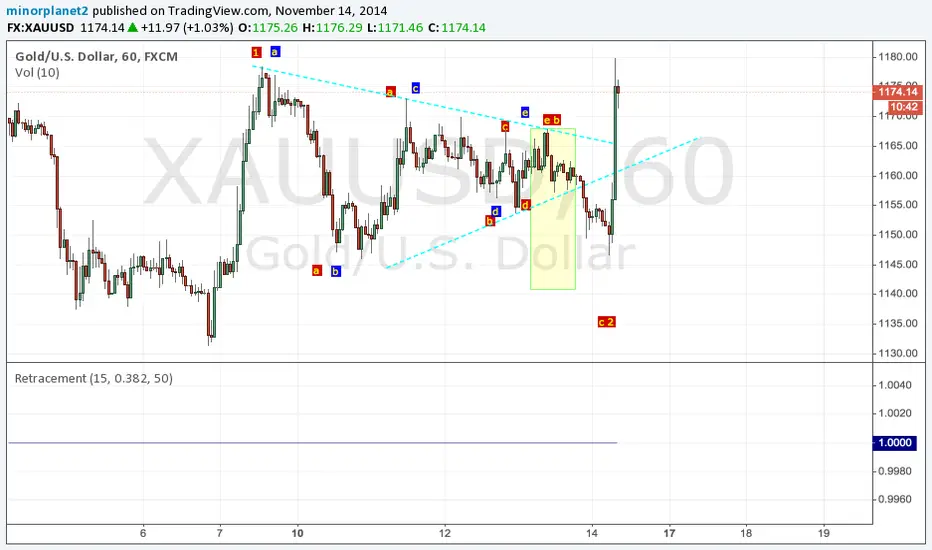
Retracement

Golden Fib WavesDynamic Fibonacci levels in pleasing gold shades. Smoothing (SMA) of swing lows and highs enabled by default. Boldly, this just looks good. I am not sure whether it is of any help for trading purposes. If you do in fact find it useful, feel free to drop me a line and to share your insights.

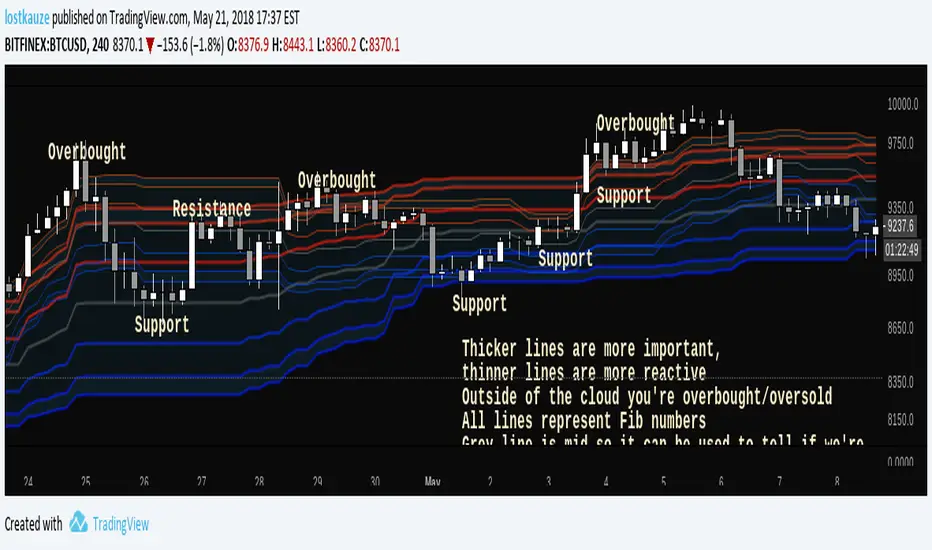
Fibonacci CloudInspired by Ichimoku Fibonacci Hybrid , this indicator is for those who don't mind a lot of lines. All lines represent Fib ratios: thicker lines are fibs for a longer period, while thinner lines are fibs for a shorter period.
- Dynamic S/R
- Overbought/Oversold zones
- Trend indicator
- Customisable periods
- Fast/Slow crossovers
See what works for you!
Fibonacci Auto ModeThis script is an attempt to display Fibonacci Levels in Auto Mode.
It allows for:
Select Higher Time Frame (HTF)
Indicate How Many Bars from HTF to Use to Find Highs/Lows
Manual Mode: Overrides HTF selections
Number of Bars Back to use in Manual Mode
Show/Hide each one of the Levels
Highlight RLZ

Hybrid Pivot Zones [DW]This is an experimental study designed to identify potential areas of support and resistance using a hybrid between Camarilla and Fibonacci pivot calculations.
The levels are calculated by taking 110% of the previous interval's range multiplied by 8.33%, 16.67%, 25%, 50%, 61.8%, 78.6%, 100%, 127.2%, 141.4%, and 161.8%, then adding them above and below the interval open.
Custom bar colors are included.

Daily Deviations (Self Input Version)
Plots the standard deviation resistance/support levels.
Input the previous settlement price and the implied volatility.
credit to u/UberBotMan and u/Living_Granger for the idea and formulas
(preview example is using settlement of 2420 and IV of 11)

Bollinger Band and ADX Retrace Alert v0.1 by JustUncleLThis script is an implementation of a well known Bollinger band + ADX retracement strategy for 1min to 15min charts. This variation uses my own settings, a market direction filter and has an alert that can be added to your trading alarms.
Bollinger Bands Fibonacci ratiosThe Fibonacci Bollinger Bands indicator is based on the same principles as the standard Bollinger Bands indicator developed by John Bollinger. The Fibonacci Bollinger Bands indicator bases its upper and lower bands on volatility just like the Bollinger Bands indicator does, but instead of using standard deviation as the measure of volatility, a Wilders Smoothed ATR is used in its place.
The middle band is a moving average used to establish the intermediate-term trend. The 3 upper bands are constructed by using the Wilders Smoothed ATR and multiplying it by each of the Fibonacci factors (1.618, 2.618, and 4.236) and then adding the results to the middle band. The 3 lower bands are constructed in the same manner as the upper bands except their results are subtracted from the middle band.
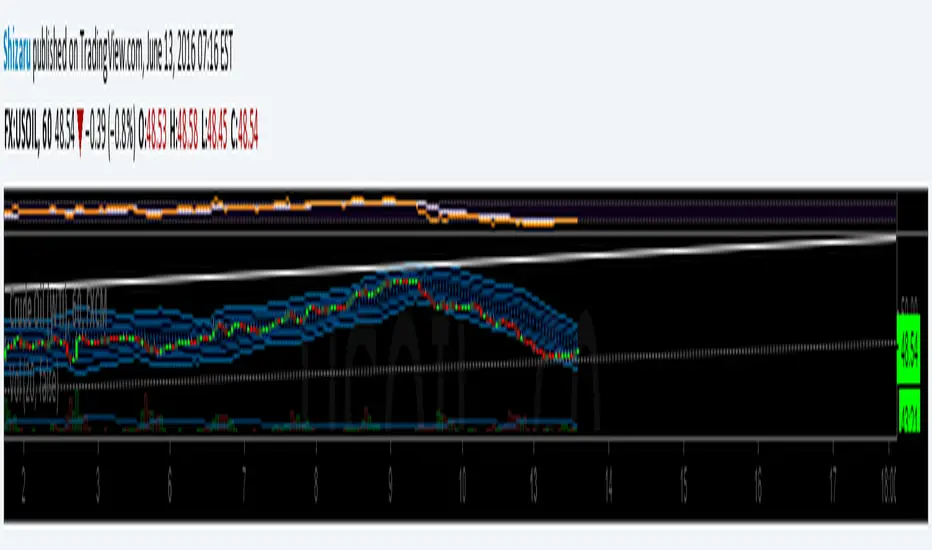
MA_FibBand_MTFMoving average of High, Low & Close with Fibonacci bands calculated from the average high and low. Four upper levels are to the power of 1.618, 2.618, 3.618 & 4.618. Four lower levels are to the power of 0.618, 1.618, 2.618 & 3.618. Included are a choice of time frames either current, semi-custom or fully custom allowing freedom to set any period you like which makes it great for historical averages. Adapted and expanded from Clarke Moody's MA_MTF i have tidied the script and included all CM's formulas although should be used in SMA or EMA i kept the other MA formulas for curiosity.
My preferred usage is to stick with 20ma and adjust the legnth of the period. Shown here is 20ema of 10day period.
More information can be learnt from 'endlessmountain' on youtube but only the very top and bottom levels are used with the High, Low & Close. Also i am not aware if this originates from any other source.
Thankyou to Clarke Moody and endlessmountain. Hope you like this tool.

Rob Hoffman's Inventory Retracement Bar - by UCSgearsClaims by Rob Hoffman
Developed and used to win trading competitions around the world, the Hoffman Inventory Retracement Trade is quickly becoming one of the most popular ways to identify where short-term counter trend institutional inventory has subsided and when it’s time to re-enter into a trade’s original trend direction.
I have not included the TREND condition.
- Enjoy
Rob Hoffman Inventory Retracement Bar - tradersonline-mag.com

Retracement Level TriggerI use the simple script to notify me when a retracement level has been met. I use the SMS alert to tell me when a specific retracement level has been met from a local pivot a high or local pivot low. Please let me know what you think. Feel free to make improvements and repost.