Signal Table - AutoFib - SMA - EMA - RSI - ATR - VolWith this indicator you can add a table on top of your chart.
What's in this table?
On which graph you open this table, the indicator data at the selected time of that graph are written. In the image below, you can see the table in the upper right.
You can also see two EMAs above the chart in this indicator. You can adjust their length.
You can add automatic fibonacci retracement levels to the top of the chart. In this way, you can see the Fibonacci levels on the chart and determine the support resistance. If the price is above the Fibonacci level, it will appear green on the chart, and red if below. You will understand as you use it.
It turns red if the RSI is below 30 and green if it is above 70.
Likewise, if the price is above the moving averages you have set, it appears as green, and if it is below it, it appears as red.
You can hide and activate the EMA and Fibonacci levels above the chart.
For example, you can get the ETH chart while the BTC chart is open in front of you. I think you will understand everything clearly from the settings tab below. Please support me. I hope you will be satisfied using it.
Rsi-ema

RSI DINGUE - 3³ DivergenceThis is the updated version for PineScript V5
3x RSI indicator into 1. You can turn on or off all of them.
Each RSI has 2 individual Moving Averages that can also be changed to be "Full RSI" in the settings.
This makes 3x3 = 9 indicators on screen at the same time. (you can turn them on or off)
It has Bullish and Bearish divergence and hidden divergence as well.
Several visual options to show crosses between RSIs and or MAs fill in colors, background colors, midline. Overbought and Oversold levels with signals when entry and exit.
---------------------
In closing, no indicator can give perfect signals, you need to use them in conjunction with other information to make better decisions.
I hope you like my indicators and that they help your trading.
If you have any questions please ask.
Thank you.

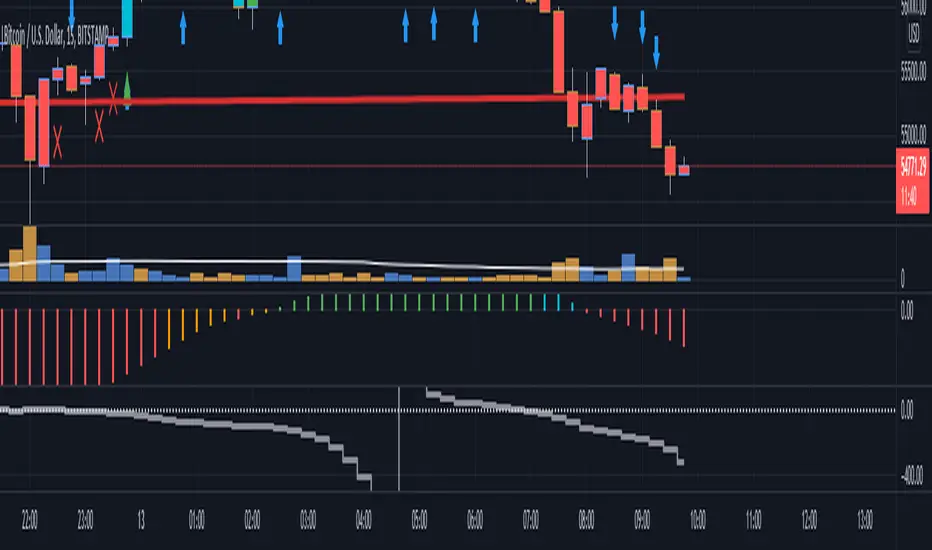
PBK Trend Band with EntryTrend band with background coloring of the trend.
Use 5, 15 for fast detection on EMAs
Additional arrows show under some favorable conditions.
This is work in progress, I release this version so that some good friend can make use of it.
GoldenCO Aie2 Use of GoldenCO Aie2
This market price movement trend analysis uses exponential moving average which is ema5/20/50. The purpose of using this EMA is to find out the effect of price changes that occur and the current trend of the market whether bullish or bearish.
It is suitable for short-term or long-term trading.
for short term trading, the trader uses ema5-ema20 and for long term trading the trader can use ema5-ema50 as analysis.
This indicator serves as a guide to traders in trading activities.
we hope that, by recognizing and knowing the trend of this price movement it can help traders in trading activities well and can reduce risk. May it benefit the trader.
DISCLAIMER : This is not Buy/Sell call, just sharing idea analysis for education. Trade at your own risk.
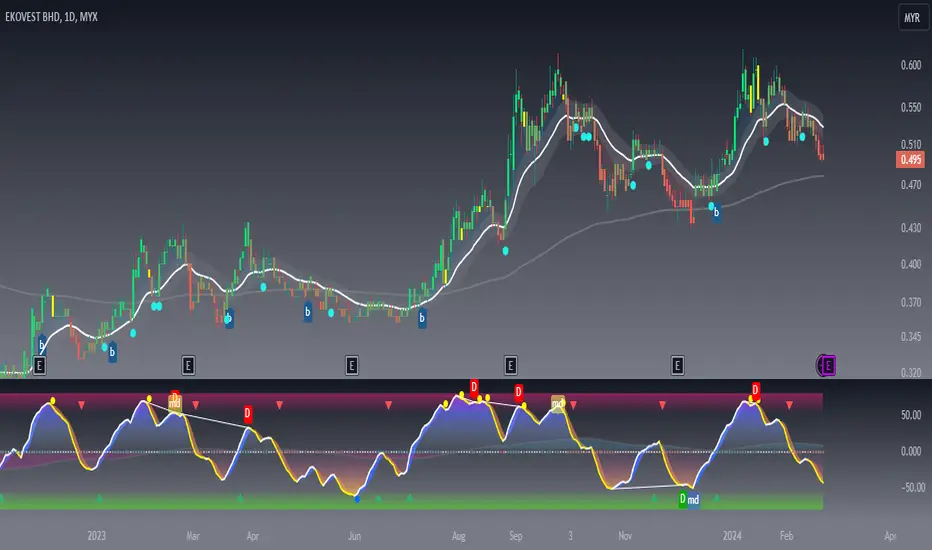
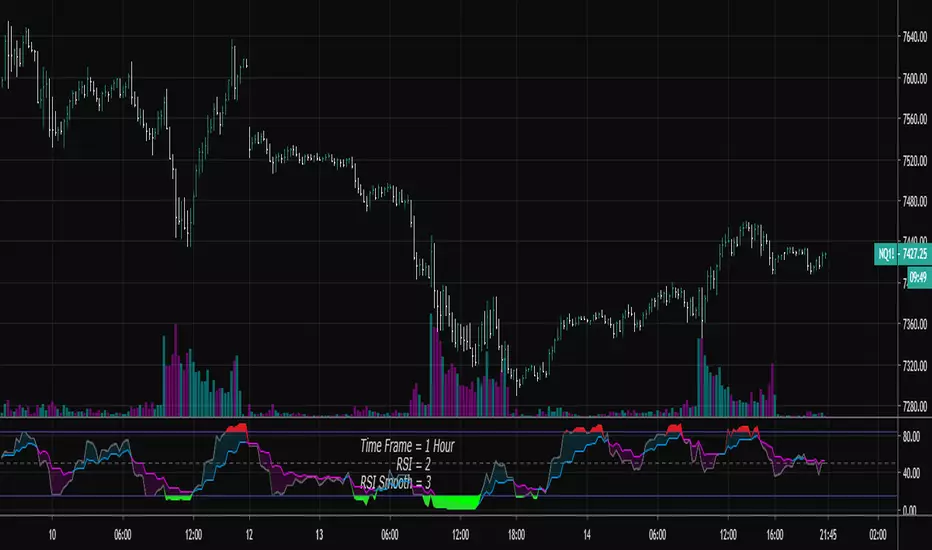
GODXBT OSCGodxbt Osc is Oscillator based on PRICE ACTION,VOLUME AND RSI (RELATIVE STRENGTH INDEX)
Allows you to understand the market trend based on price action
Includes guppy on RSI for better understanding of the trend
Blue trend on guppy suggests market is bullish
Red trend on guppy suggests market is bearish
Green triangle suggests price is about to go higher
Red triangle suggests price is about to go lower
Bar colours based on oscillator movements
Green bars are for bullish trend
Red bars are for bearish trend
No bar colors suggests trend is fading suggests take profits points
Dm for access

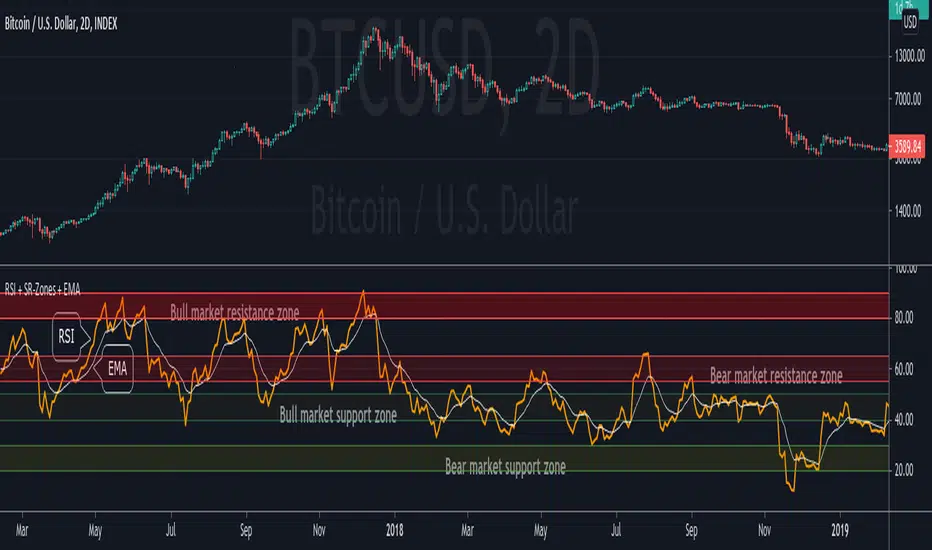
RSI + Support/Resistance Zones + EMAThis indicator enhances the RSI with support and resistance zones and an EMA.
RSI: a regular RSI (default: orange / 14 period)
EMA: an EMA on the RSI (default: light gray / 10 period)
RSI support/resistance zones
SR-Zones for bull markets: In a bull market the price tends to find resistance between 80 and 90 and support between 40 and 50 RSI.
SR-Zones for bear markets: In a bear market the price tends to find resistance between 55 and 65 and support between 20 and 30 RSI.
The concept of these support and resistance zones has been popularized by Constance Brown in her book Technical Analysis for the Trading Professional . The SR zones are described in the first chapter which is available in the preview section on Amazon.
RSI-EMA
The EMA on the RSI can also be used as support and resistance. For example, you can be use it for a simple strategy such as the following: In an uptrend after a significant correction during which the RSI has been below the EMA for some time, wait for the RSI to cross above the EMA to go long and exit (partially) after the RSI crossed down the EMA.
Hint: All visual elements (RSI, EMA, support zones) can be enabled/disabled and adjusted individually.
rsi_MiguelSlightly different RSI . It is shown the Ema RSI with leght 2 in order to clean some "noise" and become easier to read. It shows in green possible "buy moments" and in red possible "Sell moments". Those are calculared with a slower and a faster ema ( rsi ). It is the RSI that I use and hope it helps someone.
Profit Accumulator Relative Strength IndexHi Everyone
Thought I'd share this nice and simple RSI indicator with you which uses short and long length crossover to determine potential long and short trades. This indicator also has multiple timeframe functionality.
Please use this with other indicators or price action etc to confirm long and short trades.
Personally I like to see the crossover on the longer timeframe and close out on a lower timeframe (i.e. spot the entry on the 1hr charts and close my position based on the 15min)
If anyone would like alerts putting on here for crossover then just let me know.
Cheers
Mike

DRC's Force Index
Version 1.2 Update:
No need for scaling up/down anymore
No need for setting up so many parameters
Ability to mix instantaneous indicator with averaged indicator (its different from just making a moving average)
Mass obtention has been improved
Velocity calculation has been improved, by considering highs and lows
Acceleration calculation has been simplified

(JS) Double StochasticThe idea for this indicator came from looking at the Stochastic RSI. The Stochastic RSI takes the RSI reading then applies the Stochastic formula to it - an indicator on top of an indicator. Using this logic, I decided to try using a Stochastic on the existing Stochastic in order to smooth it out - hence the "Double Stochastic". I have also added the option to add RSI on to the indicator as well (with smoothing if you'd like).
Resolution:
I added this so you can look at the reading on any time frame.
K & D:
This is the standard K% and D% used with the Stochastic indicator - the numbers modify the length of their calculations.
Smooth:
This is the smoothing calculation, also from the normal Stochastic indicator.
Use Second Stochastic:
This adds a second Stochastic on to the chart for analysis.
K & D 2:
This is the parameters used to calculate the second K% and D% lines.
Smooth 2:
This is the smoothing interval for the second K% and D% lines.
Use K% and D%:
The default for this is to have it on. What it means is that you wish to see both the K% and D% lines (watching for a cross). If you turn this off, the plot switches to a K% & D% difference line. It is just one line that plots the distance between the two.
SMA Length Using Difference:
If this is on, then you can smooth the difference plot with an SMA, obviously if you just want the raw difference to plot, then set this to 1.
Use RSI:
Since both RSI and Stochastic use a 0-100 scale, I added the ability to plot the RSI along with the Stochastic. This will not plot if you are using the Difference plot, being that plot isn't on a 0-100 scale.
Smooth RSI:
I also added the ability to smooth the RSI if you'd like, you can turn this off for the standard RSI reading.
RSI Length:
This is the period of bars used to calculate the RSI.
RSI Smoothing Length:
This is the smoothing interval if you'd like to apply a moving average on the regular RSI reading.
RSI Smoothing Use EMA:
This makes the RSI smoothing use an EMA, when off an SMA is used instead.
RSI Source:
And finally, this is the source used to calculate the RSI value.
I hope that you all may find this useful, I have been using it myself with a lot of success. Any questions, please leave them in the comments, thanks!

RSI HistogramThis an experiment to visualise the famous RSI indicator within a Histogram.
Opposed to regular RSI this RSI is plotted into a Histogram and uses different scales (100 to -100), in addition it has the ability to smooth the RSI with various moving averages like HMA, JMA and KAMA.
About RSI:
The RSI measures recent performance of a given stock against its own price history performance, by combining the average gain or loss a particular security owns over a predetermined time period.
Bars can be colored in Settings (Disabled by default)
Enjoy and like if you like :)

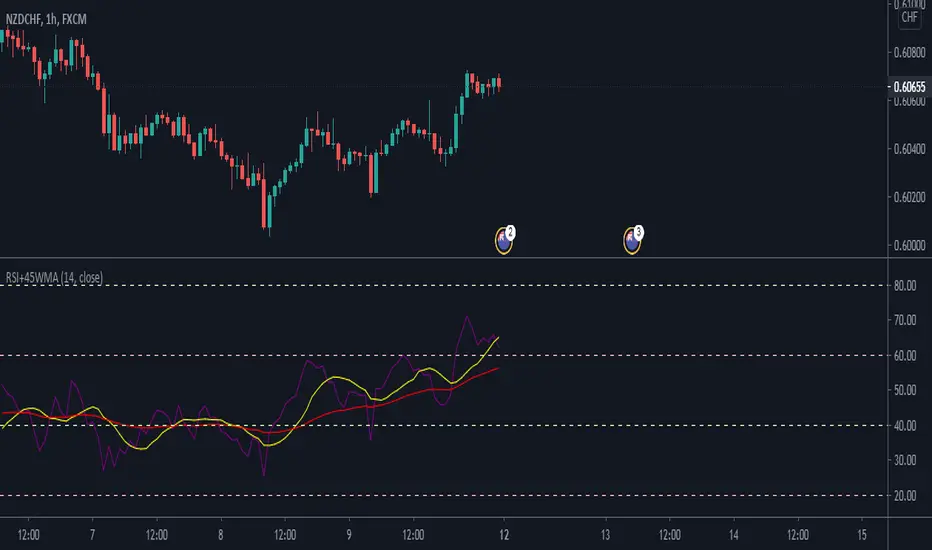
@thecf RSI + 12-EMA + Magic 89-EMA + RangesThis RSI has a couple modifications. It works with bullish and bearish control zones and implements both a 12 EMA as well as the "magic" 89 Moving Average.
First, the ranges. Whenever the RSI moves above 65 the bulls are in control.
Whenever the RSI moves blow 45 the bears are in control. Everything in between in neutral. Traders can use these levels for information on strength of either bulls or bears and also for support and resistance .
Both EMAs are best used for crossovers, as well as support and resistance .
The idea for the "magic" 89 moving average, originally stems from Fibonacci values that some traders like to use for support and resistance on price.
From observation, it holds more information though, when used as a moving average of the RSI and in combination with a 12 EMA .
When the RSI crosses above the 89 moving average, it can be interpreted as a potential shift in trend up. The 12 EMA then shortly afterwards usually confirms it by also crossing above the 89 moving average.
The 89 moving average can also signalize a potential shift in trend coming up when reaching 70.
The magic MA works best on timeframes like the daily and upwards.
For more information about the indicator feel free to leave a comment.

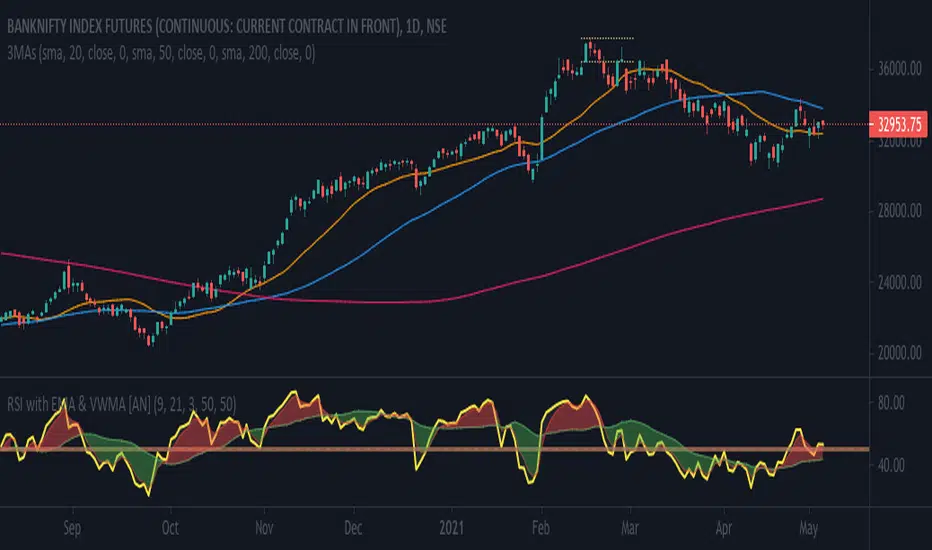
RSI with WMA & EMA [AN]Key Factors traced
- Price: EMA (Exponential Moving Average)
- Volume: WMA (Weighted Moving Avg.)
- Strength (Momentum): RSI (Relative Strength Indicator)
Default parameters
1. RSI at 9. Over brought & Under sold to 50 to be used as a median. This can be altered to the traditional 70:30 or 60:40
2. WMA at 21
3. EMA at 3, Exponential for Intraday trades
CCI & EMA_CROSS_PaydarCCI & EMA_CROSS_Paydar
Hello everyone
This indicator is actually a very efficient oscillator,
This system is a unique combination of indicators CCI and EMA, which of course has special settings, these settings are adjusted as much as possible due to signaling.
As you can see in the picture:
CCI: the two colors line, green and red, are actually the same indicator CCI that I set to 20.
*Note that in index CCI I have set the lines +100 and -100 to +75 and -75 for less error and a stronger signal to sell or buy.
EMA: The white line, which is in the form of steps, is in fact the same indicator of EMA, which I have considered as a value of 9.
_________________________________________________________________________________________________________
Instructions
-> areas:
Zone +75 to +200 = positive range or incremental price or bullish
Zone +75 to -75 = Neutral range or almost constant price (no fluctuations or very wet fluctuations)
Zone -75 to -200 = single range or discount price or bearish
->How to use:
Buy = In the bearish range, if line CCI intersects line EMA upwards and goes to the neutral zone.
None = if the index (or index lines) collide in the neutral zone
Sell = In the bullish range, if line CCI intersects line EMA down and goes to the neutral zone.
-> Please comment on this system or if you have a good experience in changing the values of the indicators or it seems to you, please share.
With great respect to:
Who had published the main idea of this system.

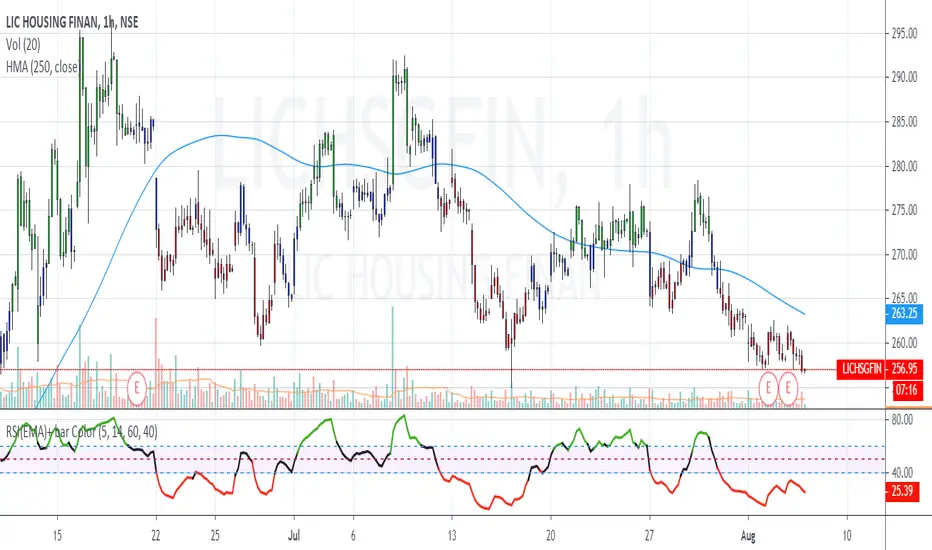
RSI(EMA) - Reducing Noise This script is a modified version of the Relative Strength Indicator ( RSI ). While using RSI to trade the markets, the signals generated are very choppy.
Approach 1. One way to reduce this noise is to use a higher period for the RSI calculation. (say 20 instead of 14 period). In this approach, the valid signal comes quite late.
Approach 2. My unique solution is to use a Exponential Moving Average as the input for the RSI calculation. Usually RSI calculations are based on close value of the candles. If we use an appropriate EMA value, then the signal efficiency will increase.
Using the approach 2, strategies similar to regular RSI can be utilized i.e. RSI breakout, RSI divergence, RSI Hidden divergence.
RSI Colors explained
GREEN = BULLISH momentum when RSI >60
RED = BEARISH momentum when RSI <40
BLACK = NEUTRAL market conditions when RSI is between 40 and 60
Breakout Strategy
LONGS - RSI color is GREEN + Price breaks a Resistance
SHORTS - RSI color is RED + Price breaks a Support
Recommended default settings: EMA =7 period , RSI =14 period
ADDITIONAL TIP: Works wonderfully with Pivot Points (standard)
I recommended to use on minimum 5 MINUTE timeframe for intraday trades . But you can use different timeframes as well.
Please leave comment below If you have any question or development idea.
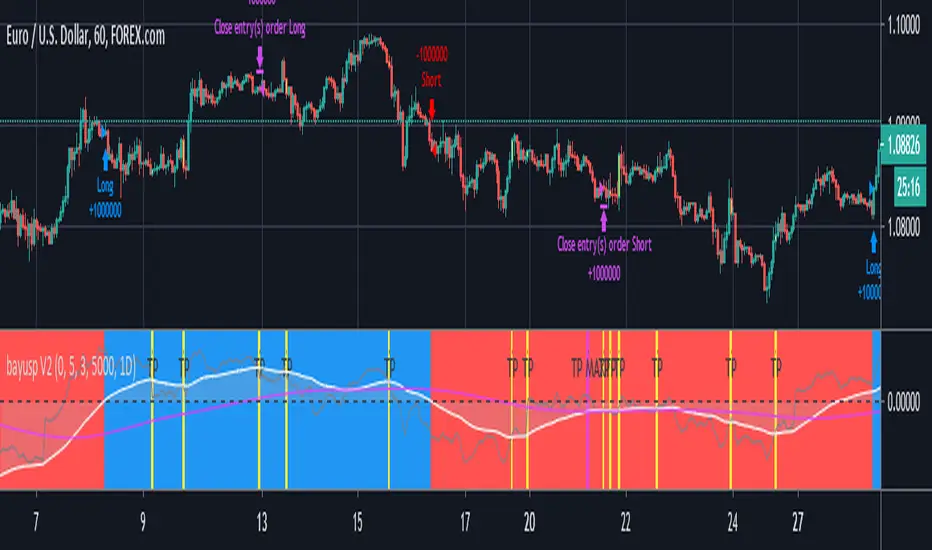
bayusp V2Using multi source like RSI , MACD , Stochastic , SMA , EMA and Huge Noural Network to Predicted Open Position.
Sell Gravitation IndexThe Sell Gravitation Index was created by Howard Wang and was published in Stocks & Commodities V37:02 (36-38)
This indicator is similar to the relative strength index but the big difference is that this indicator gives early buy and sell signals which I find very helpful. Buy when it rises above its signal line and sell when it falls below its signal line.
Let me know if you would like to see me publish any other scripts!

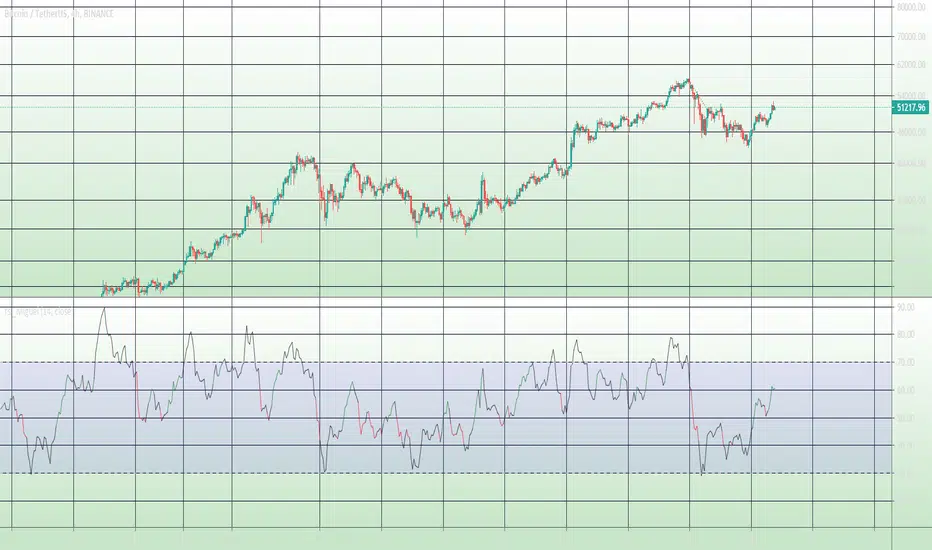
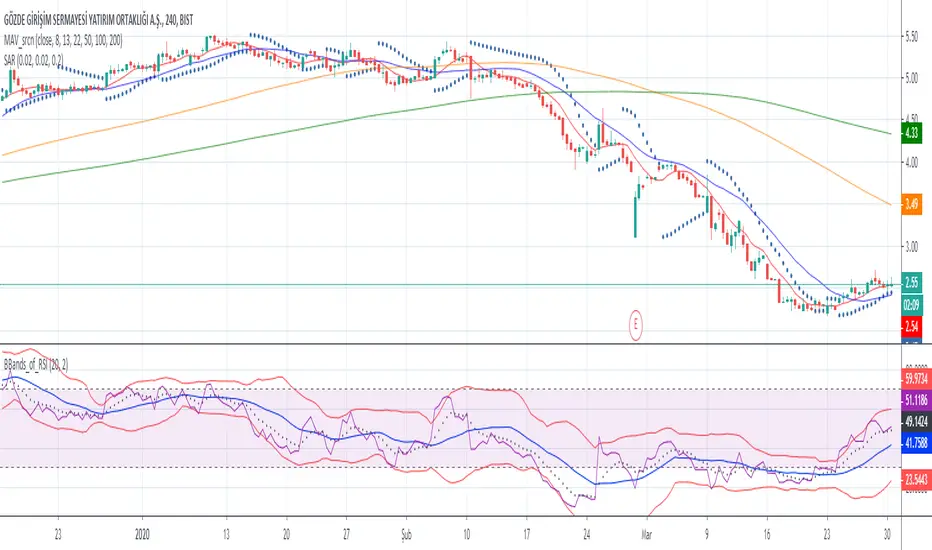
Bollinger Bands of RSIwith this script you can follow ema8 of RSI and also SMA20 of RSI with ∓ 2 standart deviation
DW-RSI EMA with EMA of RSIThis is an RSI Oscillator with an EMA of the RSI for a signal line. The RSI line is Green when above the signal line and Red when below the signal line.
This does not use the traditional 30% / 70% over sold / over bought analysis. Therefore the levels are not shown.
The analysis is this:
When the RSI is above the signal line then price has a bullish bias.
When the RSI is below the signal line then price has a bearish bias.
I wrote use this for Forex Spot Currencies where I feel overbought and oversold may be less valid than it may be in other markets such as stocks.
As with all indicators, do not use as your sole reason to enter the market, but use with other indicators or price action signals to get a confluence of signals to confirm your entry.
I use it with an 8, 21 and 50 EMA to confirm entry and exit. I give it more weight for exits than I do for entries.

RSI w/ MAs & DivergencesTo best use the RSI Divergence indicators, adjust the following settings accordingly.
• RSI Bullish Divergence Under: 20 – 45 (lower for larger volatility and more bearish markets)
• RSI Bearish Divergence Above: 55 – 80 (higher for larger volatility and more bullish markets)
THIS SCRIPT DOES NOT REPAINT AND IS COMPLETELY FREE.

RSI with Moving Averages[UO]This RSI indicator is one of my favorite indicators. This powerful indicator is implemented by Phi-Deltalytics. I modified the drawing so that it is easier (at least for me) to see the signals and trends (it would not matter if you're doing algorithmic trading).
Trends and signals. For detailed instructions and tutorial see Phi-Deltalytics page

RSI Shaded - MTF
Non-repainting multiple time frame RSI with shading of overbought and oversold levels.
Includes option for simple moving average smooth of the RSI (Larry Connors)
Includes option to plot the EMA of the RSI
Related to RSI Shaded .
For other multiple time frame indicators see:
Adaptive ATR-ADX Trend
Fisher Transform MTF
ADX-DI MTF
Laguerre RSI MTF