Stabilized HMA ScalperStabilized HMA Scalper / Stab. HMA 2.0
Stabilized HMA Scalper is a visual trend-structure overlay indicator designed to highlight directional momentum, trend alignment, and market state through a combination of adaptive moving averages and contextual visual cues.
The indicator blends a Hull Moving Average (HMA) for responsiveness with an ALMA-based baseline filter to stabilize trend interpretation and reduce noise. The result is a clean, visually expressive framework for reading market structure directly on the price chart.
Core Design Philosophy
This script is built around trend confirmation and state visualization, not prediction or automation.
All elements are calculated on confirmed bar closes and do not repaint.
The indicator focuses on three analytical dimensions:
1. Dual Moving Average Structure
Hull Moving Average (HMA)
Acts as the primary momentum curve.
Designed for fast reaction to directional changes.
Slope behavior is used to infer momentum expansion or contraction.
ALMA Baseline Filter
Provides a stabilizing reference for broader trend context.
Helps distinguish directional movement from short-term fluctuations.
Used as a structural filter rather than a trigger mechanism.
2. Trend State Visualization
When HMA slope and price position relative to the ALMA baseline align, the indicator visually highlights the active market state:
Bullish alignment: upward momentum with supportive structure
Bearish alignment: downward momentum with confirming structure
Neutral / range: mixed conditions or transitional phases
A dynamic gradient fill between HMA and ALMA visually reinforces this alignment, offering an immediate understanding of trend strength and continuity.
3. Visual Markers & Labels
Discrete chart markers may appear at moments when momentum structure transitions into a new aligned state.
These markers are contextual annotations, intended to draw attention to changes in trend conditions rather than to provide standalone decisions.
They are based solely on historical price data and are fully non-repainting.
Dashboard
An optional on-chart dashboard summarizes the current market state classification (Bullish / Bearish / Range) based on the internal trend logic.
Position and size are fully configurable.
Designed for at-a-glance situational awareness.
Reflects the same logic used in the chart visuals.
Usage Disclaimer
This indicator is provided for technical analysis and educational purposes only.
It does not generate financial advice or guarantee outcomes and should be used as part of a broader analytical workflow.
Scalpingcrypto

Pressure Reversal Engine - Scalp [BullByte]PRESSURE REVERSAL ENGINE - SCALP
OVERVIEW
Pressure Reversal Engine - Scalp is a professional reversal indicator built for scalping and active trading on any market including Forex, CFDs, crypto, and stocks. This multi-engine buy sell signal system works without volume data, making it ideal for instruments where volume is unavailable or unreliable.
━━━━━━━━━━━━━━━━━━━━━━━━━━━━━━━━━━━━━━━━━━━
THE PROBLEM THIS INDICATOR SOLVES
Traditional reversal indicators and buy sell signal systems often struggle with:
- Dependence on volume data (unavailable for Forex pairs, CFD instruments, and many markets)
- Single-indicator approaches that generate excessive false signals and noise
- Static parameters that fail to adapt to changing volatility conditions
- Lack of confluence validation across multiple analytical dimensions
PRE Scalp addresses these limitations through a six-engine confluence architecture. Signals generate only when multiple independent analytical engines align, filtering noise while identifying potential reversal conditions across any timeframe.
━━━━━━━━━━━━━━━━━━━━━━━━━━━━━━━━━━━━━━━━━━━
DEVELOPMENT APPROACH - MULTI-ENGINE ARCHITECTURE - NOT A MASHUP
The Pressure Reversal Engine was developed to address specific limitations observed in traditional reversal detection and scalping indicator methods:
Challenge 1: Volume Dependency
Most reversal indicators require volume data, which is unreliable or unavailable for Forex, CFDs, indices, and many international instruments. The SAI engine was specifically designed to derive activity measurements purely from price action and candle structure.
Challenge 2: Single-Dimension Analysis
Individual indicators measuring only one aspect of price action generate excessive false signals. The multi-engine confluence approach requires confirmation across six independent analytical dimensions before generating buy or sell signals.
Challenge 3: Static Parameters
Fixed lookback periods fail during changing volatility conditions. The AVR engine dynamically adapts all parameters based on current market state, improving signal quality across different market environments.
Challenge 4: Subjective Pattern Recognition
Visual pattern identification is subjective and inconsistent. The DNA engine provides objective mathematical pattern matching with quantifiable scores for reversal candle detection.
Each engine addresses a specific analytical dimension. The confluence requirement emerged from observation that aligned signals across multiple engines produced significantly higher quality reversal identification than any single method.
━━━━━━━━━━━━━━━━━━━━━━━━━━━━━━━━━━━━━━━━━━━
THE SIX ANALYTICAL ENGINES EXPLAINED
Each engine provides a unique analytical perspective. Buy and sell signals generate only when multiple engines confirm confluence:
ENGINE 1: SYNTHETIC ACTIVITY INDEX (SAI) - Volumeless Activity Detection
Purpose: Derives market activity from price structure without requiring volume data. Essential for Forex trading, CFD analysis, and any instrument lacking reliable volume.
Calculation: Weighted composite of range expansion, body momentum, directional pressure, wick rejection, price acceleration, and volatility burst measurements.
Formula: SAI = (RangeExpansion x 0.25) + (BodyMomentum x 0.20) + (DirectionalPressure x 0.15) + (WickRejection x 0.15) + (PriceAcceleration x 0.15) + (VolatilityBurst x 0.10)
Signal Contribution: Validates that meaningful market activity is occurring at the potential reversal point. Without activity confirmation, apparent reversals may lack follow-through.
ENGINE 2: PRESSURE WAVE OSCILLATOR (PWO) - Exhaustion Detection
Purpose: Measures the balance between buying pressure and selling pressure through price geometry analysis.
Calculation: Net pressure (buying minus selling) weighted by activity level, normalized by standard deviation over extended period.
Formula: PWO = SMA(NetPressure x SAI, length) / StdDev(cumulative, length x 2)
Signal Contribution: Identifies pressure exhaustion conditions using percentile ranking to detect when buyers or sellers are running out of momentum. Exhaustion often precedes trend reversal.
ENGINE 3: FRACTAL CONFLUENCE MATRIX (FCM) - Multi-Timeframe Structure Analysis
Purpose: Analyzes price position across multiple structural timeframes simultaneously for multi-timeframe confluence.
Calculation: Evaluates price position within range at five Fibonacci-based periods (5, 8, 13, 21, 34 bars). These periods capture nested market structures from micro to macro.
Formula: FractalPosition = (Close - LowestLow) / (HighestHigh - LowestLow) at each period
Signal Contribution: Confirms that multiple structural levels align at extremes, indicating potential reversal zones where larger and smaller timeframes agree on price position.
ENGINE 4: ENTROPIC EXHAUSTION DETECTOR (EED) - Information Theory Analysis
Purpose: Applies Shannon entropy from information theory to measure market disorder and directional exhaustion.
Calculation: Shannon entropy of bullish/bearish bar distribution over the lookback period.
Formula: H = -Sum(p(x) x log2(p(x))) where p(x) is probability of bullish or bearish bars
Range: 0 (complete order, all bars same direction) to 1 (maximum disorder, 50/50 distribution)
Signal Contribution: High entropy combined with a directional streak breaking suggests the market has reached maximum uncertainty and may resolve in a new direction.
ENGINE 5: CANDLE DNA FINGERPRINTING - Pattern Recognition System
Purpose: Mathematical pattern recognition comparing current candle structure against ideal reversal patterns including hammer, shooting star, and engulfing formations.
Calculation: Weighted similarity scoring across body ratio, upper wick ratio, lower wick ratio, close position, and range versus ATR.
Formula: Score = Sum((1 - |actual - ideal|) x weight) for each metric
Signal Contribution: Identifies candles with reversal characteristics through objective mathematical measurement rather than subjective visual pattern recognition.
ENGINE 6: ADAPTIVE VOLATILITY REGIME (AVR) - Dynamic Parameter Adjustment
Purpose: Dynamically adjusts all lookback parameters based on current volatility conditions for adaptive indicator behavior.
Calculation: Ratio of fast ATR to slow ATR determines volatility regime classification.
Formula: VolatilityRatio = ATR(fast period) / ATR(slow period)
States: High volatility (ratio > 1.3) uses shorter lookbacks for faster adaptation. Low volatility (ratio < 0.7) uses longer lookbacks for noise reduction. Normal volatility maintains base parameters.
Signal Contribution: Ensures the entire system adapts appropriately to current market conditions rather than using static parameters that may fail in different environments.
━━━━━━━━━━━━━━━━━━━━━━━━━━━━━━━━━━━━━━━━━━━
WHY ENGINE SYNERGY MATTERS FOR SIGNAL QUALITY
The effectiveness of PRE comes from requiring multiple engines to align before generating buy or sell signals:
- SAI confirms activity is present (something meaningful is happening in price action)
- PWO confirms pressure exhaustion (the current move is running out of steam)
- FCM confirms structural alignment (multiple timeframes agree on position)
- EED confirms disorder state (market uncertainty is elevated near potential turning point)
- DNA confirms candle structure (the bar exhibits reversal pattern characteristics)
- AVR ensures parameters are appropriate (system is calibrated to current volatility)
A single indicator measuring one dimension generates many false signals. By requiring confluence across six independent analytical dimensions, this reversal indicator filters noise while identifying potential trading opportunities.
━━━━━━━━━━━━━━━━━━━━━━━━━━━━━━━━━━━━━━━━━━━
SIGNAL GENERATION PROCESS FOR BUY AND SELL SIGNALS
Step 1: ANCHOR DETECTION
The system identifies potential reversal anchors when price breaks beyond recent structure using a mean-reversion approach. A bullish anchor forms when price breaks below prior lows, suggesting potential oversold conditions. A bearish anchor forms when price breaks above prior highs, suggesting potential overbought conditions.
Step 2: ENGINE SCORING
Each enabled engine contributes to a cumulative quality score. The anchor must achieve minimum scoring thresholds to activate a setup.
Step 3: CONFIRMATION TRIGGER
Price must confirm the setup by crossing back through the anchor zone within the confirmation window. This crossover or crossunder is validated at bar close to prevent repainting.
Step 4: SIGNAL QUALITY SCORE
The final buy or sell signal displays a quality score representing the total engine confluence. Higher scores indicate stronger alignment across more analytical engines.
━━━━━━━━━━━━━━━━━━━━━━━━━━━━━━━━━━━━━━━━━━━
READING THE BUY SELL SIGNAL LABELS
BUY Signal Label:
- Displays "BUY" with quality score in brackets
- Shows engine contribution breakdown when enabled in settings
- indicates engine contributed to signal
- indicates engine did not contribute
- Higher total scores suggest stronger multi-engine confluence
SELL Signal Label:
- Displays "SELL" with quality score in brackets
- Same engine breakdown format as BUY signals
- Identical scoring interpretation
Score Interpretation Guide:
- Score 3-4: Minimum threshold met, basic confluence achieved
- Score 5-6: Good confluence across multiple engines
- S core 7-8: Strong confluence with most engines aligned
━━━━━━━━━━━━━━━━━━━━━━━━━━━━━━━━━━━━━━━━━━━
ENGINE STATUS DASHBOARD - REAL-TIME ANALYSIS DISPLAY
The Engine Status Panel displays real-time readings from all six analytical engines:
Synthetic Activity Row:
- HIGH ACTIVITY: SAI above threshold, significant price action detected (value shown)
- ACTIVE: SAI above confirmation level, moderate activity present
- LOW: SAI below activity thresholds, quiet market conditions
- DISABLED: Engine turned off in settings
Pressure Wave Row:
- BULL EXHAUSTION: PWO in lower percentile tail and reversing upward, potential bottom
- BEAR EXHAUSTION: PWO in upper percentile tail and reversing downward, potential top
- NEUTRAL: PWO in normal range, no exhaustion detected
Fractal Matrix Row:
- BULL CONFLUENCE: Multiple fractal levels show price near structural lows (score shown)
- BEAR CONFLUENCE: Multiple fractal levels show price near structural highs
- NO CONFLUENCE: Insufficient alignment across fractal timeframe levels
Entropic Exhaustion Row:
- HIGH ENTROPY: Shannon entropy above threshold, maximum market disorder detected
- ORDERED: Entropy below threshold, clear directional consistency present
Candle DNA Row:
- BULL PATTERN: Current candle matches bullish reversal profile (hammer-like structure)
- BEAR PATTERN: Current candle matches bearish reversal profile (shooting star-like)
- NO MATCH: Current candle does not match reversal pattern characteristics
Market Regime Row:
Shows DETECTED market conditions based on price action analysis:
- FRESH MOVE: New directional move beginning, momentum increasing
- NORMAL: Standard market conditions, no extreme factors detected
- SCALP CONDITIONS: Extended move or decreasing momentum detected
- CAUTION ZONE: Multiple warning factors present requiring conservative approach
Note : This displays what market conditions look like, not necessarily what targets will be applied.
Applied Style Row:
Shows what target style is ACTUALLY being applied to trades and why:
When Trade Style Setting = Auto:
- RUNNER (Auto): System detected FRESH conditions, applying wide targets (0.8R, 1.8R, 3.0R)
- EXTENDED (Auto): System detected NORMAL conditions, applying balanced targets (0.6R, 1.2R, 2.0R)
- SCALP (Auto): System detected SCALP conditions, applying tight targets (0.4R, 0.8R, 1.2R)
- CAUTION (Auto): System detected CAUTION conditions, applying very tight targets (0.3R, 0.5R, 0.8R)
When Trade Style Setting = User Override:
- SCALP (User): You selected Scalp style manually
- EXTENDED (User): You selected Extended style manually
- RUNNER (User): You selected Runner style manually
This dual-row display ensures complete transparency. You always see both what market conditions exist AND what targets you are receiving.
Volatility State Row:
- HIGH VOLATILITY: Fast ATR significantly exceeds slow ATR, adaptive parameters shortened
- NORMAL: Volatility ratio within standard range
- LOW VOLATILITY: Fast ATR significantly below slow ATR, adaptive parameters extended
━━━━━━━━━━━━━━━━━━━━━━━━━━━━━━━━━━━━━━━━━━━
REGIME VS APPLIED STYLE - COMPLETE TRANSPARENCY
The Engine Status Panel displays TWO separate rows for complete trading transparency:
1. Market Regime: What current market conditions look like based on analysis
2. Applied Style: What target calculations are actually being used for trades
Why Two Separate Rows?
When Trade Style is set to "Auto", the Applied Style will match the detected Regime automatically. For example:
- Regime: FRESH MOVE leads to Applied Style: RUNNER (Auto)
- Regime : NORMAL leads to Applied Style: EXTENDED (Auto)
When you manually select a Trade Style (Scalp, Extended, or Runner), the Applied Style will show your selection regardless of the detected Regime:
- Regime: FRESH MOVE but Applied Style: SCALP (User)
(Market conditions look fresh, but you chose tight targets)
This transparency ensures you always know:
- What conditions is the market is currently showing
- What targets you will you actually receive on signals
- Whether the system chose automatically or you overrode the selection
━━━━━━━━━━━━━━━━━━━━━━━━━━━━━━━━━━━━━━━━━━━
TRADE PANEL - POSITION MANAGEMENT DISPLAY
During Active Trade:
- Position type (LONG/SHORT) with entry price level
- Running P&L displayed in points (current price versus entry)
- TP1, TP2, TP3 target levels with booking percentages for each
- Current stop loss level (initial, protected, or trailing depending on trade progress)
- Risk to Reward ratio (displayed before TP1 is reached)
- Profit booked percentage showing locked gains
- Trade status and total bars in trade count
When Scanning for Signals:
- Shows "SCANNING FOR SIGNALS" status message
- Displays any active setup waiting for a confirmation trigger
- Shows next signal TP multipliers based on the current detected regime
- Indicates remaining bars in confirmation window before setup expires
━━━━━━━━━━━━━━━━━━━━━━━━━━━━━━━━━━━━━━━━━━━
TRADE MANAGEMENT AND RISK CONTROL FEATURES
Take Profit System:
- Supports 2 or 3 TP target levels for flexible exit strategy
- Three calculation modes available: Auto (regime-based), Manual ATR, Fixed R:R
- Configurable booking percentages at each level for position scaling
- Visual lines and labels display all target levels on chart
Stop Loss System:
- Two calculation modes : Auto (anchor-based) or Manual ATR distance
- Configurable buffer beyond calculated stop level for additional protection
- Optional maximum stop loss cap in points to limit risk exposure
- Visual display shows current stop level throughout trade
Breakeven Protection:
- None: Stop remains at original level after TP1 is reached
- Buffer: Stop moves to entry plus percentage of original risk
- Lock at TP1: Stop moves to TP1 level, securing that profit amount
Trailing Stop Options:
- ATR Trailing: Follows at dynamic ATR distance from price extreme
- Step Trailing: Moves in fixed point increments as price advances favorably
- Swing Trailing: Follows recent swing structure levels for dynamic protection
- Configurable start point: Begin trailing from entry or only after TP1 achieved
━━━━━━━━━━━━━━━━━━━━━━━━━━━━━━━━━━━━━━━━━━━
KEY SETTINGS GUIDE FOR CONFIGURATION
Core Engine Settings:
- Base Lookback Period: Foundation for anchor detection, automatically adjusted by AVR engine
- Confirmation Window: Number of bars allowed for price to confirm setup after anchor
- Minimum Signal Quality Score : Required confluence level for valid buy sell signals
- Signal Cooldown: Minimum bars between consecutive signals to prevent clustering
Engine Toggles:
Each of the six analytical engines can be independently enabled or disabled. Disabling engines reduces confluence requirements but may affect overall signal quality.
Trade Style Options:
- Auto: Automatically selects style based on detected market regime
(FRESH leads to Runner, NORMAL leads to Extended, SCALP leads to Scalp, CAUTION leads to Caution)
- Scalp: Forces tight targets for quick profit taking (TP1: 0.4R, TP2: 0.8R, TP3: 1.2R)
- Extended: Forces balanced targets with room to develop (TP1: 0.6R, TP2: 1.2R, TP3: 2.0R)
- Runner: Forces wide targets to capture larger moves (TP1: 0.8R, TP2: 1.8R, TP3: 3.0R)
Aggressiveness Level:
- Conservative: Tighter targets with earlier profit taking
- Normal: Balanced approach as calculated
- Aggressive: Extended targets for larger potential moves
Session Filter:
Optional restriction of signals to specific trading sessions including London, New York, Tokyo, Sydney, London plus New York overlap, or custom hours in UTC.
━━━━━━━━━━━━━━━━━━━━━━━━━━━━━━━━━━━━━━━━━━━
VISUAL ELEMENTS AND DISPLAY OPTIONS
Chart Display Elements:
- BUY and SELL labels with quality scores and optional engine breakdown
- Entry line displayed as dashed yellow
- TP levels displayed as dotted green gradient
- Stop loss line displayed as solid red
- Protected and trailing stop line displayed as solid blue
- Hit markers appear when TP or SL levels are reached
- Optional regime label showing current market state classification
Color Theme Options:
- Vibrant: High contrast modern colors (default selection)
- Classic : Traditional trading platform colors
- Dark Pro: Subdued professional color scheme
- Minimal : Low saturation subtle colors for clean charts
Dashboard Display Modes:
- Full : Complete detailed information display
- Compact : Essential information only for smaller footprint
- Ultra Compact : Minimal footprint display for maximum chart space
━━━━━━━━━━━━━━━━━━━━━━━━━━━━━━━━━━━━━━━━━━━
ALERT SYSTEM FOR NOTIFICATIONS
Individual Alert Conditions Available:
- PRE Buy Signal: Triggers on new buy signal generation
- PRE Sell Signal: Triggers on new sell signal generation
- TP1 Achieved: Triggers when first target is reached
- TP2 Achieved: Triggers when second target is reached
- TP3 Achieved: Triggers when third target is reached
- Stop Loss Hit: Triggers when stop level is reached before any TP
- Protected Exit: Triggers when stop is hit after partial profit taken
- Momentum Warning: Triggers when momentum weakening is detected in profitable trade
Alert Format Options:
- Standard: Brief notification with symbol and signal score
- Detailed : Comprehensive information including all price levels
- Webhook JSON: Machine-readable format for automated trading systems and bots
━━━━━━━━━━━━━━━━━━━━━━━━━━━━━━━━━━━━━━━━━━━
CHART EXAMPLES - VISUAL DEMONSTRATIONS
Chart 1: Dashboard and Engine Status Overview
This chart demonstrates the PRE indicator in scanning mode, showing the comprehensive Engine Status Panel (top right) and Trade Panel (bottom right). The dashboard provides real-time visibility into all six analytical engines and current market conditions.
Key Features Shown:
- Synthetic Activity Index (SAI): Currently showing HIGH ACTIVITY (50.6) detecting significant price action
- Pressure Wave Oscillator (PWO): NEUTRAL (2.99) with no exhaustion detected yet
- F ractal Confluence Matrix (FCM): BEAR CONFLUENCE (5) showing price at multi-timeframe highs
- Entropic Exhaustion Detector (EED): HIGH ENTROPY (0.99) indicating maximum market uncertainty
- Candle DNA Fingerprinting: BULL PATTERN (0.74) with reversal pattern detected
- Market Regime: SCALP CONDITIONS suggesting tighter targets appropriate
- Applied Style: SCALP (Auto) with system automatically selecting scalp mode based on regime
- Volatility State: NORMAL (0.76)
- Trade Panel: Shows SCANNING FOR SIGNALS with a BEARISH setup active (3 bars remaining)
What This Demonstrates:
The dashboard provides complete transparency into the indicator decision-making process. You can see exactly which engines are active, their current readings, and what trade style will be applied to the next signal. The Applied Style row shows both the detected regime AND the style that will be used.
Chart 2: Trade Style Comparison - Extended vs Runner
This split-screen comparison shows the SAME SELL signal and trade with two different trade style settings applied. The left panel uses EXTENDED (User) style while the right panel uses RUNNER (User) style. This demonstrates how manually selecting different trade styles affects take profit targets and position booking strategy for identical market conditions.
Key Features Shown:
LEFT PANEL - EXTENDED (User) Style:
- Engine Status: Market Regime shows FRESH MOVE but Applied Style shows EXTENDED (User)
- Entry: 4492.5
- TP1: 4487.75 at 4.6 pts away
- TP2: 4483.01 at 9.4 pts away
- Stop Loss: 4500.4 (8 pts)
- Risk to Reward: 1:0.6
- Running P&L: -0.13 points
- Position Booking: Balanced 50/50 split
RIGHT PANEL - RUNNER (User) Style:
- Engine Status: Same FRESH MOVE regime but Applied Style shows RUNNER (User)
- Entry: 4492.5 (same entry)
- TP1: 4486.17 at 6.2 pts away (WIDER target)
- TP2: 4478.26 at 14.1 pts away (MUCH WIDER target)
- Stop Loss: 4500.4 (8 pts - same stop)
- Risk to Reward: 1:0.8 (better ratio)
- Running P&L: -0.13 points (same moment)
- Position Booking: Aggressive 35/65 split keeping more for runner
What This Demonstrates:
Both panels show the exact same trade at the same moment with same P&L, entry, and stop. The ONLY difference is the trade style setting. EXTENDED uses balanced approach with 50/50 booking at closer targets. RUNNER uses wider targets with 35/65 booking to let winners run further.
Chart 3: Auto Mode vs Manual Override Comparison
This split-screen comparison shows the SAME SELL signal with two different style control modes. The left panel uses RUNNER (Auto) where the system automatically selected Runner style based on detecting FRESH MOVE conditions. The right panel uses SCALP (User) where the trader manually forced Scalp style, overriding the system recommendation.
Key Features Shown:
LEFT PANEL - RUNNER (Auto) Style:
- Engine Status: Market Regime shows FRESH MOVE and Applied Style shows RUNNER (Auto)
- Entry: 4492.5
- TP1: 4489.33 at 3 pts away
- TP2: 4487.17 at 6.2 pts away
- Stop Loss : 4500.4 (8 pts)
- Control Mode: System automatically selected this style
RIGHT PANEL - SCALP (User) Style:
- Engine Status: Same FRESH MOVE regime but Applied Style shows SCALP (User)
- Entry: 4492.5 (same)
- TP1: 4489.33 at 3 pts away (TIGHTER booking percentage)
- TP2: 4487.17 at 6.2 pts away (SMALLER remainder)
- Risk to Reward: 1:0.4 (more conservative)
- Control Mode: User manually forced this style overriding system
What This Demonstrates:
The Applied Style row shows WHO is in control. (Auto) means system decides based on regime. (User) means you override. This complete transparency shows when you are trading WITH or AGAINST the system analysis.
Chart 4: Trade Management and Protection System
This split-screen comparison shows the SAME SHORT trade at DIFFERENT stages of execution. The left panel shows the trade at entry and setup phase while the right panel shows the trade after TP1 has been hit with protection activated.
Key Features Shown:
LEFT PANEL - Trade Setup and Initial Entry:
- Engine Status: Market Regime shows FRESH MOVE and Applied Style shows RUNNER (Auto)
- Trade Panel: Shows SCANNING FOR SIGNALS with BULLISH setup active (3 bars remaining)
- TP Mode: Auto with Next Signal TP showing 0.8R / 1.8R (Runner style targets)
- Exit Marker: Shows Exit @ +50% label indicating completed previous trade
- Setup Phase: System ready for next signal with runner-focused targets pre-calculated
RIGHT PANEL - Active Trade with TP1 Hit:
- Engine Status: Same FRESH MOVE regime but Applied Style shows SCALP (User)
- Entry: 4492.5 (yellow dashed line)
- TP1: 4486.17 showing + HIT (green marker indicating TP1 reached)
- TP2: 4486.17 at 11.4 pts away (green dotted line)
- Protected Stop: 4491.31 (3.8 pts) shown as BLUE LINE (stop moved from initial level)
- Running P&L: +4.96 points (in profit)
- Profit Booked: 65% shown in trade panel
- Trade Status: RUNNING TO TP2
- Bars in Trade: 10
- Protection Active: Stop loss moved to protect profits after TP1 achievement
What This Demonstrates:
Complete trade lifecycle and protection system. Initial stop placement, TP1 achievement, breakeven protection activation, position booking, and remaining position management with zero risk after partial profit taken.
━━━━━━━━━━━━━━━━━━━━━━━━━━━━━━━━━━━━━━━━━━━
RECOMMENDED USE CASES AND APPLICATIONS
Suitable Instruments:
- Forex pairs including all majors, minors, and exotics (no volume required)
- CFD instruments including indices, commodities, and metals
- Cryptocurrency pairs on all exchanges
- Stocks and ETFs with or without volume consideration
- Futures contracts across all markets
Suggested Timeframes:
- Primary for scalping: 1-minute, 3-minute, 5-minute, 15-minute charts
- Also effective on: 30-minute, 1-hour, 4-hour for swing entry identification
Optimal Conditions:
- Markets with clear structure and adequate liquidity
- During active trading sessions with participation
- When multiple engines show alignment and confluence
━━━━━━━━━━━━━━━━━━━━━━━━━━━━━━━━━━━━━━━━━━━
LIMITATIONS AND IMPORTANT CONSIDERATIONS
What This Indicator Cannot Do:
- Predict future price movements with certainty
- Guarantee profitable trades or specific returns
- Replace proper risk management and position sizing
- Work effectively in all market conditions at all times
- Eliminate all false signals completely
Conditions Where Performance May Vary:
- Extremely low liquidity periods with wide spreads
- Major news events and high-impact economic releases
- Strongly trending markets without meaningful pullbacks
- Unusual market conditions or flash crash events
The P&L tracking displayed is for the current visualized trade only and does not represent historical performance, backtested results, or guaranteed future outcomes.
━━━━━━━━━━━━━━━━━━━━━━━━━━━━━━━━━━━━━━━━━━━
SIGNAL CONFIRMATION AND NON-REPAINTING BEHAVIOR
This indicator is specifically designed to prevent repainting:
- All signals are confirmed at bar close only using barstate.isconfirmed
- Signals do not appear and disappear during intra-bar price action
- Once a signal prints on the chart, it remains permanently
- Historical signals accurately represent what would have been visible in real-time trading
━━━━━━━━━━━━━━━━━━━━━━━━━━━━━━━━━━━━━━━━━━━
RISK DISCLAIMER AND IMPORTANT NOTICES
This indicator is provided for educational and informational purposes only. It does not constitute financial advice, investment recommendations, or trading signals that guarantee profits.
Trading financial instruments carries substantial risk of loss and is not suitable for all investors. Past performance of any trading system or methodology is not necessarily indicative of future results.
Users should:
- Conduct their own analysis before making any trading decisions
- Never risk more than they can afford to lose
- Understand that no indicator can predict market movements with certainty
- Use proper risk management and position sizing at all times
- Consider consulting a licensed financial advisor before trading
The author accepts no liability for any losses incurred through the use of this indicator.
-BullByte

JAM ALGO Scalping IntradayTrend & Momentum Indicator
SuperTREX is a trend-following trading indicator designed to identify BUY and SELL opportunities by combining RSI momentum, ATR-based SuperTrend logic, and an optional EMA trend filter.
The indicator focuses on clarity and stability, providing clean signals, visual trade zones, and a simple performance overview directly on the chart.
Key Features
Trend Detection
SuperTrend-style logic based on ATR volatility
Visual trend line with optional background coloring
Momentum Confirmation
RSI crossovers to detect momentum shifts
Helps filter low-quality or late entries
Optional EMA Filter
Trade in the direction of the broader trend
Can be enabled or disabled by the user
Flexible Trade Modes
LONG only
SHORT only
BOTH (default)
Visual Trade Management
Automatic Take Profit and Stop Loss zones
ATR-based or Percentage-based
TP / SL boxes projected forward from each entry
JAM ALGO Scalping Intraday - Fully customizable colors, opacity, and borders
Statistics Dashboard
Total number of trades
Wins and losses
Win rate
Average R per trade
The dashboard updates in real time and is fully customizable.
Alerts
BUY alerts
SELL alerts
Alerts are triggered only when conditions are met and do not repaint.
Reliability
No repainting
No security() calls
No lookahead bias
Pine Script v6 compatible
Designed for intraday and swing trading
Disclaimer
This indicator is a technical analysis tool, not financial advice.
Always apply proper risk management and confirm signals with market context.

JAM ALGO Signals
"Remove the filters to view signals, then customize the parameters to your preference and enjoy using the indicator!" ✅
JAM ALGO Signals
Description:
🚀 Advanced Trading Signals with Risk Management & Alerts
This indicator is a complete all-in-one tool for traders seeking precise entries and exits with built-in risk management and real-time statistics. It combines RSI and EMA-based analysis, projected Take Profit (TP) and Stop Loss (SL) levels, customizable filters, and premium alerts directly on your TradingView chart.
✨ Key Features:
Entry Signals 🔹
Buy & Sell signals based on price action and RSI conditions.
Trend confirmation via EMA (200 and optional 50-period filters).
Visual signals: Labels, Arrows, Triangles, or Text.
Risk Management (RR) ⚖️
Define Stop Loss (SL) and multiple Take Profit levels (TP1, TP2, TP3) based on risk ratio (R).
Configurable projection bars to visualize target levels.
Colored zones for TP & SL, with optional borders for clarity.
Premium Alerts 🔔
Alerts for BUY / SELL signals, TP1 / TP2 / TP3, and SL hits.
Instant notifications when levels are reached.
Advanced Filters 🛡️
EMA50 Trend Filter: confirms short-term trend.
RSI Direction Filter: ensures momentum alignment.
Volatility Filter (ATR14 > Range): ensures enough market movement.
Candle Size Filter: avoids entries on too small candles.
SL Overlap Filter: prevents trades overlapping existing SL levels.
Real-Time Statistics 📊
Total trades, wins (TP1), and losses (SL).
Winrate (%), cumulative profit, and average RR ratio.
Optimizes strategy tracking directly on the chart.
Customizable Visuals 🎨
TP & SL line colors and styles (solid, dashed, dotted).
Fully adjustable signal labels (color, size, type).
Configurable stats table with background & text colors.
🔥 Advantages:
Complete tool for day trading and swing trading.
Clear visualization of critical risk/reward levels.
Automatic alerts for fast reaction without constant monitoring.
Integrated statistics for performance evaluation and strategy improvement.
Recommended for:
Traders using price action, intraday strategies, scalping, or swing trading, who want advanced risk management with visual signals and performance analytics on TradingView.

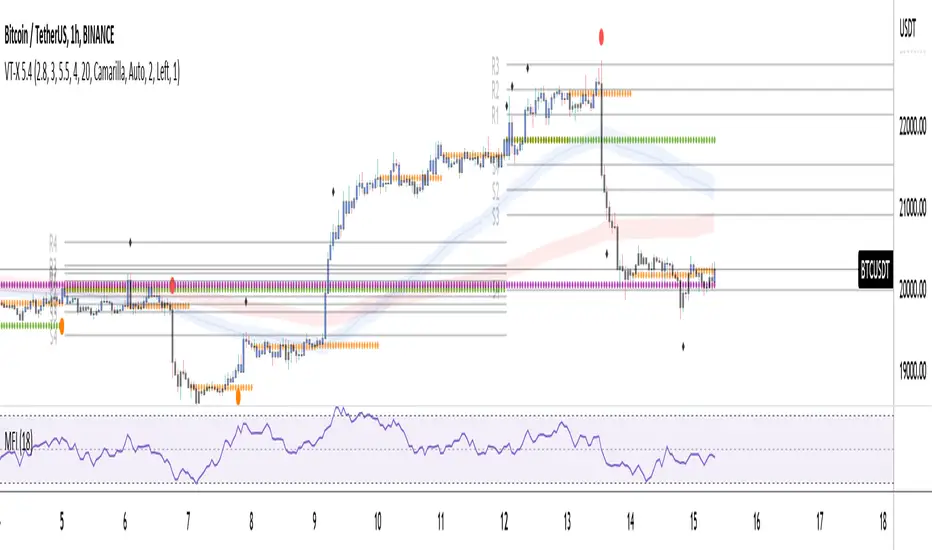
Smart RSI Money Flow - Core Bands V1.01SMART RSI – Money Flow Bands (Technical Overview)
1. Background: RSI and Its Behavior on Lower Timeframes
The Relative Strength Index (RSI) originally is a momentum oscillator calculated from average gains and losses over a selected period. In its standard form, RSI is derived solely from price changes; it does not incorporate volume data or order-flow information in its formula.
Because RSI is price-based, its interpretation depends strongly on the timeframe:
• On higher timeframes, each bar aggregates more trading activity, and RSI tends to behave more smoothly.
• On lower timeframes (1-hour down to intraday scalping intervals), price fluctuations are quicker, and RSI becomes more sensitive to short-term noise.
This does not imply that RSI becomes invalid, but that its signals on fast charts can be more reactive and may benefit from additional context such as volume behavior or structural information.
2. Purpose of This Indicator
This indicator extends the classical RSI by adding information that RSI does not include:
• Mapping RSI values into price-based bands instead of the 0–100 oscillator space.
• Retrieving lower timeframe volume data and separating it into buy and sell components.
• Comparing the slope (angle) of price movement with the slope of buy and sell volume.
The goal is to provide a structural interpretation of where price sits relative to RSI conditions and how volume is behaving on a lower timeframe.
3. Technical Differences Compared to Classical RSI
A) Classical RSI
• Input: price only (usually close).
• Output: normalized oscillator between 0 and 100.
• Does not incorporate intra-bar volume distribution.
• Does not separate buy/sell volume.
B) SMART RSI – Money Flow Bands
1) RSI-to-Price Mapping
Converts RSI values into upper/lower price bands using recent price extremes.
2) Lower Timeframe Volume Decomposition
Retrieves LTF data and splits each bar’s volume into buy (close>open) and sell (close

AnchorPulse RWAP Universal ScalperWhat it is
AnchorPulse Scalper is an intraday indicator that reads price in real time through three ideas working together.
A live pivot engine that detects the current micro leg.
An Anchored Range Weighted Average Price that starts at each new leg or session.
An adaptive rhythm score that communicates a simple bias: Buy, Sell, or Wait.
The goal is clarity. You get one anchor line, soft bands that show stretch, discrete Buy and Sell marks, and a plain-language dashboard that says Trend, Phase, Bias, Momentum, Volatility, Stretch, ETA to next turn, and Regime. No external dependencies and no lookahead. It is designed for standard chart types on one to five minute timeframes across liquid symbols such as major FX, index futures, large cap stocks, and mainstream crypto pairs.
What makes it original
Most scalpers either track a fixed moving average or draw from a session VWAP. AnchorPulse does neither. The anchor resets at every new micro leg detected by a real time pivot engine that measures distance in units of ATR rather than in fixed points. This produces a responsive anchor that updates only when the market proves a leg has turned. On top of that, the rhythm timer keeps an average of how long legs usually last, so the indicator can treat the start and the end of a leg differently. Early in a leg it favors continuation signals. Late in a leg it watches for mean reversion. This mix of an ATR-based leg detector, a leg-anchored RWAP, and a rhythm aware bias is the core originality.
Plain explanation of the calculations
Pivot engine. While price travels up, the script tracks the highest high reached since the last pivot. If price pulls back from that extreme by at least a user defined fraction of ATR, the leg flips down. The reverse applies to down legs. The distance threshold is adaptive because ATR changes with volatility. A short cooldown in bars can prevent double flips on violent bars.
Anchored Range Weighted Average Price. From the first bar of each new leg the script accumulates a weighted average of the typical price, where the weight is the true range of each bar. The anchor can also reset at the start of a session and can ignore the very first session bar to avoid overweighting the open gap.
Progress and phase. The script measures how far price traveled from the last pivot relative to the reversal threshold. That is progress. At the same time it maintains an exponential average of leg duration in bars. The current leg age divided by that average is the age ratio. An age ratio below an adaptive early threshold means Early. Above an adaptive late threshold means Late. The thresholds drift with recent variability in leg length so they match the rhythm of the market.
Wick pressure and intrabar skew. Lower wick minus upper wick, normalized by ATR and smoothed, acts as tape pressure. The sign of close minus open, smoothed, is intrabar skew. They are combined into a compact momentum read.
Bands and stretch. The script computes the deviation of typical price from the anchor and builds soft bands around the anchor. Standard deviation is capped by a multiple of mean absolute error to avoid inflated bands just after a pivot.
Regime filter. You may optionally gate continuation entries when the higher timeframe EMA disagrees, or gate reversals when ADX shows strong trend.
Adaptive edge score. Progress and momentum are turned into percentile scores using a normal CDF of their rolling z scores. This yields a familiar zero to one hundred scale that is easier to read than raw values. Early in an up leg adds a small bonus to long bias. Early in a down leg adds a small bonus to short bias.
Gap cap. Signals are rejected if price is too far from the anchor. The cap is expressed as a fraction of price, which scales across symbols.
What you see on the chart
One white anchor line. Two transparent bands. Subtle green or orange background when a bias is active. Buy marks below bars and Sell marks above bars. Small triangles at pivots. Bar tint softly aligned with momentum. A compact table in the corner that tells you the state in plain language. On alert, a single JSON line can be sent to your alert channel with ticker, timeframe, trend, phase, bias, edge score, stretch, ETA in bars, and regime note.
How to use it in practice
Choose a liquid symbol and a one to five minute timeframe.
Keep the mode on Hybrid until you learn the personality of the market. If you notice long directional pushes, try Continuation mode. If you see frequent fades near the end of legs, try Reversal mode.
Read the table. Trend shows Up or Down according to the current leg. Phase shows Early, Mid, or Late from the rhythm timer. Bias shows Buy, Sell, or Wait once the signal rules and the gap cap are satisfied. Momentum reads Strong Up, Neutral, or Strong Down from wick pressure and skew. Volatility shows Calm, Average, or Wild relative to an ATR baseline. Stretch vs anchor prints the distance between close and the anchor as a percent of price. ETA shows how many bars remain to the average leg length if such a read is meaningful. Regime reflects the optional gate: None, HTF Up, HTF Down, Strong, or Soft.
Focus on the anchor. Continuation longs are stronger when price holds above the anchor in the first part of an up leg with positive momentum and adequate progress. Continuation shorts are the mirror case below the anchor. Reversal longs are stronger when a down leg is late, price crosses the anchor, and momentum flips positive. Reversal shorts are the mirror case in late up legs.
Respect the gap cap. When price is stretched far away from the anchor, skip signals and wait for re-alignment or a fresh leg.
Keep the chart clean. The script is designed to work on its own. If you add other tools, make sure they do not paint multiple backgrounds or heavy drawings that obscure the anchor and the bands.
Inputs explained with practical defaults
The script ships with sensible defaults and all inputs provide tooltips inside the indicator. The description here is included so traders who do not read code can still understand how to tune it.
Signal mode. Continuation uses early leg logic. Reversal uses late leg logic at anchor crosses. Hybrid allows both and lets the edge score decide.
ATR length and Pivot reversal in ATR. These govern flips. Shorter ATR and smaller reversal multiples yield faster turns and more signals. Longer and larger do the opposite. A middle ground such as ATR 50 with reversal 0.75 often reads well across liquid markets.
Rhythm smoothing length and Freeze bars after flip. The first sets how quickly the average leg length adapts. The second prevents double flips on wide bars. Values around 20 and 1 to 3 bars work well for most symbols.
Session hours, Session reset, and Skip first session bar. These are optional. Day sessions in equities can benefit from a reset and from skipping the first bar so the anchor is not dragged by the open gap. Round the session to your venue.
Wick pressure length and Intrabar skew length. They control how quickly the micro momentum reacts. Values between 6 and 12 for wick pressure and 4 to 10 for skew are common.
Early and Late thresholds and the Adaptive option. If you turn adaptation on, the thresholds drift with leg variability. The adaptiveness setting controls the strength of that drift.
Minimum progress and Maximum stretch vs anchor. The first ensures that continuation signals only occur once the leg moved a minimum distance from the last pivot. The second prevents chasing far from the anchor. As a rule, raise minimum progress when the market chops and reduce it on trend days. Keep stretch around one to two percent for many symbols, then adjust by product.
Regime filter. Higher timeframe EMA supports trend alignment. ADX supports a simple read on the strength of trend. Use one at a time or none, depending on your preference.
Adaptive scoring lookback. The percentile logic needs a modest window. Values near one hundred twenty bars tend to give stable ranks without lagging too much.
Band settings. Band length and width control the look of the soft channel around the anchor. The cap versus mean absolute error is there to keep the bands realistic just after flips.
Visual controls. Pick labels, triangles, or circles, and choose to mark only state changes if you prefer a very clean chart.
Why the dashboard uses plain language
Many traders prefer to reason in simple terms rather than in raw values. The table abstracts the math into natural categories such as Early versus Late, Calm versus Wild, or Strong Up versus Strong Down. The only numeric reads are Stretch and Edge score because these help in threshold decisions. Stretch is a percent of price so it scales across markets. Edge is a normalized score from zero to one hundred that reflects the combined progress, momentum, and phase. The table is intended to be the only element you need to glance at during a fast session once you learn the anchor and the band cues.
Design choices and integrity
No repaint. The script uses bar closes and standard Pine semantics with lookahead off in security calls. There are no offset tricks that move plotted values after the fact.
One background painter. Background tint is created by a single call to avoid vertical stripes.
Reset logic is explicit. The anchor resets at a pivot or at session start if that option is enabled. This is written to be transparent so you know why the anchor restarted.
Conservative defaults. Out of the box, the script is not tuned to over trade. It communicates bias rather than forcing entries.
Clean chart guidance. The tool is meant to be used on standard bars or candles. It is not intended for synthetic chart types such as Heikin Ashi, Renko, Kagi, Point and Figure, or Range for the purpose of signal generation.
How to read a few common situations
Breakout with strong follow through. Trend reads Up. Phase reads Early. Momentum reads Strong Up. Stretch sits inside the band. Bias shows Buy. This is the typical continuation long.
Extended push into exhaustion. Trend reads Up. Phase reads Late. Momentum cools. Stretch prints a high positive percent of price. Bias flips to Wait, sometimes to Sell after an anchor cross. This is the potential reversal short.
Mean reverting chop. Trend flips often. Phase hangs around Mid. Momentum flips sign frequently. Stretch hovers near zero. Bias often prints Wait. In this case you let the market speak and only act when the leg matures or when stretch spikes away from the anchor.
Trend day with strength. ADX filter reads Strong. Continuation is allowed. Reversal attempts are blocked. Bias favors the dominant direction.
Session open. If you selected a session reset and chose to skip the first bar, the anchor starts at the second bar and the first prints do not dominate the anchor.
Limits and realistic expectations
This indicator measures leg structure and micro pressure to suggest a bias. It is not a self-contained trading system. It does not size positions, pick stops, or set take profits. It does not promise accuracy or profits. In violent markets the pivot detector can flip and then flip back. Cooldown reduces this effect but cannot remove it. During news and illiquid hours the anchor can move very quickly. Wide slippage and spread can make any intraday approach impractical. These are standard realities of intraday trading and they also apply here.
Suggested workflows
Discretionary scalper. Keep the chart clean. Use the table to decide whether to engage, then work entries at the anchor or inside the band. Focus on position risk and a predefined stop level independent of the script.
Session specialist. If you trade a venue with strong sessions such as US equities or major FX sessions, enable the session reset. Many traders find the tool shines in the first two hours and the last hour of an active session.
Multi timeframe monitor. Keep AnchorPulse on one to five minutes and a simple higher timeframe EMA on a separate chart. If you prefer a single chart, switch the regime filter to HTF Trend and let the indicator handle it.
Alert driven workflow. Create alerts on Buy or Sell. The payload contains the essential context so you can log and review. Use the payload fields to build a small notebook of cases you like to take.
Why it is published as protected
The script contains original logic that relies on a compact set of calculations not commonly seen together. Publishing as protected keeps the logic intact while still giving the community full access through the Public Library.
Frequently asked questions
Does it repaint
No. The pivot flips on confirmed bars using ATR distance. The anchor, bands, and dashboard read from that state and do not shift after the bar closes.
What settings should I change first
Try the reversal distance in ATR and the minimum progress. These two govern how active or selective the tool becomes. If you see too many flips, raise the ATR multiple or the freeze bars. If you want faster action, lower them slightly.
What is a reasonable stretch cap
One to two percent of price is a useful starting point for many symbols. Thin products may need a larger cap. Extremely liquid products can often work with a smaller cap.
Should I use the regime filter
On days with persistent trend, the higher timeframe EMA filter or the ADX filter can help keep you with the flow. On rotational days, consider turning the filter off to allow more two sided action.
Can I use it on higher timeframes
The logic works on any timeframe, but the design and defaults target one to five minutes. If you go higher, adjust the ATR length, reversal distance, and rank lookback accordingly.
Can I combine it with volume
Yes. A simple volume filter that marks above average volume near the anchor can help you time entries. Keep the chart readable.
Risk notice and user responsibility
This indicator is a tool for research and education. It does not give investment advice, trade recommendations, or any guarantee of outcomes. All trading carries risk including the loss of capital. Past performance is not a reliable guide to future results. You are solely responsible for your trading decisions, for verifying that the indicator behaves as you expect on your data and platform settings, and for selecting appropriate risk controls such as position sizing, stops, and loss limits.
Summary
AnchorPulse Scalper is a concise way to read the market’s current leg, its anchor, and its rhythm. The pivot engine tells you direction. The leg-anchored RWAP shows where value sits for this micro move. The adaptive score simplifies momentum and progress into a familiar scale. The dashboard translates complex calculations into the plain words that scalpers actually use. If you prefer simple signals, enable alerts and let them flow into your log. If you prefer context, watch the anchor and bands as the leg evolves and let the rhythm guide your timing. Use it respectfully on a clean chart, stay realistic, and keep your own rules for risk.

Weekend Hunter Ultimate v6.2 Weekend Hunter Ultimate v6.2 - Automated Crypto Weekend Trading System
OVERVIEW:
Specialized trading strategy designed for cryptocurrency weekend markets (Saturday-Sunday) when institutional traders are typically offline and market dynamics differ significantly from weekdays. Optimized for 15-minute timeframe execution with multi-timeframe confluence analysis.
KEY FEATURES:
- Weekend-Only Trading: Automatically activates during configurable weekend hours
- Dynamic Leverage: 5-20x leverage adjusted based on market safety and signal confidence
- Multi-Timeframe Analysis: Combines 4H trend, 1H momentum, and 15M execution
- 10 Pre-configured Crypto Pairs: BTC, ETH, LINK, XRP, DOGE, SOL, AVAX, PEPE, TON, POL
- Position & Risk Management: Max 4 concurrent positions, -30% account protection
- Smart Trailing Stops: Protects profits when approaching targets
RISK MANAGEMENT:
- Maximum daily loss: 5% (configurable)
- Maximum weekend loss: 15% (configurable)
- Per-position risk: Capped at 120-156 USDT
- Emergency stops for flash crashes (8% moves)
- Consecutive loss protection (4 losses = pause)
TECHNICAL INDICATORS:
- CVD (Cumulative Volume Delta) divergence detection
- ATR-based dynamic stop loss and take profit
- RSI, MACD, Bollinger Bands confluence
- Volume surge confirmation (1.5x average)
- Weekend liquidity adjustments
INTEGRATION:
- Designed for Bybit Futures (0.075% taker fee)
- WunderTrading webhook compatibility via JSON alerts
- Minimum position size: 120 USDT (Bybit requirement)
- Initial capital: $500 recommended
TARGET METRICS:
- Win rate target: 65%
- Average win: 5.5%
- Average loss: 1.8%
- Risk-reward ratio: ~3:1
IMPORTANT DISCLAIMERS:
- Past performance does not guarantee future results
- Leveraged trading carries substantial risk of loss
- Weekend crypto markets have 13% of normal liquidity
- Not suitable for traders who cannot afford to lose their entire investment
- Requires continuous monitoring and adjustment
USAGE:
1. Apply to 15-minute charts only
2. Configure weekend hours for your timezone
3. Set up webhook alerts for automation
4. Monitor performance table in top-right corner
5. Adjust parameters based on your risk tolerance
This is an experimental strategy for educational purposes. Always test with small amounts first and never invest more than you can afford to lose completely.

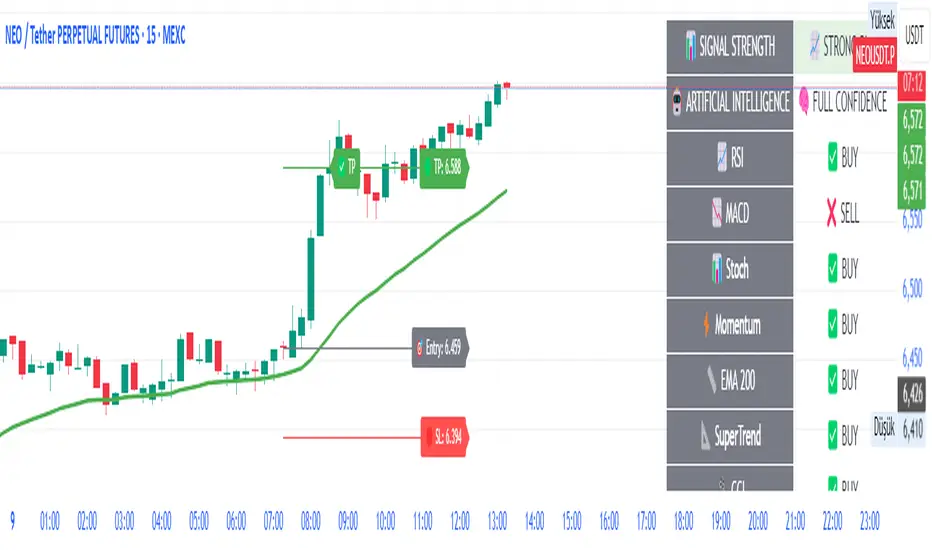
AI-Powered ScalpMaster Pro [By TraderMan]🧠 AI-Powered ScalpMaster Pro How It Works
📊 What Is the Indicator and What Does It Do?
🧠 AI-Powered ScalpMaster Pro is a powerful technical analysis tool designed for scalping (short-term, fast-paced trading) in financial markets such as forex, crypto, or stocks. It combines multiple technical indicators (RSI, MACD, Stochastic, Momentum, EMA, SuperTrend, CCI, and OBV) to identify market trends and generate AI-driven buy (🟢) or sell (🔴) signals. The goal is to help traders seize profitable scalping opportunities with quick and precise decisions. 🚀
Key Features:
🧠 AI-Driven Logic: Analyzes signals from multiple indicators to produce reliable trend signals.
📈 Signal Strength: Displays buy (bull) and sell (bear) signal strength as percentages.
✅ Success Rate: Tracks the performance of the last 5 trades and calculates the success rate.
🎯 Entry, TP, and SL Levels: Automatically sets entry points, take profit (TP), and stop loss (SL) levels.
📏 EMA Zone: Analyzes price movement around the EMA 200 to confirm trend direction.
⚙️ How Does It Work?
The indicator uses a scoring system by combining the following technical indicators:
RSI (14): Evaluates whether the price is in overbought or oversold zones.
MACD (12, 26, 9): Analyzes trend direction and momentum.
Stochastic (%K): Measures the speed of price movement.
Momentum: Checks the price change over the last 10 bars.
EMA 200: Determines the long-term trend direction.
SuperTrend: Tracks trends based on volatility.
CCI (20): Measures price deviation from its normal range.
OBV ROC: Analyzes volume changes.
Each indicator generates a buy (bull) or sell (bear) signal. If 6 or more indicators align in the same direction (e.g., bullScore >= 6 for buy), the indicator produces a strong trend signal:
📈 Strong Buy Signal: bullScore >= 6 and bullScore > bearScore.
📉 Strong Sell Signal: bearScore >= 6 and bearScore > bullScore.
🔸 Neutral: No dominant direction.
Additionally, the EMA Zone feature confirms the trend based on the price’s position relative to a zone around the EMA 200:
Price above the zone and sufficiently distant → Uptrend (UP). 🟢
Price below the zone and sufficiently distant → Downtrend (DOWN). 🔴
Price within the zone → Neutral. 🔸
🖥️ Display on the Chart
Table: A table in the top-right corner shows the status of all indicators (✅ Buy / ❌ Sell), signal strength (as %), success rate, and results of the last 5 trades.
Lines and Labels:
🎯 Entry Level: A gray line at the price level when a new signal is generated.
🟢 TP (Take Profit): A green line showing the take-profit level.
🔴 SL (Stop Loss): A red line showing the stop-loss level.
EMA Zone: The EMA 200 and its surrounding colored zone visualize the trend direction (green: uptrend, red: downtrend, gray: neutral).
📝 How to Use It?
Platform Setup:
Add the indicator to the TradingView platform.
Customize settings as needed (e.g., EMA length, risk/reward ratio).
Monitoring Signals:
Check the table: Look for 📈 STRONG BUY or 📉 STRONG SELL signals to prepare for a trade.
AI Text: Trust signals more when it says "🧠 FULL CONFIDENCE" (success rate ≥ 50%). Be cautious if it says "⚠️ LOW CONFIDENCE."
Entering a Position:
🟢 Buy Signal:
Table shows "📈 STRONG BUY" and bullScore >= 6.
Price is above the EMA Zone (green zone).
Entry: Current price (🎯 entry line).
TP: 2% above the entry price (🟢 TP line).
SL: 1% below the entry price (🔴 SL line).
🔴 Sell Signal:
Table shows "📉 STRONG SELL" and bearScore >= 6.
Price is below the EMA Zone (red zone).
Entry: Current price (🎯 entry line).
TP: 2% below the entry price (🟢 TP line).
SL: 1% above the entry price (🔴 SL line).
Position Management:
If the price hits TP, the trade closes profitably (✅ Successful).
If the price hits SL, the trade closes with a loss (❌ Failed).
Results are updated in the "Last 5 Trades" section of the table.
Risk Management:
Default risk/reward ratio is 1:2 (1% risk, 2% reward).
Always adjust position size based on your capital.
Consider smaller lot sizes for "⚠️ LOW CONFIDENCE" signals.
💡 Tips
Timeframe: Use 1-minute, 5-minute, or 15-minute charts for scalping.
Market Selection: Works best in volatile markets (e.g., BTC/USD, EUR/USD).
Confirmation: Ensure the EMA Zone trend aligns with the signal.
Discipline: Stick to TP and SL levels, avoid emotional decisions.
⚠️ Warnings
No indicator is 100% accurate. Always use additional analysis (e.g., support/resistance).
Be cautious during high-volatility periods (e.g., news events).
The success rate is based on past performance and does not guarantee future results.
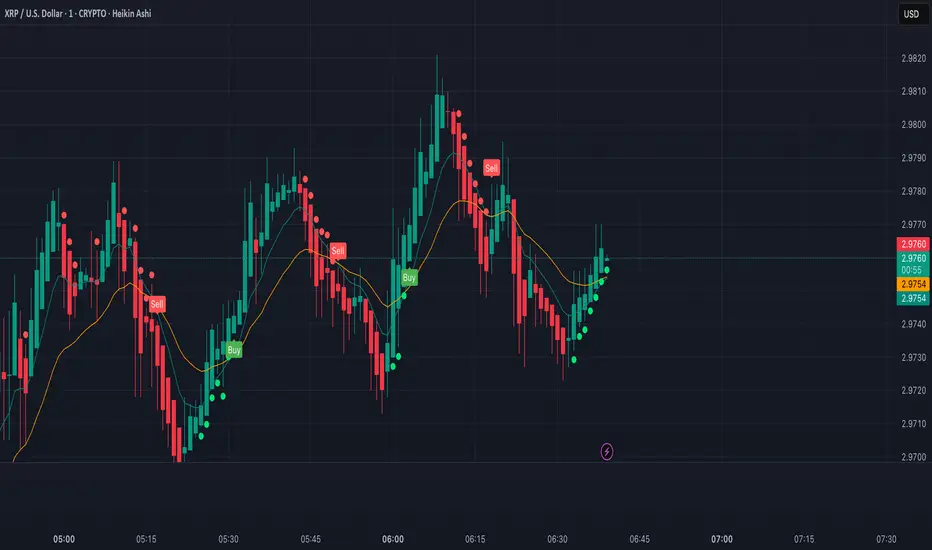
XRP Scalping with EMA Crossover Anticipation This script is designed to detect scalping opportunities on XRP by anticipating EMA crossovers, reinforced with technical confirmation filters.
Methodology
- The core signal is based on the crossover between a fast EMA (9) and a slow EMA (21).
- RSI (14) conditions are applied to avoid weak setups: RSI must be above 40 for buy signals and below 70 for sell signals.
- Before any crossover is validated, the script requires at least two consecutive “pre-crossover” signals. These indicate favorable momentum and convergence conditions before the crossover occurs.
- Final signals are only displayed if this minimum number of preconditions is met.
Application
This system is optimized for scalping on the 1-minute to 5-minute timeframes but can be adapted for longer-term setups by adjusting parameters. The anticipation logic helps reduce lagging entries and improves signal selectivity during volatile conditions.
Both pre-crossover and confirmed crossover conditions include alert options. The code is fully editable and customizable.
Baseline TrendBaseline Trend Strategy Overview
Baseline Trend is a crypto-only trading strategy built on straightforward price-based logic: market direction is determined solely by the price’s position relative to a selected baseline open price. No technical indicators like RSI, MACD, or volume are used—this approach is purely focused on price action and position size manipulation.
This strategy is a genuine concept, developed from my own market analysis and logical theory, refined through extensive observation of crypto market behaviour.
While the strategy offers structure and adaptability, it’s important to recognise that no single trading system or indicator fits all market conditions. This tool is meant to support decision-making, not replace it—encouraging traders to stay flexible, informed, and in control of their risk.
Important Usage Note:
This system is intended for crypto markets only.
– When used as an indicator guide, it can be applied to both spot and futures markets.
– However, when used with web-hook automation, it is designed only for futures contracts.
Ensure compatibility with your trading setup before using automation features.
Core Logic: The Baseline
The strategy revolves around the concept of a “Baseline”, with three types available:
Main Baseline: Defines the primary trend direction. If the price is above, go long; if below, go short.
Second Baseline and Third Baseline: Used to measure buying/selling pressure and are key to certain take-profit logic options.
Baselines are customisable to different timeframes—Year, Month, Week, and more—based on available input settings. Structurally, the Main Baseline is the highest-level trend reference, followed by the Second, then Third.
Users can mix and match these baselines across timeframes to backtest crypto symbols and understand behaviour patterns, particularly when used with standard candlestick charts.
Entry & Exit Logic
Entry Signal: Triggered when price crosses over/under a defined distance (percentage) from the Main Baseline. This distance is the Trade Line, calculated based on the close price.
Exit Signal / Stop Loss: If price moves un-favorable and crosses over/under the Stop Loss Line (a defined distance from the Main Baseline), the open position will be force-closed according to user-defined settings.
LiqC (Liquidation Cut)
LiqC is a secondary stop-loss that activates when a leveraged position’s loss equals or exceeds the user-defined liquidation threshold. It forcefully closes the position to help prevent full liquidation before stop-loss, providing an extra layer of protection.
This LiqC is directly tied to the leverage level set by the user. Please ensure you understand how leverage affects liquidation risk, as different broker exchanges may use different liquidation ratio models. Using incorrect assumptions or mismatched leverage values may result in unexpected behaviour.
Position Sizing & Block Units
This strategy features a block-based position sizing system designed for flexibility and precision in trade management:
Block Range: Customisable from 1 to 10 blocks
Risk Allocation: Controlled through a user-defined ROE (Risk of Equity) value
For example, setting an ROE of 0.1% with 10 blocks allocates a total of 1% of account equity to the position. This structure supports both conservative and aggressive risk approaches, depending on user preference.
Block sizes are automatically calculated in alignment with exchange requirements, using Minimum Notional Value (MNV) and Minimum Trade Amount (MTA). These values are dynamically calculated based on the live market price, and scaled relative to the trader’s balance and selected risk percentage. This ensures accurate sizing with built-in adaptability for any account level and current market conditions.
Scalping Meets Trend Holding
This system blends short-term scalping with longer-term trend holding, offering a flexible and adaptive trading style.
Example:
Enter 10 blocks → take quick profits on 5 blocks → let the remaining 5 ride the trend.
This dual-layered approach allows traders to secure early gains while staying positioned for larger market moves. Think of it as:
5 Blocks to Protect: Capture quick wins and manage exposure.
5 Blocks to Pursue: Let profits run by following the broader trend.
By combining both protection and pursuit, the strategy supports risk control without sacrificing the potential for extended returns.
Flexible Take-Profit Logic
The strategy supports multiple, customisable take-profit mechanisms:
TP1–4 (Profit Percentage)
Triggers take profit of 1 block unit when unrealised gains reach defined percentage thresholds (TP1, TP2, TP3, TP4).
Buying/Selling Pressure-Based Take Profit
D1 – Pressure 1
Measures pressure between Second and Third Baselines.
If the distance between them exceeds a user-defined DPT (Decrease Post Threshold) and the price moves far enough from the Third Baseline, D1 activates to take profit or scale out one block.
D2 – Pressure 2
Measures pressure between the Main and Second Baselines.
Works similarly to D1, using a separate distance and pressure trigger.
Note: Both D1 and D2 deactivate in reversal or even trend conditions.
D3–5: High-High / Low-Low Logic
Based on bar index tracking after position entry:
For Long Positions: If after D3 bars the price doesn't exceed the previous bar's high, the system executes a take profit or scale-out.
For Short Positions: If the price doesn't drop below the previous low, the same logic applies.
This approach adds time-based and momentum-aware exit flexibility.
Leverage & Liquidation Risk
When backtesting with leverage enabled, the system checks whether historical candles exceed the liquidation range, calculated based on the average entry price and the leverage input. If the Liquidation Risk Count exceeds 1, profit and loss accuracy may be affected. Traders are encouraged to monitor this count closely to ensure realistic backtesting results.
Since the system cannot directly control or sync with your broker exchange’s actual leverage setting, it’s important to manually match the system’s leverage input with your broker’s configured leverage.
For example: If the system leverage input is set to 10, your exchange leverage setting must also be set to 10. Any mismatch will lead to inaccurate liquidation risk and PnL calculations.
Backtesting and Customisation
All TP1–4 and D1–5 functions are fully optional and customisable. Users are encouraged to backtest different crypto symbols to observe how price behaviour aligns with baseline structures and pressure metrics.
Each of the TP1–4 and D1–5 triggers is designed to execute only once per open position, ensuring controlled and predictable behaviour within each trade cycle.
Since backtesting is based on available historical bar data, please note that data availability varies depending on your TradingView subscription plan. For more reliable insights, it’s recommended to backtest across multiple time ranges, not just the full dataset, to assess the stability and consistency of the strategy’s performance over time.
Additionally, the time frame resolution interval in TradingView is customisable. For best results, use commonly supported time frames such as 30 minutes, 1 hour, 4 hours, 1 day, or 1 week. While the system is designed to support a broad range of intervals, non-standard resolutions may still cause calculation errors.
Currently, the system supports the following resolution ranges:
Intraday: from 1 minute to 720 minutes
(e.g., 60 minutes = 1 hour, 240 minutes = 4 hours, 720 minutes = 12 hours)
Daily: from 1 day to 6 days
Weekly: from 1 week to 3 weeks
Monthly: from 1 month to 4 months
Although the script is built to adapt to various resolutions, users should still monitor output behaviour closely, especially when testing less common or edge-case time frames.
System Usage Notice:
This system can be used as a standalone trading indicator or integrated with an exchange that supports web-hook signal execution. If you choose to automate trades via web-hook, please ensure you fully understand how to configure the setup properly. Web-hook integration methods vary between exchanges, and incorrect setup may lead to unintended trades. Users are responsible for ensuring proper configuration and monitoring of their automation.
Note on Lower Time Frame Usage
When using lower time frames (e.g., 1-minute charts) as the trading time frame, please be aware that available historical data may be limited depending on your subscription plan. This can affect the depth and reliability of backtesting, making it harder to establish a trustworthy probability model for a symbol’s behaviour over time.
Additionally, when pairing a high-level Main Baseline (MBL) time line (such as "1 Month") with low time frame resolutions (like 1-minute), you may encounter order execution limits or calculation overloads during backtesting. This is due to the large number of historical bars required, which can strain the system's capacity.
That said, if a user intentionally chooses to work with lower time frames, that decision is fully respected—but it should be done with awareness and at the user’s own risk.
Things to Be Aware Of (Web-hook Usage Only)
The following points apply if you're using web-hook automation to send signals from the system to an exchange:
Alert Signal Reliability
During extreme market volatility, some broker exchanges may fail to respond to web-hook signals due to traffic overload. While rare, this has occurred in the past and should be considered when relying on automation.
Alert Expiration (TradingView)
If you're on a Basic plan, TradingView alerts are only active for a limited time—typically around 1.5 months. Once expired, signals will no longer be sent out.
To keep your system active, reset the alert before expiration. For uninterrupted alerts, consider upgrading to a Premium plan, which supports permanent alert activation.
TradingView Alert Maintenance
TradingView may occasionally perform system maintenance, during which alerts may temporarily stop functioning. It’s recommended to monitor TradingView’s status if you’re relying on real-time automation.
Repainting
As of the current version, no repainting behaviour has been observed. Signal stability and consistency have been maintained across real-time and historical bars.
Order Execution Type and Fill Logic
All signals use Limit orders by default, except for MBL Exit and Fallback execution, which use Market orders.
Since Limit orders are not guaranteed to fill, the system includes logic to cancel unfilled orders and resend them. If necessary, a Fallback Market order is used to avoid conflict with new incoming trades.
This has only happened once, and is considered rare, but users should always monitor execution status to ensure accuracy and alignment with system behaviour.
Feedback
If you encounter any errors, bugs, or unexpected behaviour while using the system, please don’t hesitate to let me know. Your input is invaluable for helping improve the strategy in future updates.
Likewise, if you have any suggestions or ideas for enhancing the system—whether it’s a new feature, adjustment, or usability improvement—please feel free to share. Together, we can continue refining the tool to make it more robust and beneficial for everyone.
Disclaimer
All trading involves risk, particularly in the crypto market where conditions can be highly volatile. Past performance does not guarantee future outcomes, and market behaviour may evolve over time. This strategy is offered as a tool to support trading decisions and should not be considered financial or investment advice. Each user is responsible for their own actions and accepts full responsibility for any results that may arise from using this system.

Ultimate Scalping Tool[BullByte]Overview
The Ultimate Scalping Tool is an open-source TradingView indicator built for scalpers and short-term traders released under the Mozilla Public License 2.0. It uses a custom Quantum Flux Candle (QFC) oscillator to combine multiple market forces into one visual signal. In plain terms, the script reads momentum, trend strength, volatility, and volume together and plots a special “candlestick” each bar (the QFC) that reflects the overall market bias. This unified view makes it easier to spot entries and exits: the tool labels signals as Strong Buy/Sell, Pullback (a brief retracement in a trend), Early Entry, or Exit Warning . It also provides color-coded alerts and a small dashboard of metrics. In practice, traders see green/red oscillator bars and symbols on the chart when conditions align, helping them scalp or trend-follow without reading multiple separate indicators.
Core Components
Quantum Flux Candle (QFC) Construction
The QFC is the heart of the indicator. Rather than using raw price, it creates a candlestick-like bar from the underlying oscillator values. Each QFC bar has an “open,” “high/low,” and “close” derived from calculated momentum and volatility inputs for that period . In effect, this turns the oscillator into intuitive candle patterns so traders can recognize momentum shifts visually. (For comparison, note that Heikin-Ashi candles “have a smoother look because take an average of the movement”. The QFC instead represents exact oscillator readings, so it reflects true momentum changes without hiding price action.) Colors of QFC bars change dynamically (e.g. green for bullish momentum, red for bearish) to highlight shifts. This is the first open-source QFC oscillator that dynamically weights four non-correlated indicators with moving thresholds, which makes it a unique indicator on its own.
Oscillator Normalization & Adaptive Weights
The script normalizes its oscillator to a fixed scale (for example, a 0–100 range much like the RSI) so that various inputs can be compared fairly. It then applies adaptive weighting: the relative influence of trend, momentum, volatility or volume signals is automatically adjusted based on current market conditions. For instance, in very volatile markets the script might weight volatility more heavily, or in a strong trend it might give extra weight to trend direction. Normalizing data and adjusting weights helps keep the QFC sensitive but stable (normalization ensures all inputs fit a common scale).
Trend/Momentum/Volume/Volatility Fusion
Unlike a typical single-factor oscillator, the QFC oscillator fuses four aspects at once. It may compute, for example, a trend indicator (such as an ADX or moving average slope), a momentum measure (like RSI or Rate-of-Change), a volume-based pressure (similar to MFI/OBV), and a volatility measure (like ATR) . These different values are combined into one composite oscillator. This “multi-dimensional” approach follows best practices of using non-correlated indicators (trend, momentum, volume, volatility) for confirmation. By encoding all these signals in one line, a high QFC reading means that trend, momentum, and volume are all aligned, whereas a neutral reading might mean mixed conditions. This gives traders a comprehensive picture of market strength.
Signal Classification
The script interprets the QFC oscillator to label trades. For example:
• Strong Buy/Sell : Triggered when the oscillator crosses a high-confidence threshold (e.g. breaks clearly above zero with strong slope), indicating a well-confirmed move. This is like seeing a big green/red QFC candle aligned with the trend.
• Pullbacks : Identified when the trend is up but momentum dips briefly. A Pullback Buy appears if the overall trend is bullish but the oscillator has a short retracement – a typical buying opportunity in an uptrend. (A pullback is “a brief decline or pause in a generally upward price trend”.)
• Early Buy/Sell : Marks an initial swing in the oscillator suggesting a possible new trend, before it is fully confirmed. It’s a hint of momentum building (an early-warning signal), not as strong as the confirmed “Strong” signal.
• Exit Warnings : Issued when momentum peaks or reverses. For instance, if the QFC bars reach a high and start turning red/green opposite, the indicator warns that the move may be ending. In other words, a Momentum Peak is the point of maximum strength after which weakness may follow.
These categories correspond to typical trading concepts: Pullback (temporary reversal in an uptrend), Early Buy (an initial bullish cross), Strong Buy (confirmed bullish momentum), and Momentum Peak (peak oscillator value suggesting exhaustion).
Filters (DI Reversal, Dynamic Thresholds, HTF EMA/ADX)
Extra filters help avoid bad trades. A DI Reversal filter uses the +DI/–DI lines (from the ADX system) to require that the trend direction confirms the signal . For example, it might ignore a buy signal if the +DI is still below –DI. Dynamic Thresholds adjust signal levels on-the-fly: rather than fixed “overbought” lines, they move with volatility so signals happen under appropriate market stress. An optional High-Timeframe EMA or ADX filter adds a check against a larger timeframe trend: for instance, only taking a trade if price is above the weekly EMA or if weekly ADX shows a strong trend. (Notably, the ADX is “a technical indicator used by traders to determine the strength of a price trend”, so requiring a high-timeframe ADX avoids trading against the bigger trend.)
Dashboard Metrics & Color Logic
The Dashboard in the Ultimate Scalping Tool (UST) serves as a centralized information hub, providing traders with real-time insights into market conditions, trend strength, momentum, volume pressure, and trade signals. It is highly customizable, allowing users to adjust its appearance and content based on their preferences.
1. Dashboard Layout & Customization
Short vs. Extended Mode : Users can toggle between a compact view (9 rows) and an extended view (13 rows) via the `Short Dashboard` input.
Text Size Options : The dashboard supports three text sizes— Tiny, Small, and Normal —adjustable via the `Dashboard Text Size` input.
Positioning : The dashboard is positioned in the top-right corner by default but can be moved if modified in the script.
2. Key Metrics Displayed
The dashboard presents critical trading metrics in a structured table format:
Trend (TF) : Indicates the current trend direction (Strong Bullish, Moderate Bullish, Sideways, Moderate Bearish, Strong Bearish) based on normalized trend strength (normTrend) .
Momentum (TF) : Displays momentum status (Strong Bullish/Bearish or Neutral) derived from the oscillator's position relative to dynamic thresholds.
Volume (CMF) : Shows buying/selling pressure levels (Very High Buying, High Selling, Neutral, etc.) based on the Chaikin Money Flow (CMF) indicator.
Basic & Advanced Signals:
Basic Signal : Provides simple trade signals (Strong Buy, Strong Sell, Pullback Buy, Pullback Sell, No Trade).
Advanced Signal : Offers nuanced signals (Early Buy/Sell, Momentum Peak, Weakening Momentum, etc.) with color-coded alerts.
RSI : Displays the Relative Strength Index (RSI) value, colored based on overbought (>70), oversold (<30), or neutral conditions.
HTF Filter : Indicates the higher timeframe trend status (Bullish, Bearish, Neutral) when using the Leading HTF Filter.
VWAP : Shows the V olume-Weighted Average Price and whether the current price is above (bullish) or below (bearish) it.
ADX : Displays the Average Directional Index (ADX) value, with color highlighting whether it is rising (green) or falling (red).
Market Mode : Shows the selected market type (Crypto, Stocks, Options, Forex, Custom).
Regime : Indicates volatility conditions (High, Low, Moderate) based on the **ATR ratio**.
3. Filters Status Panel
A secondary panel displays the status of active filters, helping traders quickly assess which conditions are influencing signals:
- DI Reversal Filter: On/Off (confirms reversals before generating signals).
- Dynamic Thresholds: On/Off (adjusts buy/sell thresholds based on volatility).
- Adaptive Weighting: On/Off (auto-adjusts oscillator weights for trend/momentum/volatility).
- Early Signal: On/Off (enables early momentum-based signals).
- Leading HTF Filter: On/Off (applies higher timeframe trend confirmation).
4. Visual Enhancements
Color-Coded Cells : Each metric is color-coded (green for bullish, red for bearish, gray for neutral) for quick interpretation.
Dynamic Background : The dashboard background adapts to market conditions (bullish/bearish/neutral) based on ADX and DI trends.
Customizable Reference Lines : Users can enable/disable fixed reference lines for the oscillator.
How It(QFC) Differs from Traditional Indicators
Quantum Flux Candle (QFC) Versus Heikin-Ashi
Heikin-Ashi candles smooth price by averaging (HA’s open/close use averages) so they show trend clearly but hide true price (the current HA bar’s close is not the real price). QFC candles are different: they are oscillator values, not price averages . A Heikin-Ashi chart “has a smoother look because it is essentially taking an average of the movement”, which can cause lag. The QFC instead shows the raw combined momentum each bar, allowing faster recognition of shifts. In short, HA is a smoothed price chart; QFC is a momentum-based chart.
Versus Standard Oscillators
Common oscillators like RSI or MACD use fixed formulas on price (or price+volume). For example, RSI “compares gains and losses and normalizes this value on a scale from 0 to 100”, reflecting pure price momentum. MFI is similar but adds volume. These indicators each show one dimension: momentum or volume. The Ultimate Scalping Tool’s QFC goes further by integrating trend strength and volatility too. In practice, this means a move that looks strong on RSI might be downplayed by low volume or weak trend in QFC. As one source notes, using multiple non-correlated indicators (trend, momentum, volume, volatility) provides a more complete market picture. The QFC’s multi-factor fusion is unique – it is effectively a multi-dimensional oscillator rather than a traditional single-input one.
Signal Style
Traditional oscillators often use crossovers (RSI crossing 50) or fixed zones (MACD above zero) for signals. The Ultimate Scalping Tool’s signals are custom-classified: it explicitly labels pullbacks, early entries, and strong moves. These terms go beyond a typical indicator’s generic “buy”/“sell.” In other words, it packages a strategy around the oscillator, which traders can backtest or observe without reading code.
Key Term Definitions
• Pullback : A short-term dip or consolidation in an uptrend. In this script, a Pullback Buy appears when price is generally rising but shows a brief retracement. (As defined by Investopedia, a pullback is “a brief decline or pause in a generally upward price trend”.)
• Early Buy/Sell : An initial or tentative entry signal. It means the oscillator first starts turning positive (or negative) before a full trend has developed. It’s an early indication that a trend might be starting.
• Strong Buy/Sell : A confident entry signal when multiple conditions align. This label is used when momentum is already strong and confirmed by trend/volume filters, offering a higher-probability trade.
• Momentum Peak : The point where bullish (or bearish) momentum reaches its maximum before weakening. When the oscillator value stops rising (or falling) and begins to reverse, the script flags it as a peak – signaling that the current move could be overextended.
What is the Flux MA?
The Flux MA (Moving Average) is an Exponential Moving Average (EMA) applied to a normalized oscillator, referred to as FM . Its purpose is to smooth out the fluctuations of the oscillator, providing a clearer picture of the underlying trend direction and strength. Think of it as a dynamic baseline that the oscillator moves above or below, helping you determine whether the market is trending bullish or bearish.
How it’s calculated (Flux MA):
1.The oscillator is normalized (scaled to a range, typically between 0 and 1, using a default scale factor of 100.0).
2.An EMA is applied to this normalized value (FM) over a user-defined period (default is 10 periods).
3.The result is rescaled back to the oscillator’s original range for plotting.
Why it matters : The Flux MA acts like a support or resistance level for the oscillator, making it easier to spot trend shifts.
Color of the Flux Candle
The Quantum Flux Candle visualizes the normalized oscillator (FM) as candlesticks, with colors that indicate specific market conditions based on the relationship between the FM and the Flux MA. Here’s what each color means:
• Green : The FM is above the Flux MA, signaling bullish momentum. This suggests the market is trending upward.
• Red : The FM is below the Flux MA, signaling bearish momentum. This suggests the market is trending downward.
• Yellow : Indicates strong buy conditions (e.g., a "Strong Buy" signal combined with a positive trend). This is a high-confidence signal to go long.
• Purple : Indicates strong sell conditions (e.g., a "Strong Sell" signal combined with a negative trend). This is a high-confidence signal to go short.
The candle mode shows the oscillator’s open, high, low, and close values for each period, similar to price candlesticks, but it’s the color that provides the quick visual cue for trading decisions.
How to Trade the Flux MA with Respect to the Candle
Trading with the Flux MA and Quantum Flux Candle involves using the MA as a trend indicator and the candle colors as entry and exit signals. Here’s a step-by-step guide:
1. Identify the Trend Direction
• Bullish Trend : The Flux Candle is green and positioned above the Flux MA. This indicates upward momentum.
• Bearish Trend : The Flux Candle is red and positioned below the Flux MA. This indicates downward momentum.
The Flux MA serves as the reference line—candles above it suggest buying pressure, while candles below it suggest selling pressure.
2. Interpret Candle Colors for Trade Signals
• Green Candle : General bullish momentum. Consider entering or holding a long position.
• Red Candle : General bearish momentum. Consider entering or holding a short position.
• Yellow Candle : A strong buy signal. This is an ideal time to enter a long trade.
• Purple Candle : A strong sell signal. This is an ideal time to enter a short trade.
3. Enter Trades Based on Crossovers and Colors
• Long Entry : Enter a buy position when the Flux Candle turns green and crosses above the Flux MA. If it turns yellow, this is an even stronger signal to go long.
• Short Entry : Enter a sell position when the Flux Candle turns red and crosses below the Flux MA. If it turns purple, this is an even stronger signal to go short.
4. Exit Trades
• Exit Long : Close your buy position when the Flux Candle turns red or crosses below the Flux MA, indicating the bullish trend may be reversing.
• Exit Short : Close your sell position when the Flux Candle turns green or crosses above the Flux MA, indicating the bearish trend may be reversing.
•You might also exit a long trade if the candle changes from yellow to green (weakening strong buy signal) or a short trade from purple to red (weakening strong sell signal).
5. Use Additional Confirmation
To avoid false signals, combine the Flux MA and candle signals with other indicators or dashboard metrics (e.g., trend strength, momentum, or volume pressure). For example:
•A yellow candle with a " Strong Bullish " trend and high buying volume is a robust long signal.
•A red candle with a " Moderate Bearish " trend and neutral momentum might need more confirmation before shorting.
Practical Example
Imagine you’re scalping a cryptocurrency:
• Long Trade : The Flux Candle turns yellow and is above the Flux MA, with the dashboard showing "Strong Buy" and high buying volume. You enter a long position. You exit when the candle turns red and dips below the Flux MA.
• Short Trade : The Flux Candle turns purple and crosses below the Flux MA, with a "Strong Sell" signal on the dashboard. You enter a short position. You exit when the candle turns green and crosses above the Flux MA.
Market Presets and Adaptation
This indicator is designed to work on any market with candlestick price data (stocks, crypto, forex, indices, etc.). To handle different behavior, it provides presets for major asset classes. Selecting a “Stocks,” “Crypto,” “Forex,” or “Options” preset automatically loads a set of parameter values optimized for that market . For example, a crypto preset might use a shorter lookback or higher sensitivity to account for crypto’s high volatility, while a stocks preset might use slightly longer smoothing since stocks often trend more slowly. In practice, this means the same core QFC logic applies across markets, but the thresholds and smoothing adjust so signals remain relevant for each asset type.
Usage Guidelines
• Recommended Timeframes : Optimized for 1 minute to 15 minute intraday charts. Can also be used on higher timeframes for short term swings.
• Market Types : Select “Crypto,” “Stocks,” “Forex,” or “Options” to auto tune periods, thresholds and weights. Use “Custom” to manually adjust all inputs.
• Interpreting Signals : Always confirm a signal by checking that trend, volume, and VWAP agree on the dashboard. A green “Strong Buy” arrow with green trend, green volume, and price > VWAP is highest probability.
• Adjusting Sensitivity : To reduce false signals in fast markets, enable DI Reversal Confirmation and Dynamic Thresholds. For more frequent entries in trending environments, enable Early Entry Trigger.
• Risk Management : This tool does not plot stop loss or take profit levels. Users should define their own risk parameters based on support/resistance or volatility bands.
Background Shading
To give you an at-a-glance sense of market regime without reading numbers, the indicator automatically tints the chart background in three modes—neutral, bullish and bearish—with two levels of intensity (light vs. dark):
Neutral (Gray)
When ADX is below 20 the market is considered “no trend” or too weak to trade. The background fills with a light gray (high transparency) so you know to sit on your hands.
Bullish (Green)
As soon as ADX rises above 20 and +DI exceeds –DI, the background turns a semi-transparent green, signaling an emerging uptrend. When ADX climbs above 30 (strong trend), the green becomes more opaque—reminding you that trend-following signals (Strong Buy, Pullback) carry extra weight.
Bearish (Red)
Similarly, if –DI exceeds +DI with ADX >20, you get a light red tint for a developing downtrend, and a darker, more solid red once ADX surpasses 30.
By dynamically varying both hue (green vs. red vs. gray) and opacity (light vs. dark), the background instantly communicates trend strength and direction—so you always know whether to favor breakout-style entries (in a strong trend) or stay flat during choppy, low-ADX conditions.
The setup shown in the above chart snapshot is BTCUSD 15 min chart : Binance for reference.
Disclaimer
No indicator guarantees profits. Backtest or paper trade this tool to understand its behavior in your market. Always use proper position sizing and stop loss orders.
Good luck!
- BullByte

Williams R Zone Scalper v1.0[BullByte]Originality & Usefulness
Unlike standard Williams R cross-over scripts, this strategy layers five dynamic filters—moving-average trend, Supertrend, Choppiness Index, Bollinger Band Width, and volume validation —and presents a real-time dashboard with equity, PnL, filter status, and key indicator values. No other public Pine script combines these elements with toggleable filters and a custom dashboard. In backtests (BTC/USD (Binance), 5 min, 24 Mar 2025 → 28 Apr 2025), adding these filters turned a –2.09 % standalone Williams R into a +5.05 % net winner while cutting maximum drawdown in half.
---
What This Script Does
- Monitors Williams R (length 14) for overbought/oversold reversals.
- Applies up to five dynamic filters to confirm trend strength and volatility direction:
- Moving average (SMA/EMA/WMA/HMA)
- Supertrend line
- Choppiness Index (CI)
- Bollinger Band Width (BBW)
- Volume vs. its 50-period MA
- Plots blue arrows for Long entries (R crosses above –80 + all filters green) and red arrows for Short entries (R crosses below –20 + all filters green).
- Optionally sets dynamic ATR-based stop-loss (1.5×ATR) and take-profit (2×ATR).
- Shows a dashboard box with current position, equity, PnL, filter status, and real-time Williams R / MA/volume values.
---
Backtest Summary (BTC/USD(Binance), 5 min, 24 Mar 2025 → 28 Apr 2025)
• Total P&L : +50.70 USD (+5.05 %)
• Max Drawdown : 31.93 USD (3.11 %)
• Total Trades : 198
• Win Rate : 55.05 % (109/89)
• Profit Factor : 1.288
• Commission : 0.01 % per trade
• Slippage : 0 ticks
Even in choppy March–April, this multi-filter approach nets +5 % with a robust risk profile, compared to –2.09 % and higher drawdown for Williams R alone.
---
Williams R Alone vs. Multi-Filter Version
• Total P&L :
– Williams R alone → –20.83 USD (–2.09 %)
– Multi-Filter → +50.70 USD (+5.05 %)
• Max Drawdown :
– Williams R alone → 62.13 USD (6.00 %)
– Multi-Filter → 31.93 USD (3.11 %)
• Total Trades : 543 vs. 198
• Win Rate : 60.22 % vs. 55.05 %
• Profit Factor : 0.943 vs. 1.288
---
Inputs & What They Control
- wrLen (14): Williams R look-back
- maType (EMA): Trend filter type (SMA, EMA, WMA, HMA)
- maLen (20): Moving-average period
- useChop (true): Toggle Choppiness Index filter
- ciLen (12): CI look-back length
- chopThr (38.2): CI threshold (below = trending)
- useVol (true): Toggle volume-above-average filter
- volMaLen (50): Volume MA period
- useBBW (false): Toggle Bollinger Band Width filter
- bbwMaLen (50): BBW MA period
- useST (false): Toggle Supertrend filter
- stAtrLen (10): Supertrend ATR length
- stFactor (3.0): Supertrend multiplier
- useSL (false): Toggle ATR-based SL/TP
- atrLen (14): ATR period for SL/TP
- slMult (1.5): SL = slMult × ATR
- tpMult (2.0): TP = tpMult × ATR
---
How to Read the Chart
- Blue arrow (Long): Williams R crosses above –80 + all enabled filters green
- Red arrow (Short) : Williams R crosses below –20 + all filters green
- Dashboard box:
- Top : position and equity
- Next : cumulative PnL in USD & %
- Middle : green/white dots for each filter (green=passing, white=disabled)
- Bottom : Williams R, MA, and volume current values
---
Usage Tips
- Add the script : Indicators → My Scripts → Williams R Zone Scalper v1.0 → Add to BTC/USD chart on 5 min.
- Defaults : Optimized for BTC/USD.
- Forex majors : Raise `chopThr` to ~42.
- Stocks/high-beta : Enable `useBBW`.
- Enable SL/TP : Toggle `useSL`; stop-loss = 1.5×ATR, take-profit = 2×ATR apply automatically.
---
Common Questions
- * Why not trade every Williams R reversal?*
Raw Williams R whipsaws in sideways markets. Choppiness and volume filters reduce false entries.
- *Can I use on 1 min or 15 min?*
Yes—adjust ATR length or thresholds accordingly. Defaults target 5 min scalping.
- *What if all filters are on?*
Fewer arrows, higher-quality signals. Expect ~10 % boost in average win size.
---
Disclaimer & License
Trading carries risk of loss. Use this script “as is” under the Mozilla Public License 2.0 (mozilla.org). Always backtest, paper-trade, and adjust risk settings to your own profile.
---
Credits & References
- Pine Script v6, using TradingView’s built-in `ta.supertrend()`.
- TradingView House Rules: www.tradingview.com
Goodluck!
BullByte

TrendSync Pro (SMC)📊 TrendSync Pro (SMC) – Advanced Trend-Following Strategy with HTF Alignment
Created by Shubham Singh
🔍 Strategy Overview
TrendSync Pro (SMC) is a precision-based smart trend-following strategy inspired by Smart Money Concepts (SMC). It combines: Real-time pivot-based trendline detection
Higher Time Frame (HTF) filtering to align trades with dominant trend
Risk management via adjustable Stop Loss (SL) and Take Profit (TP)
Directional control — trade only bullish, bearish, or both setups
Realistic backtesting using commissions and slippage
Pre-optimized profiles for scalpers, intraday, swing, and long-term traders
🧠 How It Works:
🔧 Strategy Settings Image:
beeimg.com
The strategy dynamically identifies trend direction by using swing high/low pivots. When a new pivot forms: It draws a trendline from the last significant pivot
Detects whether the trend is up (based on pivot lows) or down (based on pivot highs)
Waits for price to break above/below the trendline
Confirms with HTF price direction (HTF close > previous HTF close = bullish)
Only then it triggers a long or short trade
It exits either at TP, SL, or a manual trendline break
🛠️ Adjustable Parameters:
Trend Period: Length for pivot detection (affects sensitivity of trendlines)
HTF Timeframe: Aligns lower timeframe entries with higher timeframe direction
SL% and TP%: Customize your risk-reward profile
Commission & Slippage: Make backtests more realistic
Trade Direction: Choose to trade: Long only, Short only, or Both
🎛️ Trade Direction Control:
In settings, you can choose: Bullish Only: Executes only long entries
Bearish Only: Executes only short entries
Both: Executes both long and short entries when conditions are met
This allows you to align trades with your own market bias or external analysis.
📈 Entry Logic: Long Entry:
• Price crosses above trendline
• HTF is bullish (HTF close > previous close)
• Latest pivot is a low (trend is considered up)
Short Entry:
• Price crosses below trendline
• HTF is bearish (HTF close < previous close)
• Latest pivot is a high (trend is considered down)
📉 Exit Logic: Hit Take Profit or Stop Loss
Manual trendline invalidation: If price crosses opposite of the trend direction
⏰ Best Timeframes & Recommended Settings:
Scalping (1m to 5m):
HTF = 15m | Trend Period = 7
SL = 0.5% | TP = 1% to 2%
Intraday (15m to 30m):
HTF = 1H | Trend Period = 10–14
SL = 0.75% | TP = 2% to 3%
6 Hour Trading (30m to 1H):
HTF = 4H | Trend Period = 20
SL = 1% | TP = 4% to 6%
Swing Trading (4H to 1D):
HTF = 1D | Trend Period = 35
SL = 2% | TP = 8% to 12%
Long-Term Investing (1D+):
HTF = 1W | Trend Period = 50
SL = 3% | TP = 15%+
Note: These are recommended base settings. Adjust based on volatility, asset class, or personal trading style.
📸 Testing Note:
beeimg.com
TradingView limits test length to 20k bars (~40 trades on smaller timeframes). To show long-term results: Test on higher timeframes (e.g., 1H, 4H, 1D)
Share images of backtest result in description
Host longer test result screenshots on Imgur or any public drive
📍 Asset Behavior Insight:
This strategy works on multiple assets, including BTC, ETH, etc.
Performance varies by trend strength:
Sometimes BTC performs better than ETH
Other times ETH gives better results
That’s normal as both assets follow different volatility and trend behavior
It’s a trend-following setup. Longer and clearer the trend → better the results.
✅ Best Practices: Avoid ranging markets
Use proper SL/TP for each timeframe
Use directional filter if you already have a directional bias
Always forward test before going live
⚠️ Trading Disclaimer:
This script is for educational and backtesting purposes only. Trading involves risk. Always use risk management and never invest more than you can afford to lose.

Smart Grid Scalping (Pullback) Strategy[BullByte]The Smart Grid Scalping (Pullback) Strategy is a high-frequency trading strategy designed for short-term traders who seek to capitalize on market pullbacks. This strategy utilizes a dynamic ATR-based grid system to define optimal entry points, ensuring precise trade execution. It integrates volatility filtering and an RSI-based confirmation mechanism to enhance signal accuracy and reduce false entries.
This strategy is specifically optimized for scalping by dynamically adjusting trade levels based on current market conditions. The grid-based system helps capture retracement opportunities while maintaining strict trade management through predefined profit targets and trailing stop-loss mechanisms.
Key Features :
1. ATR-Based Grid System :
- Uses a 10-period ATR to dynamically calculate grid levels for entry points.
- Prevents chasing trades by ensuring price has reached key levels before executing entries.
2. No Trade Zone Protection :
- Avoids low-volatility zones where price action is indecisive.
- Ensures only high-momentum trades are executed to improve success rate.
3. RSI-Based Entry Confirmation :
- Long trades are triggered when RSI is below 30 (oversold) and price is in the lower grid zone.
- Short trades are triggered when RSI is above 70 (overbought) and price is in the upper grid zone.
4. Automated Trade Execution :
- Long Entry: Triggered when price drops below the first grid level with sufficient volatility.
- Short Entry: Triggered when price exceeds the highest grid level with sufficient volatility.
5. Take Profit & Trailing Stop :
- Profit target set at a customizable percentage (default 0.2%).
- Adaptive trailing stop mechanism using ATR to lock in profits while minimizing premature exits.
6. Visual Trade Annotations :
- Clearly labeled "LONG" and "SHORT" markers appear at trade entries for better visualization.
- Grid levels are plotted dynamically to aid decision-making.
Strategy Logic :
- The script first calculates the ATR-based grid levels and ensures price action has sufficient volatility before allowing trades.
- An additional RSI filter is used to ensure trades are taken at ideal market conditions.
- Once a trade is executed, the script implements a trailing stop and predefined take profit to maximize gains while reducing risks.
---
Disclaimer :
Risk Warning :
This strategy is provided for educational and informational purposes only. Trading involves significant risk, and past performance is not indicative of future results. Users are advised to conduct their own due diligence and risk management before using this strategy in live trading.
The developer and publisher of this script are not responsible for any financial losses incurred by the use of this strategy. Market conditions, slippage, and execution quality can affect real-world trading outcomes.
Use this script at your own discretion and always trade responsibly.

Pro Scalper AI [BullByte]The Pro Scalper AI is a powerful, multi-faceted scalping indicator designed to assist active traders in identifying short-term trading opportunities with precision. By combining trend analysis, momentum indicators, dynamic weighting, and optional AI forecasting, this tool provides both immediate and latched trading signals based on confirmed (closed bar) data—helping to avoid repainting issues. Its flexible design includes customizable filters such as a higher timeframe trend filter, and adjustable settings for ADX, ATR, and Hull Moving Average (HMA), giving traders the ability to fine-tune the strategy to different markets and timeframes.
Key Features :
- Confirmed Data Processing :
Utilizes a helper function to lock in price and volume data only from confirmed (closed) bars, ensuring the reliability of signals without the risk of intrabar repainting.
- Trend Analysis :
Employs ADX and Directional Movement (DI) calculations along with a locally computed HMA to detect short-term trends. An optional higher timeframe trend filter can further refine the analysis.
- Flexible Momentum Modes :
Choose between three momentum calculation methods—Stochastic RSI, Fisher RSI, or Williams %R—to match your preferred style of analysis. This versatility allows you to optimize the indicator for different market conditions.
- Dynamic Weighting & Volatility Adjustments :
Adjusts the contribution of trend, momentum, volatility, and volume through dynamic weighting. This ensures that the indicator responds appropriately to varying market conditions by scaling its sensitivity with user-defined maximum factors.
- Optional AI Forecast :
For those who want an extra edge, the built-in AI forecasting module uses linear regression to predict future price moves and adjusts oscillator thresholds accordingly. This feature can be toggled on or off, with smoothing options available for more stable output.
- Latching Mode for Signal Persistenc e:
The script features a latching mechanism that holds signals until a clear reversal is detected, preventing whipsaws and providing more reliable trade entries and exits.
- Comprehensive Visualizations & Dashboard :
- Composite Oscillator & Dynamic Thresholds : The oscillator is plotted with dynamic upper and lower thresholds, and the area between them is filled with a color that reflects the active trading signal (e.g., Strong Buy, Early Sell).
- Signal Markers : Both immediate (non-latching) and stored (latched) signals are marked on the chart with distinct shapes (circles, crosses, triangles, and diamonds) to differentiate between signal types.
- Real-Time Dashboard : A customizable dashboard table displays key metrics including ADX, oscillator value, chosen momentum mode, HMA trend, higher timeframe trend, volume factor, AI bias (if enabled), and more, allowing traders to quickly assess market conditions at a glance.
How to Use :
1. S ignal Interpretation :
- Immediate Signals : For traders who prefer quick entries, the indicator displays immediate signals such as “Strong Buy” or “Early Sell” based on the current market snapshot.
- Latched Signals : When latching is enabled, the indicator holds a signal state until a clear reversal is confirmed, offering sustained trade setups.
2. Trend Confirmation :
- Use the HMA trend indicator and the optional higher timeframe trend filter to confirm the prevailing market direction before acting on signals.
3. Dynamic Thresholds & AI Forecasting :
- Monitor the dynamically adjusted oscillator thresholds and, if enabled, the AI bias to gauge potential shifts in market momentum.
4. Risk Management :
- Combine these signals with additional analysis and sound risk management practices to determine optimal entry and exit points for scalping trades.
Disclaimer :
This script is provided for educational and informational purposes only and does not constitute financial advice. Trading involves risk, and past performance is not indicative of future results. Always perform your own analysis and use proper risk management strategies before trading.

Destroyer LifeDestroyer Life Strategy - High-Frequency Long & Short Trading
Overview:
The Destroyer Life strategy is an advanced cryptocurrency trading algorithm designed for high-frequency execution on the 15-second timeframe. It combines CRT (Candle Range Trend) and Turtle Soup trading logic with multi-timeframe analysis to optimize entries and exits for both long and short trades. This strategy is specifically optimized for high-volatility crypto pairs, such as SOL/USD on MEXC, ensuring precise execution with minimal drawdown.
Key Features:
15-Second Timeframe Execution: Optimized for ultra-short-term trading.
Long & Short Strategy: Simultaneously identifies profitable buy and sell opportunities.
CRT & Turtle Soup Logic: Leverages price action patterns for enhanced trade accuracy.
Higher Timeframe Analysis (HTF): Incorporates liquidity zones, fair value gaps (FVG), and breaker blocks for context-aware trading.
Dynamic Position Sizing: Uses an adjustable leverage multiplier for risk-controlled trade sizing.
Commission Optimization: Ensures profitability even with trading fees.
Strict Risk Management: Implements exit conditions based on liquidity structure and trend reversals.
Strategy Performance (Backtested on SOL/USD - MEXC):
Overall Profitability: ~80% win rate in backtesting.
Net Profit: $3,151.12 (6.30% ROI).
Gross Profit: $3,795.68 (7.59%).
Gross Loss: $644.56 (1.29%).
Long Trades Profit: $1,459.05 (2.92%).
Short Trades Profit: $1,692.07 (3.38%).
Commission Paid: $924.82.
Minimum Trade Holding Period: 1-minute cooldown between trades.
Trading Logic:
Entry Conditions:
Long Trades: Triggered when the price enters a liquidity void and aligns with higher timeframe bullish bias.
Short Trades: Triggered when price approaches a resistance level with bearish higher timeframe confluence.
CRT & Turtle Soup Patterns: Identifies reversals by analyzing breakout and fake-out structures.
Exit Conditions:
Long Positions Close: Upon price exceeding a 3.88% profit threshold or reversing below an HTF structure.
Short Positions Close: Upon reaching a similar 3.88% threshold or showing strong bullish signals.
Dynamic Position Sizing:
Uses a leverage-based calculation that adapts trade size based on volatility.
Liquidity Awareness:
Tracks Mitigation Blocks (MB), Fair Value Gaps (FVG), Buy/Sell-Side Liquidity (BSL/SSL) to determine optimal execution.
Best Use Cases:
Scalpers & High-Frequency Traders: Those looking for rapid trade execution with short holding periods.
Crypto Traders Focused on Low Timeframes: Optimized for 15-second price action.
Traders Utilizing Liquidity Concepts: Built to exploit liquidity traps and inefficiencies.
Risks & Considerations:
High-Frequency Execution Requires Low Latency: Ensure your broker or exchange supports fast order execution.
Backtested Results May Vary: Real-time performance depends on market conditions.
Commission & Fees Impact Profits: Consider exchanges with low fees to maximize strategy efficiency.
Final Thoughts:
The Destroyer Life Strategy is designed for serious traders looking to take advantage of high-volatility markets with a structured, liquidity-based approach. By combining price action, liquidity concepts, and adaptive risk management, it provides a solid framework for executing high-probability trades on crypto markets.
🚀 Ready to take your trading to the next level? Try Destroyer Life today and dominate the markets!

HilalimSBHilalimSB A Wedding Gift 🌙
HilalimSB - Revealing the Secrets of the Trend
HilalimSB is a powerful indicator designed to help investors analyze market trends and optimize trading strategies. Designed to uncover the secrets at the heart of the trend, HilalimSB stands out with its unique features and impressive algorithm.
Hilalim Algorithm and Fixed ATR Value:
HilalimSB is equipped with a special algorithm called "Hilalim" to detect market trends. This algorithm can delve into the depths of price movements to determine the direction of the trend and provide users with the ability to predict future price movements. Additionally, HilalimSB uses its own fixed Average True Range (ATR) value. ATR is an indicator that measures price movement volatility and is often used to determine the strength of a trend. The fixed ATR value of HilalimSB has been tested over long periods and its reliability has been proven. This allows users to interpret the signals provided by the indicator more reliably.
ATR Calculation Steps
1.True Range Calculation:
+ The True Range (TR) is the greatest of the following three values:
1. Current high minus current low
2. Current high minus previous close (absolute value)
3. Current low minus previous close (absolute value)
2.Average True Range (ATR) Calculation:
-The initial ATR value is calculated as the average of the TR values over a specified period
(typically 14 periods).
-For subsequent periods, the ATR is calculated using the following formula:
ATRt=(ATRt−1×(n−1)+TRt)/n
Where:
+ ATRt is the ATR for the current period,
+ ATRt−1 is the ATR for the previous period,
+ TRt is the True Range for the current period,
+ n is the number of periods.
Pine Script to Calculate ATR with User-Defined Length and Multiplier
Here is the Pine Script code for calculating the ATR with user-defined X length and Y multiplier:
//@version=5
indicator("Custom ATR", overlay=false)
// User-defined inputs
X = input.int(14, minval=1, title="ATR Period (X)")
Y = input.float(1.0, title="ATR Multiplier (Y)")
// True Range calculation
TR1 = high - low
TR2 = math.abs(high - close )
TR3 = math.abs(low - close )
TR = math.max(TR1, math.max(TR2, TR3))
// ATR calculation
ATR = ta.rma(TR, X)
// Apply multiplier
customATR = ATR * Y
// Plot the ATR value
plot(customATR, title="Custom ATR", color=color.blue, linewidth=2)
This code can be added as a new Pine Script indicator in TradingView, allowing users to calculate and display the ATR on the chart according to their specified parameters.
HilalimSB's Distinction from Other ATR Indicators
HilalimSB emerges with its unique Average True Range (ATR) value, presenting itself to users. Equipped with a proprietary ATR algorithm, this indicator is released in a non-editable form for users. After meticulous testing across various instruments with predetermined period and multiplier values, it is made available for use.
ATR is acknowledged as a critical calculation tool in the financial sector. The ATR calculation process of HilalimSB is conducted as a result of various research efforts and concrete data-based computations. Therefore, the HilalimSB indicator is published with its proprietary ATR values, unavailable for modification.
The ATR period and multiplier values provided by HilalimSB constitute the fundamental logic of a trading strategy. This unique feature aids investors in making informed decisions.
Visual Aesthetics and Clear Charts:
HilalimSB provides a user-friendly interface with clear and impressive graphics. Trend changes are highlighted with vibrant colors and are visually easy to understand. You can choose colors based on eye comfort, allowing you to personalize your trading screen for a more enjoyable experience. While offering a flexible approach tailored to users' needs, HilalimSB also promises an aesthetic and professional experience.
Strong Signals and Buy/Sell Indicators:
After completing test operations, HilalimSB produces data at various time intervals. However, we would like to emphasize to users that based on our studies, it provides the best signals in 1-hour chart data. HilalimSB produces strong signals to identify trend reversals. Buy or sell points are clearly indicated, allowing users to develop and implement trading strategies based on these signals.
For example, let's imagine you wanted to open a position on BTC on 2023.11.02. You are aware that you need to calculate which of the buying or selling transactions would be more profitable. You need support from various indicators to open a position. Based on the analysis and calculations it has made from the data it contains, HilalimSB would have detected that the graph is more suitable for a selling position, and by producing a sell signal at the most ideal selling point at 08:00 on 2023.11.02 (UTC+3 Istanbul), it would have informed you of the direction the graph would follow, allowing you to benefit positively from a 2.56% decline.
Technology and Innovation:
HilalimSB aims to enhance the trading experience using the latest technology. With its innovative approach, it enables users to discover market opportunities and support their decisions. Thus, investors can make more informed and successful trades. Real-Time Data Analysis: HilalimSB analyzes market data in real-time and identifies updated trends instantly. This allows users to make more informed trading decisions by staying informed of the latest market developments. Continuous Update and Improvement: HilalimSB is constantly updated and improved. New features are added and existing ones are enhanced based on user feedback and market changes. Thus, HilalimSB always aims to provide the latest technology and the best user experience.
Social Order and Intrinsic Motivation:
Negative trends such as widespread illegal gambling and uncontrolled risk-taking can have adverse financial effects on society. The primary goal of HilalimSB is to counteract these negative trends by guiding and encouraging users with data-driven analysis and calculable investment systems. This allows investors to trade more consciously and safely.

BladeSCALPER by MetaSignalsProBladeSCALPER
The sharpest tool to scalp M and W patterns
--------------------------------------------------------------------------
✔️ Get a clear signal of the next probable reversal move
✔️ Get instantly the zone where the price will probably get attracted to
✔️ Adjust TP1/TP2/TP3 accordingly to the PowerZONES
✔️ Check the winning rate of the M & W patterns on a time period
✔️ Optimize the probability of success of the M & W patterns
---------------------------------------------------------------------------
📌 For who?
---------------
Initialy, scalping is based on small moves, supposedly more predictable than big ones and repeating this operation many times.
For that, scalping means usally daytrading and not everybody can/want to be a daytrader: managing one's emotions is just critical;
But you can also use this indicator on a bigger time frame and trade when you want the M & Ws!
So basicaly BladeSCALPER is for anybody who wants to trade succesfully M&W patterns whatever Timeframe, whatever asset!
📌 For which asset?
-------------------------
BladeSCALPER is universal and works fine on all assets and all time-frames;
📌Why we made these innovations?
--------------------------------------------
"Double Tops" and "Double Bottoms", commonely called "M" and "W" as the letter explicitely shows these patterns, are some of the most predictive patterns you can find.
To exploit them, we needed to have an all in one tool:
◾ a very sharp scalping and innovative tool with embed statistics
◾ identify Risk/Reward ratio for TakeProfits
◾ and advanced Supports and Resistances information i.e the PowerZONES
📌 How to trade with BladeSCALPER ?
-----------------------------------------------
🔹 ScalpUP / ScalpDOWN Signals
The signals are given when the patterns of M and W are identified, in real time and do not repaint.
☝️ Quite often the Market will test the bottoms and the tops before validating such a figure;
👉 Only enter the trade when the candle closes clearly inside the coloured zone and not immediately on the signal.
🔹 PowerZONES
We innovated on the basic Supports and Resistances concept by adding new features with:
◾ zones that correspond better to real life trading than lines
◾ zones that change color depending of their position vs price : they turn red is the price is below them and blue if they are above.
◾ strength / attractivity of these zones = how many times the Support/Resistance have been touched in the past that will magnetize the price
◾ and distance between these zones to give a clear picture
Importance of the PowerZONES
In the current version, the TPs do not adjust to the PowerZONES, precisely to be able to keep a global statistical view;
☝️ But when you plan to trade on a signal, the real relevance is to adjust them according to the PowerZONES, of course;
👉 When buying, place your TPs just below the consecutive PowerZONES that the price could test
👉 When selling, place them just above the consecutive PowerZONES
🔹 TP1/TP2/TP3
TakeProfits are set theoretically and based on 3 risk/reward ratios: 1 / 1.5 / 2 ;
But of course this is just a setting to get an overall view of the effectiveness of the pattern on the current asset;
if you change these settings, you'll see that the Stats change accordingly.
☝️ Again, when you plan to trade on a signal, the real relevance is to adjust them according to the PowerZONES, of course;
🔹 StatsPANEL
With this innovative feature you can now see immediately
◾ the probability of win, based on the past patterns
◾ the exacts number of trades that have reached the TP1/TP2/TP3
◾ and more importantly the gains made by these trades in pips
We introduce also 2 important possibilities to improve the precision and relience of BladeSCALPER
◾ the PatternFACTOR can be changed; it defines a key percentage of the M & W patterns
◾ the MoveringAverageFILTER can be activated to
◽ suppress M patterns when the price is below the selected MovingAverage
◽ suppress W patterns when the price is over the selected MovingAverage
👉 Modifying these variables will change immediately the statistics just like the position of the TP1/TP2/TP3 and HistoryMax variables.
📌 Importance of setting up a Multi TimeFrame and doing a trend analysis
------------------------------------------------------------------------------------------
Even if you are on a scalping mode, it is crucial you set up a Multi Time Frame workspace and that you conduct a trend analysis before entering the market.
If you don't, you won't maximize your chances;
No indicator is 100% reliable, because the market cannot be modelized; anyone who tells you otherwise is lying to your face;
However, a statistical approach to the market is possible, because agents are not incoherent.
This is the meaning of stats we apply on double tops and double bottoms;
But to reinforce this point, you need to know what's happening on the next higher time unit to get a global view.
To do this, it's important to do a trend analysis or have a trend analysis tool.
---------------------------------------------------------------------------------------------------
🎛️ Configuration
----------------------
◾ Buy/Sell Signals: choose if you want to see only W or only M pattern signals
◾ PowerZones: uncheck if you don't want to see them (not recommanded)
◾ RewardBoxText: uncheck if you don't want to see the words "Entry, TP1, TP2, TP3"
◾ TakeProfit1/TakeProfit2/TakeProfit3: by default correspond to the multiple of the risk zone in grey under/above "Entry" i.e it is the classic concept of Risk/Reward ratio
◾ PowerZoneTouch: sets the number of time the zone has been touched
◾ PowerZoneDensity: increase this number if you want the number of zones to increase and reversely
◾ RewardBoxLength: adjust the standard number to the length of the anticipated move in duration
◾ StopLossExtraPoints: for a W pattern (ScalpUP) will bring lower the lower border of the RewardBOX; in a M pattern (ScalpDOWN) will bring higher the higher border of the RewardBOX; it will automatically move the distance of the TP1/TP2/TP3
◾ HistoryMax: the number of units taken into account to set the PowerZONES and the past M & W patterns
◾ PatternFactor: defines a key percentage of the M & W patterns
◾ MovingAverageFilter:
◽ untick (by default) : the filter is OFF
◽ ticked : the filter is ON
◾ MovingAveragePeriod: choose the speed of the average
◾ MovingAverageType: choose among all the types of averages available
◾ Applied to: define on which available moment of the Price the average is applied (close, open, highest...)
🛠️ Calculation & Precisions
------------------------------------
🔹 TP1/TP2/TP3
the 3 risk/reward ratios: 1 / 1.5 / 2 are multiples of the height of the grey zone = distance between your StopLoss and the entry line;
🔹 %WIN
Note that the % of success (%WIN) must be entered correctly;
Your risk/reward ratio is key and more important than the % success of the signal; you can have a % success of 30% (%WIN) which creates more points earned than a % success of 60% depending on your risk/reward ratio = the position of your TPs;
🔹 Calculation of points/pips
These are full points and we don't calculate partial outputs.
So if you have a tp1 at 20 and a tp2 at 100, if you get to tp2 you get 100 and not 20+100.
Stoplosses are of course calculated in negative.
🔹 PowerZONES
The originality of our concept is to test how many times a zone has been touched
The more the market has touched this zone the more probable it becomes a strategic zone where the liquidity will accumulate and thus will be chased!
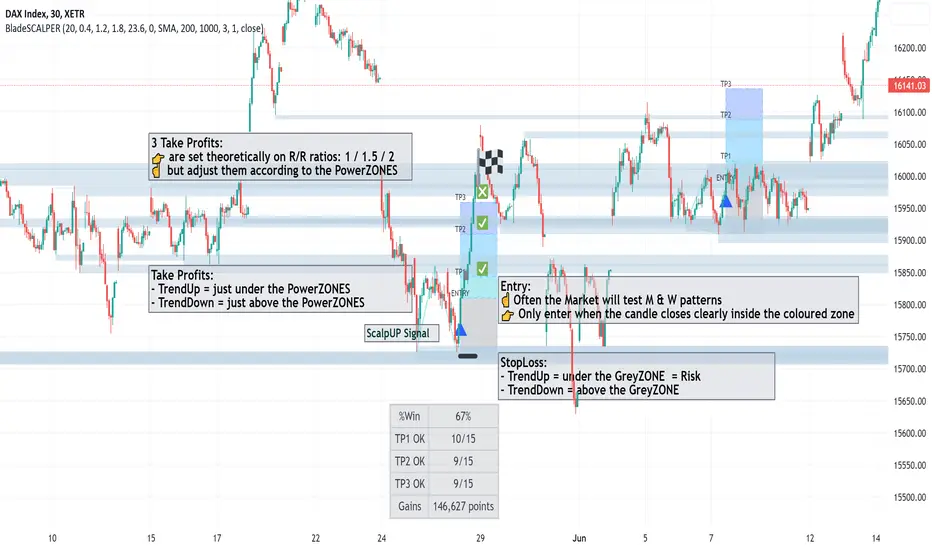
BB_MDL_V1Simple indicator that is based on the average line of the bollinger bands and the exponential average of 200 periods.
The customizable variable is bollinger bands length, currently the default is 35, you can tweak it to your liking and see how trend identification changes.
My recommendation is to work in 5-minute time frames in values such as SOL, FTM or MASK (cryptos)
This simple strategy can be combined with many others to gain more insight and get better market entries and exits.

Short Only Anytime ScalperThis indicator works best in a 2-minute timeframe.
I designed this indicator to work with my proprietary scalping strategy where I use candlestick anatomy, price action, and moving averages to determine potential short entries.
Rules I use for using this indicator:
- I turn the 20MA green
- I turn the 200MA red
- I only take a short entry on the FIRST yellow or red candle painted once the 20MA comes back down crossing the 200MA once the candle fully closes red or yellow from the indicator
- The gap between the 20MA and the 200MA MUST be close (the closer the gap is the stronger the short entry can be). Note: It can be considered a false signal if the bar is colored yellow or red when the gap is far within the 20MA and the 200MA.
- My stop loss is the red line right on the top of the True Bear Bar (red) or Partial True bear bar (yellow)
- My take profit is always at 0.04% (green dots) and then I watch price action, when price action moves under my 0.04% I quickly move to stop loss to that level locking in profit while allowing profit to ride. (This indicator is meant to use in quick price action and I am usually in and out of a trade in 5 minutes or even sooner)
How to read the indicator
- Yellow painted bar at candle close: Partial True Bear Bar
- Red painted bar at candle close: True Bear Bar
- Red line painted on top of candle: Stop loss
- Green dot with green label and price: Goal profit area no matter what
You will notice that sometimes depending on the size of the bear bar, the R:R is very off compared to traditional trading, this is because this is a very quick scalping strategy that either locks in 0.04% no leverage gain or quickly puts stop loss at that level to then let profits ride.

Futures SignalThis is a Futures Signal Indictor works using support & resistance and market trend, it is designed for all type of markets (crypto, forex, stock etc.) and works on all commonly used timeframes (preferably on 5 Min, 15 Min Candles).
How it works Futures Signal Indictor :
Core logic behind this indicator is to finding the Support and Resistance , we find the Lower High (LH) and Higher Low (HL) to find the from where the price reversed (bounced back) and also we use a custom logic for figuring out the peak price in the last few candles. Based on the multiple previous Support and Resistance (HH, HL, LL LH) we calculate a price level, this price level is used a major a factor for entering the trade. Once we have the price level we check if the current price crosses that price level, if it crossed then we consider that as a long/short entry (based on whether it crosses resistance or support line that we calculated). Once we have pre long/short signals we further filter it based on the market trend to prevent too early/late signals. Along with this if we don't see a clear trend we do the filtering by checking how many support or resistance level the price has bounced off.
Stop Loss and Take Profit: We have also added printing SL and TP levels on the chart to make the it easier for everyone to find the SL/TP values. Script calculates the SL value by checking the previous support level for LONG trade and previous resistance level for SHORT trades. Take profit are calculated in 0.5 ratio as of now.

Z.A.H.It's a scalping script, which can be used using Heikin Ashi candle on 5min time frame (I personally use it for BINANCE:BTCUSDT and BINANCE:ETHUSDT scalping).
We've tried to include SL and target (1.5R and 2R) in this as well, and it works well but sometimes (please note SOMETIMES..SOMETIMES, it can be few..few pips here and there)
Idea is simple, you take the trade based on the signal given by the script and place your SL as per the script and then target 1.5R for 80% of your position and 20% for the remaining 20% of your position.
One extra thing which I've found useful is, you can use Awesome Oscillator (default setting) as well for placing SLs. If you use this method for placing SL, then just place your SL at the last green awesome oscillator candle for shorts and at the last red awesome oscillator candle for longs. From there target 1.5R and 2R.
Overall results are same for either, so you can use it as per your convenience. For any query, you can send me a DM on discord or twitter.
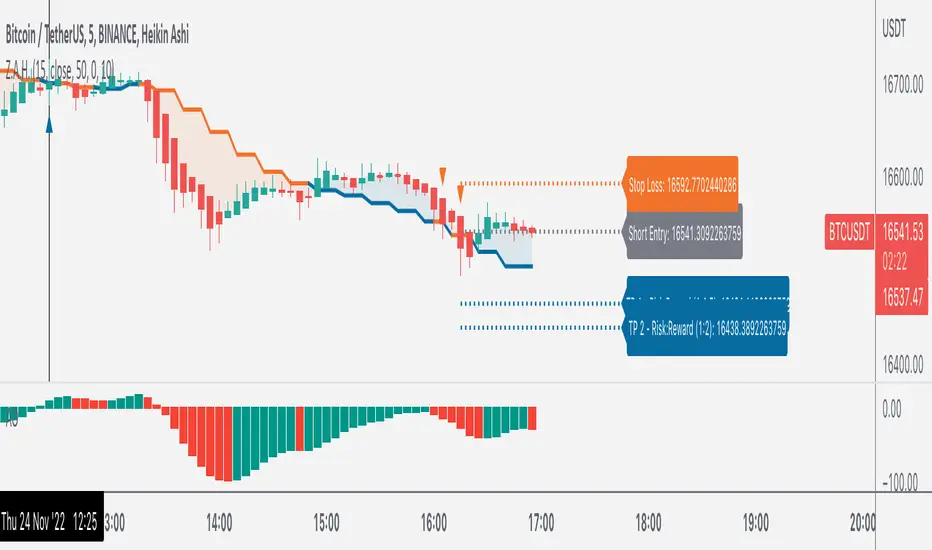
Volume and Trend reversal scalping scriptThe Vtrend X script allows for both trend based and scalping trading entries, it gives you all the trend and reversal information at hand that is necessary. It works best in a trending market.
The fundamental part of the script, is the volume weighted bands in blue and red, which help determine the trend and dynamic support and resistance . The blue band is a shorter length than the red band.
When the blue band dips below the red band, this tells us there is a downtrend. And when the blue band is trending above the red band, this is bullish uptrend price action. You will be able to note price whatever the timeframe really respects these bands, and you can use that to your advantage flicking through the high and low timeframes on where price will go next, combined with your own support and resistance levels.
Combined with the candle colors, which change whether they close above or below the main trend colored line (shown below), help identify a change in price action and trend. This allows for low timeframe plays also.
The uptrend and downtrend cicle signals are shown in a few different colors. Green and red are with the trend and have met all conditions. Orange and purple are against the trend calculations, and Olive circles risky trades against all the filters used to calculate signals.
The reversal signals, are the diamond plots in black, These also represent take profit areas as well.
Another key feature is the Daily / Weekly / Monthly and Yearly open levels displayed as colored dots. A lot of the plays i take use the Daily opens as key levels to take a trade off.
The indicator is designed to give you key information, but be quite customisable as well to suit your exact trading style.
Recommended timeframes i use for this script; Weekly (for key liquidity areas), Trading on the Daily, 6h, 4h, 2h, 1h and 25 minutes.
Backtested Settings and Pairs;
Pair - Timeframe - Signals Inputs - Reversal Inputs - ATR Multiplier - MA Filter
BTCUSD - 1 hr - 3 - 2.8 - 5.5 - NA
ETHUSD - 1 hr - 4 - 2.8 - 5.5 - NA
USDCAD - 1 hr - 4 - 2.8 - 5.5 - NA
GBPUSD - 1 hr - 4 - 2.8 - 5.5 - NA
US30 - 1 hr - 4 - 2.8 - 5.5 - NA
BTCUSD - 4 hr - 2.5 - 2.5 - 3.5 - NA
BTCUSD - 25 mins - 5 - 2.5 - 5.5 - NA