Engulfing Pattern Alerts By PropFirm AlgoWe have now decided to make this indicator to support the trading community! If you find yourself struggling to identify bullish engulfing and bearish engulfing candles, this one is for you.
Release Notes:
Initial release with robust detection of bullish and bearish engulfing patterns.
Added trend and volume filters for enhanced pattern accuracy.
Custom alerts for real-time notifications of potential trading opportunities.
Appendix 1 - Example Case of Use For Educational Study.
Appendix 2 - Technical description which focuses on explaining the functionality of the script, how the code works, and how it can be used by traders, providing further immediate insight value.
Appendix 1:
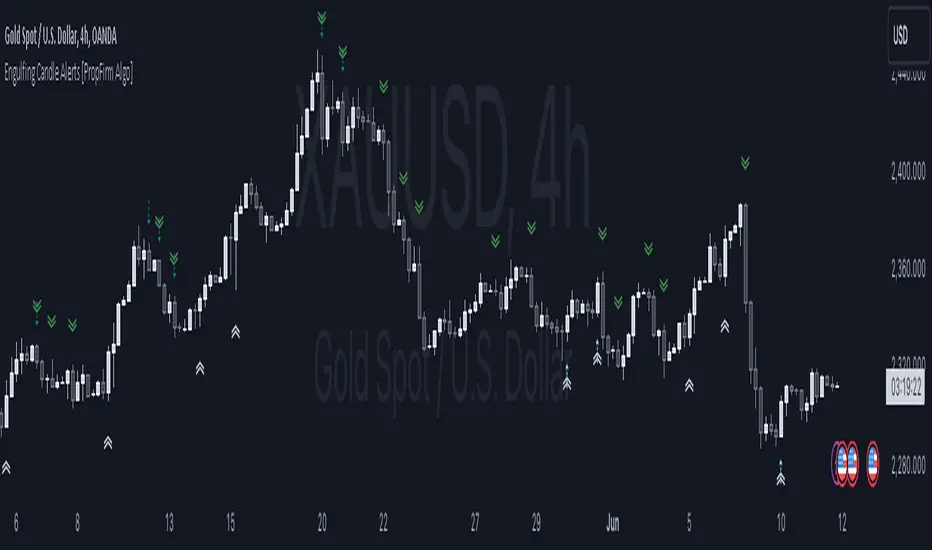
This indicator will provide you with Two types Bullish and Bearish Engulfing Alerts.
The Regular Bullish and Bearish Engulfing Candle's Shown As
Bullish Engulfing ︽
Bearish Engulfing ︾
And the Filtered Bullish and Bearish Engulfing Candle Shown As
Filtered Bullish Engulfing ⇡
Filtered Bearish Engulfing ⇣
You can also change the Alert Symbol to any text, symbol or emoji of choice in the Setting Style Panel . This allows you to customize the alert symbol style to your liking, Example....
Using the power of artificial intelligence, we coded this indicator based on technical descriptions to perfect this simple problem.
Use this tool together with different strategies as a confirmation to your trading bias.
Use Supply and Demand Zones together with the Engulfing Pattern Alerts
First, Verify if the bullish engulfing candle is at the end of a dying trend.
Secondly, Check if it’s at a major 1-hour, 4-hour, or daily support and resistance zone.
Then wait for the retest, then enter a position.
DON’T USE THE ENGULFING ALERT AS A POINT OF ENTRY, OR WHILE MARKETS ARE CONSOLIDATING nor in the middle of an active trend.
Now for the second most used method:
Use The Fibonacci together with the Engulfing Pattern Alerts
First, Identify an impulse candle that creates a new trend in the market.
Then Draw out your Fibonacci tool from the start of the candle to the end of the impulse leg where rejection is shown.
Wait for the price to retrace to the 61.8 retracement and use the engulfing candle as a second confirmation.
And lastly, wait for the price to retest the fib level showing signs of rejection, then enter.
Appendix 2:
Technical Description:
The "Engulfing Pattern Alerts By PropFirm Algo" script is a sophisticated tool designed to identify and alert traders of potential bullish and bearish engulfing patterns in the market, enhanced by trend and volume filters for improved accuracy. This script helps traders spot potential trend reversals by analyzing candlestick patterns in conjunction with volume data and moving averages.
Key Features:
Bullish Engulfing Pattern Detection: Identifies when a smaller bearish candle is followed by a larger bullish candle, indicating potential upward price movement.
Bearish Engulfing Pattern Detection: Identifies when a smaller bullish candle is followed by a larger bearish candle, indicating potential downward price movement.
Volume Filter: Enhances pattern reliability by ensuring the identified pattern is accompanied by a significant volume increase.
Trend Filter: Utilizes Simple Moving Averages (SMA) to filter patterns based on the prevailing market trend, reducing false signals on the "Filtered Engulfing Alerts" Setting.
Custom Alerts: Configurable alerts for both bullish and bearish engulfing patterns, allowing traders to stay informed in real-time.
How It Works:
Bullish Engulfing Pattern:
Detected when the body of the current candle completely engulfs the body of the previous candle.
Confirmed if the current candle closes higher than it opens, and the previous candle closes lower than it opens.
Volume on the current candle must be greater than the previous candle.
Bearish Engulfing Pattern:
Detected when the body of the current candle completely engulfs the body of the previous candle.
Confirmed if the current candle closes lower than it opens, and the previous candle closes higher than it opens.
Volume on the current candle must be greater than the previous candle.
Trend Filter:
Uses moving averages to determine the market trend.
Bullish patterns are only considered in downtrends.
Bearish patterns are only considered in uptrends.
Alerts:
Alerts can be set up for both bullish and bearish patterns, ensuring you are notified when significant market movements are detected.
How to Use:
Add the script to your chart.
Configure the alert settings according to your trading preferences.
Monitor your chart for plotted symbols indicating potential bullish (︽) and bearish (︾) engulfing patterns.
Utilize the alert conditions to get notified when these patterns occur.
Cari dalam skrip untuk "alert"
RSI Divergence AlertsIndicator Description: RSI Divergence Alerts
The RSI Divergence indicator is a technical analysis tool that identifies divergences between the Relative Strength Index (RSI) and the price of an asset. The RSI is a momentum indicator that measures the speed and magnitude of recent changes in an asset's price, while divergences occur when there is a disparity between price movements and the RSI.
Indicator Customization:
Overbought and Oversold: The indicator allows you to customize the overbought and oversold levels of the RSI. This allows traders to adjust parameters according to their preferences and the historical behavior of the asset in question.
Indicator Settings and Recommended Adjustments:
Max Bar Distance: This parameter determines the maximum distance allowed between two low or high points for a divergence to be recognized. A higher value may result in more signals, but may also increase the number of false signals. It is recommended to adjust this value based on the volatility of the asset and the time period in which it is being traded.
RSI Length: This is the time period used to calculate the RSI. A longer period smoothes the indicator, while a shorter period makes it more sensitive to price changes. The default value is 14, but traders can adjust it based on their trading strategy and the asset's volatility.
RSI Overbought and Oversold: These values determine the levels at which the RSI is considered overbought and oversold, respectively. The default value for overbought is 75 and for oversold is 35. Traders can adjust these values according to the asset's volatility and its historical analysis. For example, in more volatile assets, it may be useful to use more extreme levels, such as 80 for overbought and 20 for oversold.
When adjusting indicator settings, traders must consider the balance between sensitivity and accuracy. Careful tuning of these parameters can help filter out false signals and identify more reliable trading opportunities.
The alerts functionality in this RSI Divergence indicator is designed to notify traders when a bearish divergence or a bullish divergence is detected. Here's how it works:
Conditionally Triggered Alerts:
Alerts are triggered based on the boolean variables bearishDivergence and bullishDivergence.
If bearishDivergence is true, it indicates that a bearish divergence has been detected.
If bullishDivergence is true, it indicates that a bullish divergence has been detected.
Alert Message:
When a divergence is detected, an alert message is generated to inform the trader about the event.
The message includes details about the divergence, such as the difference in the RSI value between the two points forming the divergence.
For example, for a bearish divergence, the message will include the phrase "Bearish RSI Divergence Detected" and the RSI difference between the high and low points of the divergence.
Alert Frequency:
Alerts are configured to be triggered once per bar close (alert.freq_once_per_bar_close), which means the alert will only be sent once at the close of each bar.
This helps to avoid multiple alerts for the same divergence during the same time period.
Additional Alert Conditions:
In addition to conditionally triggered alert messages, alert conditions are defined for both bearish and bullish divergences.
These alert conditions are useful for configuring custom alerts on trading platforms that support running Pine Script code.
Overall, this alert functionality allows traders to stay informed about potential trading opportunities based on divergences detected by the indicator. This can help traders make faster and more informed decisions in their trading processes.

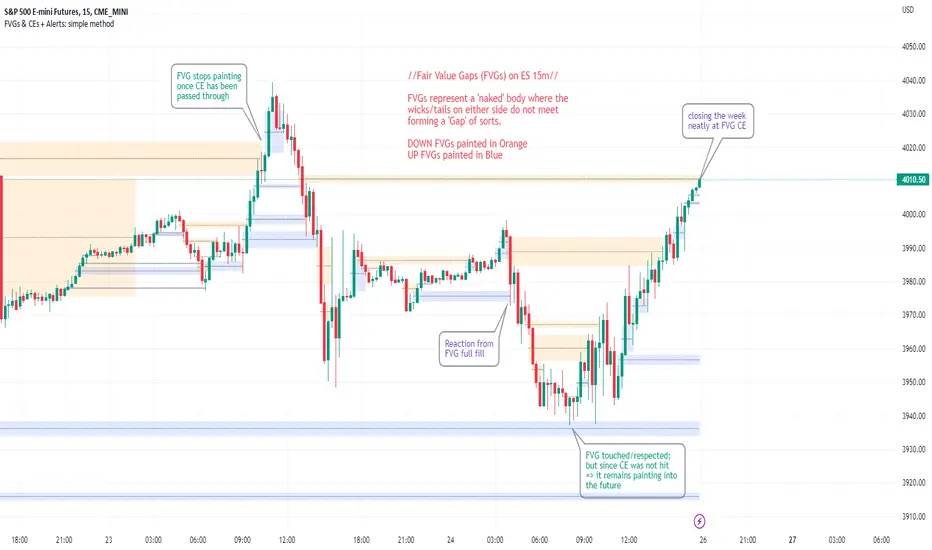
FVGs & CEs + Alerts: simple & efficient methodFair Value Gap indicator: Paints FVGs and their midlines (CEs). Stops painting when CE is hit, or when fully filled; user choice of threshold. This threshold is also used in the Alert conditions.
~~Plotted here on ES1! (CME), on the 15m timeframe~~
-A FVG represents a 'naked' body where the wicks/tails on either side do not meet. This can be seen as a type of 'gap', which price will have a tendency to want to re-fill (in part or in full).
-The midline (CE, or 'Consequent encroachment') of FVGs also tend to show price sensitivity.
-This indicator paints all FVGs until priced into, and should give an idea of which are more meaningful and which are best ignored (based on context: location, Time of day, market structure, etc).
-This is a simpler and more efficient method of painting Fair value gaps which auto-stop painting when price reaches them.
//Aims of Publishing:
-Education of ICT concepts of Fair Value Gaps and their midlines (CEs): To easily see via forward testing or backtesting, the sensitivity that price shows to these areas & levels.
-Demonstration of a much more efficient way of plotting FVGs which terminate at price, thanks to a modification of @Bjorgums's clever looping method referenced below.
//Settings:
-Toggle on/off upward and downward FVGs independently(blue and orange by default).
-Toggle on/off midline (CE).
-Standard color/line formatting options.
-Choose Threshold: CE of FVG or Full Fill of FVG: This will determine both the 'stop-painting' trigger and the 'Alert' trigger.
-Choose number of days lookback to control how many historical FVGs paint on chart.
//On alerts:
-Simple choice of 2 alerts:
~~One for price crossing into/above the nearest untouched 'premium' FVG above ( orange ). Trigger is user choice of CE or full fill.
~~Another for price crossing into/below the nearest untouched 'discount' FVG below (blue). Trigger is user choice of CE or full fill.
-Alerts set via the three dots in indicator status line.
//Cautionary notes:
-Do not use the alerts blindly to find trades. Wait until you have identified a good FVG above/below which you think price may show sensitivity to
-Usage on very low timeframes can cause unexpected results with alerts: due to new FVGs forming in realtime the Alert will always trigger at the most recent FVG above/ below having its threshold hit.
-Big thank you to @Bjorgum for his fantastic extendAndRemove method. Modified here for use with boxes and to integrate Alerts.
-Also Credit to ICT (inner circle trader) for the concepts used here: Fair value gaps and their Consequent Encroachment (CE).
3XCROSS ALERTSThis is an alert indicator for 3XCROSS STRATEGY_V-CRYPTO .
HOW TO USE
Use it with the strategy and receive alerts in your tradingview platform.
1. Click alerts button on the right top.
2. Click create alert and choose long, short or cross in Condition menu.
3. Choose how often you want to receive the alerts.
If you have paid subscription you can use multiple alerts. For example for long and short signals separately.
But if you are using free subsctiption, you can create only one alert.
In this case you should use cross alert. And you will receive an alert all the time when EMAs cross up or down,
signalling for long or short.
Use it carefully and leave your feedback.

ATR Volatility AlertsOverview:
This is a dynamic alert tool based on the Average True Range (ATR), designed to help traders detect sudden price movements that exceed normal volatility levels. Whether you are trading breakouts or monitoring for abnormal spikes, this indicator visualizes these events on the chart and triggers system alerts when the price move exceeds your specified ATR multiplier.
Key Features:
Fully Customizable ATR Range:
You can adjust the ATR Length (Default: 14) and the Multiplier (Default: 1.5x).
Tip: Increase the multiplier (e.g., to 2.0 or 3.0) to catch only extreme volatility, or lower it for scalping smaller moves.
Visual Chart Signals:
Visual markers appear instantly when a bar's movement exceeds the ATR threshold.
Green Triangle: Indicates an Upward Spike.
Red Triangle: Indicates a Downward Spike.
Flexible System Alerts:
Designed to integrate seamlessly with TradingView's alert system. You can choose from three specific alert directions based on your strategy:
1.Price Spike Up: Triggers only on sharp upward moves.
2.Price Spike Down: Triggers only on sharp downward moves.
3.Bidirectional Volatility Alert: Triggers on BOTH huge pumps and dumps.
How to Set Alerts:
Click the "Create Alert" button in TradingView.
Select ATR Volatility Alerts in the "Condition" dropdown.
Choose the specific logic you need:
· Select Price Spike Up for bullish monitoring.
· Select Price Spike Down for bearish monitoring.
· Select Bidirectional Volatility Alert to watch for any volatility expansion.

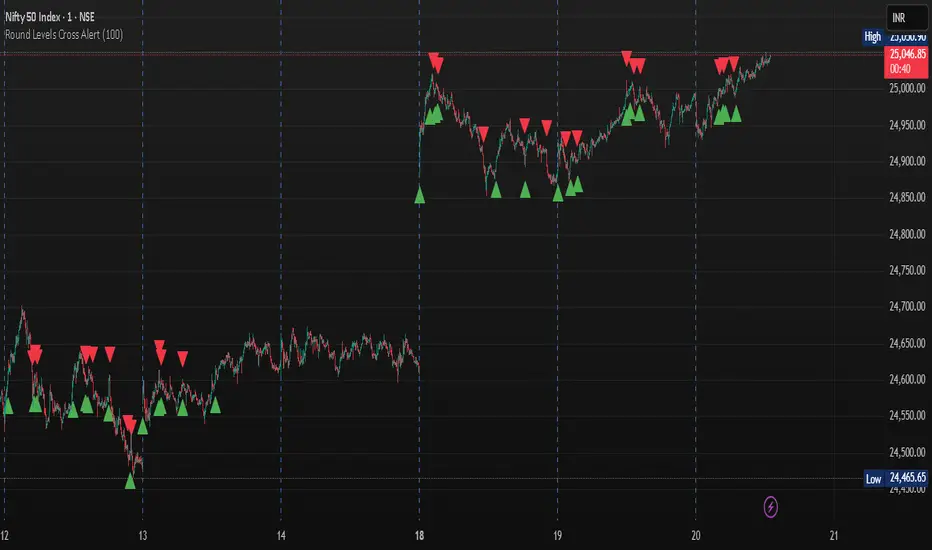
Round Levels Cross AlertRound Levels Cross Alert
Overview
The Round Levels Cross Alert is a Pine Script v6 indicator for TradingView that detects when the price crosses user-defined round price levels (e.g., 100, 200, 500). It is designed for traders focusing on psychological or key support/resistance levels, providing clear visual markers and real-time alerts with detailed messages.
Features
Custom Round Levels: Set your preferred price interval (e.g., 100 points) using the Round Level Interval input.
Visual Cues: Green triangle-up shapes appear below bars for upward crosses; red triangle-down shapes appear above for downward crosses.
Detailed Alerts: Alerts include the ticker, crossed level, and time in HH:mm AM/PM format, triggered only on confirmed bars for accuracy.
Multi-Level Detection: Captures multiple round-level crosses in a single bar, sending individual alerts for each.
User-Friendly: Easy to set up and integrates with TradingView's alert system for notifications via email, SMS, or other platforms.
How It Works
The script calculates the nearest round level by flooring the closing price divided by the user-defined interval. It detects changes in this level to identify crosses, then:
Plots a shape to visually mark the cross.
Generates an alert with the ticker, crossed level, and current time.
Handles multiple level crosses in one bar, ensuring all are reported.
Ideal For
Swing Traders: Identify key levels for entries/exits.
Day Traders: Monitor real-time price action at round numbers.
Automated Alerts: Stay informed with timely notifications.
Customization
Adjust the Round Level Interval to match your asset or strategy (e.g., 50, 100, 1000).
Configure TradingView alerts to suit your notification preferences.
This indicator is a simple, effective tool for tracking price movements at significant round levels with clear visuals and actionable alerts.
Swing Points AlertSwing Points Alert with Adjustable Delay
Description:
This script is designed to detect and alert traders about significant swing highs and lows on the chart. The script is equipped with customizable pivot detection settings and an innovative **Alert Delay** mechanism, allowing users to fine-tune their notifications to reduce noise and focus on key price movements.
Key Features:
1. **Swing High/Low Detection:**
- Identifies swing highs and lows based on user-defined pivot length.
- Visualizes these points with customizable labels for clarity.
2. **Customizable Alerts:**
- Enables real-time alerts for swing highs and lows.
- Users can adjust the delay for alerts to avoid false signals during volatile periods.
3. **Dynamic Label Management:**
- Automatically manages the number of displayed swing point labels.
- Removes crossed or outdated labels based on user preferences.
4. **Flexible Label Styling:**
- Provides multiple label styles (e.g., triangles, circles, arrows) and color customization for both swing highs and lows.
How the Alert Delay Works:
The **Alert Delay** helps filter signals by introducing a delay before triggering alerts. The delay is calculated as follows:
**Alert Delay (%) x Time Frame = Alert Delay in Time Frame Units**
For example:
- If the **Alert Delay** is set to 30% and the timeframe is **15 minutes**, the alert will be triggered after a delay of:
\
This ensures the alert is triggered only if the swing high/low condition remains valid for at least 4.5 minutes.
Important Notes:
1. **Timeframe Sensitivity:**
- This script is optimized for use across various timeframes, but users must adjust the **Alert Delay** percentage to match their trading style and timeframe.
- For example, higher timeframes may require lower delay percentages for timely alerts.
2. **Customization Options:**
- Easily customize pivot detection length, alert delay, label styles, and colors to suit your preferences.
3. **Support:**
- If you encounter any challenges or need help optimizing the script for your specific trading scenario, feel free to reach out for assistance.
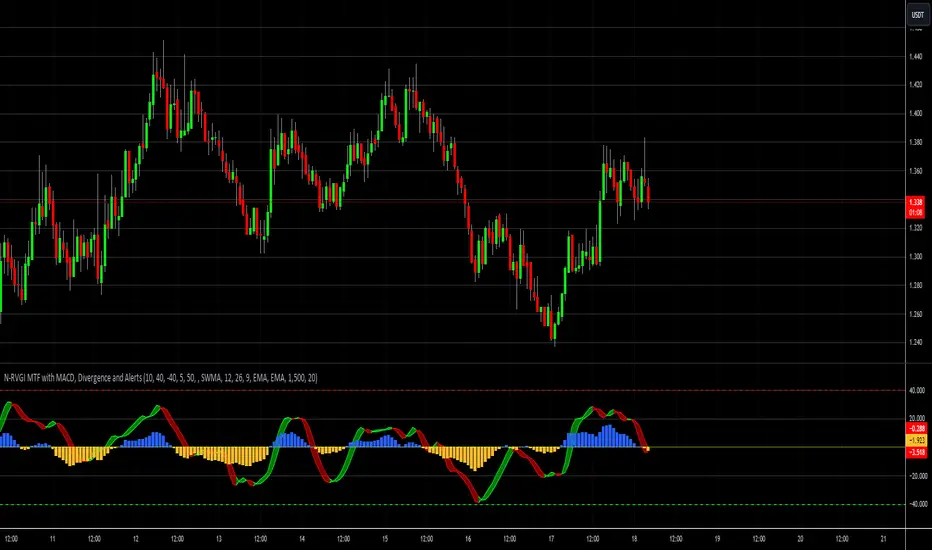
Relative Vigor Index [MTF] with MACD, Divergence and AlertsThis advanced indicator integrates the Normalized Relative Vigor Index (RVGI) with Multi-Timeframe (MTF) analysis, MACD, divergence detection, and customizable alert features. It provides a comprehensive toolkit for traders to analyze market momentum, identify trend changes, and react to significant technical signals.
Key Features:
Normalized Relative Vigor Index (RVGI):
Calculation: Computes the RVGI and its signal line using various smoothing methods (SWMA, EMA, SMA). The RVGI measures the strength of price movement relative to its historical volatility, providing insights into market momentum.
Plotting: Visualizes the RVGI and signal line on the chart. Users can customize the colors and transparency of the plots and the ribbon that fills the area between them.
Overbought/Oversold Levels: Displays horizontal lines to mark overbought and oversold zones, helping to identify potential reversal points.
Multi-Timeframe (MTF) Analysis:
Timeframe Selection: Allows users to select different timeframes for RVGI analysis, providing a broader perspective on market trends and signals.
Integration: Combines MTF data with the main indicator calculations to offer a more comprehensive view of market conditions.
MACD Integration:
Calculation: Computes MACD, MACD signal line, and MACD histogram with options for different moving average types (SMA, EMA) and a customizable scaling factor.
Plotting: Plots the MACD histogram, zero line, and signal line, with color and transparency settings to distinguish between positive and negative values.
Divergence Detection:
Bullish Divergence: Identifies and plots bullish divergence when the price makes a lower low while the RVGI makes a higher low, suggesting potential upward reversals.
Bearish Divergence: Identifies and plots bearish divergence when the price makes a higher high while the RVGI makes a lower high, indicating potential downward reversals.
Alerts:
Divergence Alerts: Configurable alerts for bullish and bearish divergences, notifying traders of significant potential reversals.
RVGI Alerts: Alerts for RVGI crossovers, overbought/oversold conditions, and trend changes based on RVGI and signal line crossovers.
MACD Alerts: Alerts for MACD line crossovers, histogram crossovers, and MACD zero line crossovers, helping traders stay informed of key MACD signals.
Customization Options:
Ribbon Colors and Transparency: Users can adjust the colors and transparency of the RVGI ribbon, enhancing visual clarity.
MACD Histogram Colors and Transparency: Customizable colors and transparency settings for the MACD histogram improve visibility and differentiation of positive and negative values.
Smoothing Methods: Choose between different smoothing methods for RVGI, tailoring the indicator to specific trading strategies.
Use Cases:
Trend Analysis: Utilize RVGI and MACD signals to analyze market trends, identify potential trend reversals, and assess momentum.
Divergence Identification: Detect and act on divergences between price and RVGI to spot potential trading opportunities.
Alert Management: Customize and receive alerts based on various conditions, ensuring timely responses to market signals.
Conclusion:
This indicator is designed for traders who seek a comprehensive tool combining momentum analysis, divergence detection, and signal alerts. By integrating RVGI, MACD, and MTF analysis, it provides a powerful suite of features to enhance market analysis and trading decisions
Bounce Manager TrendlinesThe trendline script is made for manual input of trendlines using point clicks on the chart. The script will then see if price respects these lines by the parameters you input in settings panel. On a respectable bounce it will print buy/sell arrows. The script also has functionality to send alerts, this is helpful if you want to automate trendlines . I created this script and many others under the bounce manager toolkit to expand on the signalling capabilities of popular drawing tools as I find using just a crossover to be lacking especialy for full automation.
components:
- Line respect: When price moves past this the script will no longer look for entry until a new trend has been established. The line can also be used as a stop loss.
- Confirmation: When price touches the line during a trend it
will wait to cross over this line to confirm a reaction from the line.
- Consolidation filter: A trend filtering system, this is a distance from
the line price has to break to confirm trend direction.
- Stop loss: This can be set to a percentage distance from the low after
bounce. Or it can be set to the line respect line
- Take profit: This can be a fixed take profit target or a risk to reward
based take profit. With risk to reward it will multiply the stop loss
distance by the input and use that to create target (green cross)
- ATR based or % based: there are 2 versions of the script, one for strict
percentage based logic and another one based on ATR values
If you are having problems figuring out which settings to use I recommend you check the Bounce Manager ATR script for reference as this script plots the components:
Zignaly automation settings:
zignaly integration, you can use the settings panel to decide your risk management. Option to use a fixed take profit % or an automatic risk to reward calculation based on the stop loss. Stop loss can get calculated using the max violation setting as a stop loss (this will put stop loss below line respect level) or when not checked it will use 0.01% below the low of the signal candle as stop loss. Just add your zignaly private key in the settings and use any alert function call as alert. Make sure to use zignaly.com as your webhook url.
If 5 trendlines are not enough use the 20 line input version, this script is for the clean strong trendline trader.
Part of the Honest Algo indicator suite

Joint Conditions Strategy Suite + TradingConnector alerts bot"Please give us combined alerts with the possibility of having several conditions in place to trigger the alert." - was the top voted request from users under one of the recent blogposts by TradingView.
Ask and you shall receive ;)
TradingView is a great platform, with unmatched set of functionalities, yet this particular combo of features indeed seems not to be in place. Fortunately, TradingView is also very open platform, thanks to PineScript coding language, which enables developing combos like the requried one and plenty of other magic.
I have already published numerous "educational" scripts, showing how to code indicators and alerts with PineScript, but... this is not one of them. This one is for real. READY FOR USE on real markets, also by the non-coding traders. Just take my script, set parameters with dropdowns, backtest the strategy, fire the alerts and execute them.
HOW TO USE IT
In "Settings" popup I tried to mimic the CreateAlert popup dropdowns for selecting logic. Let's say you want to enter Long position at Stochastic KxD crossover. In first line of Long Entry conditions set "StochK" + "Crossing Up" + "StochD". Last field doesn't matter because in 3rd dropdown something else than "value" was selected. In second line you could set "maB" + "Greater Than" + "maC" to filter out those entries which are in direction of the uptrend. And yeah, add ADX>25 to make sure the market is actually moving: "ADX" + "Greater Than" + "value" + "25". All condition lines must be TRUE (or skipped) for the entry to be triggered. Toghether with an alert.
The same for Short entries. Combinations are limitless.
INDICATORS AND MTF (MULTI-TIMEFRAME)
In those dropdowns you can select candle values like open/close/high/low/ohlc4, but also some most popular indicators, which I have pre-built into this script: RSI, various Moving Averages, ADX-DMI, Stochastic and Bollinger Bands for start. You can configure parameters of those indicators also in "Settings" popup, in "Indicator Definitions" section. What's important, you can use any of these indicators from higher timeframe, setting MTF multiplier. So if you applied this indicator to 1h chart, but want to use rsi(close,14) from 4h chart, set MTF to 4. If you want to use current timeframe indicators, keep MTF at 1, which is a default setting here.
Note for coders: to keep focus of this script on joining conditions, entire logic for those indicators has been moved to external library, also open source. I encourage you to dig into the code and see how it's done. I love the addition of libraries concept in PineScript.
CUSTOM INDICATOR
Following the "openness" spirit of my master - which is TradingView itself - my work is also open, in 2 ways:
1. This script is open source. So you can grab it, modify or add any functionalities you want. I cannot and don't want to stop you from doing that. I'm asking for only one favor - please mention this source script in your credits.
2. You can import the plot (series) from any other indicator on TradingView. In Settings popup of my script, scroll down to "Indicator Definitions" section, and select the series of your choice in the first dropdown. Now it is ready to use in conditions dropdowns on top of the Settings popup.
Let me give you an example of that last scenario. Take another script of mine, "Pivot Points on SR lines DEMO". You can find it in "Indicators & Strategies" library or here: (). Attach it to your chart. Now come back to THIS script, open Settings popup and in "Custom Indicator aka Imported Source" select "Pivot Points on SR lines: ...". The way it works - it detects if a pivot point happened on Support/Resistance line from the past and returns 1 for PivotLow and -1 for Pivot High. Now in first Long Entry condition set: "custom indicator" + "Greater Than" + "value" + "0" and long entries will be marked on every pivot low noticed on Support/Resistance line.
ALERTS
Last but not least - the alerts. This script produces alerts on the entries calculated by strategy logic, as marked on the chart by the backtester. Moreover, syntax of those alerts is already prepared and fully compatible with TradingConnector - alerts executing tool (bot), if you want to auto-execute those trades. Apart from installing the tool, you need to set
up the alerts in TradingView, here is how:
open CreateAlert popup
in first dropdown select "Joint Conditions Strategy Template"
in second dropdown select "alert() function calls only"
And that's all. You only need to set one alert for the whole script, not one for Longs and one for Shorts as it was in the past. Also, you don't need to setup closing alerts, because stop-loss/take-profit/trailing-stop information is embedded in the entry alert so your broker receives it as early as possible. Alerts sent will look like this: "long sl=40 tp=80", which is exactly what TradingConnector expects.
Phew, that's all folks. If you think I should add something to this template (maybe other indicators?) please let me know in comments or via DM. Happy trading!
P.S. Pyramiding is not supported in this script.
Disclaimer : I'm not saying above combination of conditions will make you money. Actually none of this can be considered financial advice. It is only a software tool. Use it wisely, be aware of the risk and do your own research!

Economic Event Timer & Alerts [AlgoXcalibur]Stay ahead of market-moving news with this real-time event tracker and countdown alert system.
This essential algorithm displays critical scheduled events that may influence sudden spikes in market volatility, helping you stay aware and reduce exposure to unpredictable moves before they even happen. Featuring a captivating on-chart display with event titles, adjustable time zone, real-time countdowns, and live alert notifications — you’ll always know what’s ahead — so you can prepare, not react.
🧠 Algorithm Logic
The Economic Event Timer & Alerts system delivers critical market awareness through an array of integrated functions. At its core, a live countdown table provides real-time updates on the day’s scheduled economic events, with dynamic, color-coded countdowns that ensure fast and easy interpretation at a glance. Complementing the table, Countdown Alerts notify you 30 minutes, 10 minutes, and 1 minute prior to each event—giving you clear, timely reminders without the need to constantly monitor your chart. The adjustable time zone input supports ET, CT, MT, PT, or UTC, so the displayed time-of-event aligns with your trading session. Rigorously refined, the algorithm updates the table daily—and clearly displays No Scheduled Events Today to provide certainty and reassurance on days without scheduled events. Packaged in a minimalist, unobtrusive design, the tool remains visually clean and focused for serious traders.
Updated automatically for hassle-free peace of mind.
⚙️ Features
• Time Zone Selector: Easily toggle between time zones to match your trading session.
• Countdown Alerts: Enable real-time notifications to keep you informed and aware of events without having to monitor the chart.
• Update & Expiration Awareness Feature:
This innovative feature includes a simple visual and alert system that prompts you when it’s time to reload the indicator & recreate alerts — ensuring your alerts are always tied to the latest data update.
🔄 Update Available
On the final day of current event data, the indicator will:
• Display Update Available on the indicator’s table
• Send an alert at 4:00 PM ET reminding you to reload & recreate alerts
You can load the updated version anytime that day.
⛔ Expired
If not reloaded, the next day the indicator will:
• Display an EXPIRED banner on the indicator’s table
• Send a Data Expired alert every day at 8:30 AM ET that prompts you to recreate alerts, until you do or disable the alert.
This prevents missing event alerts unknowingly.
Why is this feature necessary?
Even though the indicator is updated when necessary (typically every 2–4 weeks) to provide upcoming event data automatically, TradingView alerts do not auto-update —they stay tied to the version of the script that was active when the alert was created.
This thoughtful refinement is designed to ensure your alerts remain synced to current events and ready for when it matters most.
🚨 Protect Your Capital
At AlgoXcalibur, we understand that the best way to be profitable is to avoid unnecessary risk.
Dedicated to empowering traders with insight that matters, we designed this tool to transform inconvenient economic calendars into effortless, essential information—displayed directly on your chart. Whether you’re managing open positions or timing new trades, knowing when impactful events are about to hit is crucial to being proactive, protecting capital, and trading with confidence. This is not a technical analysis indicator—this is a risk management tool that provides traders with a fundamental edge.
Built for traders who value risk management, market awareness, and algorithm automation.
🔐 To get access or learn more, visit the Author’s Instructions section.

Candle Range Trading (CRT) with Alerts
📌 Description:
The Candle Range Trading (CRT) indicator identifies potential reversal or continuation setups based on specific two-candle price action patterns.
It analyzes pairs of candles to detect Bullish or Bearish CRT patterns and provides visual signals (triangles) and alert notifications to support scalp or swing trading strategies.
🔍 How It Works:
🔻 Bearish CRT Pattern:
Candle 1 is bullish
Candle 2 is bearish
Candle 2's high > Candle 1's high
Candle 2 closes within Candle 1’s range
🔺 Red triangle above candle
🔺 Bullish CRT Pattern:
Candle 1 is bearish
Candle 2 is bullish
Candle 2's low < Candle 1's low
Candle 2 closes within Candle 1’s range
🔻 Green triangle below candle
📈 Visual Features:
🔺 Red triangle = Bearish CRT
🔻 Green triangle = Bullish CRT
📏 Optional box showing CRT High and CRT Low
🔔 Built-in Alerts:
Bullish CRT Alert: "Bullish CRT Pattern Detected"
Bearish CRT Alert: "Bearish CRT Pattern Detected"
Set alerts to get notified instantly when a pattern is detected.
⚠️ Note:
Use in conjunction with trend filters, support/resistance, or volume for best results.
Ideal for scalping or short-term trades.
Avoid trading in choppy or low-volume markets.
⚠️ Disclaimer:
This script was generated with the assistance of ChatGPT by OpenAI and is intended for educational and informational purposes only.
All strategies, alerts, and signals derived from this indicator should be thoroughly backtested and validated before using in live trading.
Trading involves substantial risk, and past performance is not indicative of future results. The author and ChatGPT bear no responsibility for any trading losses or financial decisions made using this script.
Users are solely responsible for the risks associated with their trading actions. Always apply proper risk management and perform your own due diligence before making any financial decisions.

Cumulative Volume Delta with VWAP-based Buy/Sell AlertsDescription:
This script combines Cumulative Volume Delta (CVD) with Volume Weighted Average Price (VWAP) to generate buy and sell signals. It plots both the cumulative volume delta and its moving average on the chart, but the actual buy and sell signals are now based on the crossover and crossunder of the price with the VWAP, a popular tool for tracking price relative to the volume-weighted average over time.
Features:
Cumulative Volume Delta (CVD) Plot:
CVD helps visualize the net buying or selling pressure by accumulating volume when the price is rising and subtracting it when the price is falling. The cumulative volume is plotted on the chart as a blue line.
Moving Average of CVD:
A simple moving average (SMA) of the cumulative volume delta is plotted in orange to smooth out fluctuations and help detect the trend of volume flow.
VWAP Calculation:
VWAP (Volume Weighted Average Price) is a standard benchmark widely used in trading. It gives insight into whether the price is trading above or below the average price at which most of the volume has traded, weighted by volume. The VWAP is plotted as a purple line on the chart.
Buy/Sell Signals Based on VWAP:
Buy Signal: Triggered when the price crosses above the VWAP, indicating potential upward momentum.
Sell Signal: Triggered when the price crosses below the VWAP, signaling potential downward momentum.
These signals are displayed on the chart with clear labels:
Buy Signal: A green upward label appears below the price.
Sell Signal: A red downward label appears above the price.
Alerts for Buy/Sell Conditions:
Alerts are built into the script, so traders can receive notifications when the following conditions are met:
Buy Alert: The price crosses above the VWAP.
Sell Alert: The price crosses below the VWAP.
Use Case:
This script is useful for traders looking to incorporate both volume-based indicators and the VWAP into their trading strategy. The combination of CVD and VWAP provides a more comprehensive view of both price and volume dynamics:
VWAP helps traders understand whether the price is trading above or below its volume-weighted average.
CVD highlights buying or selling pressure through cumulative volume analysis.
Customization:
Anchor Periods: The user can customize the anchor period to suit different timeframes and trading styles.
Custom Alerts: The alert conditions can be easily modified to integrate into any trader’s strategy.
This script can be adapted for both short-term and long-term trading strategies and is especially useful in high-volume markets.
How to Use:
Add the script to your TradingView chart.
Customize the timeframe and anchor period, if needed, to match your preferred trading style.
Watch for Buy/Sell signals based on price crossing the VWAP.
Set up alerts to receive notifications when Buy or Sell signals are triggered.
This script is designed to help traders make informed decisions based on both price action relative to volume and Cumulative Delta volume trends, giving a more comprehensive view of the market dynamics.
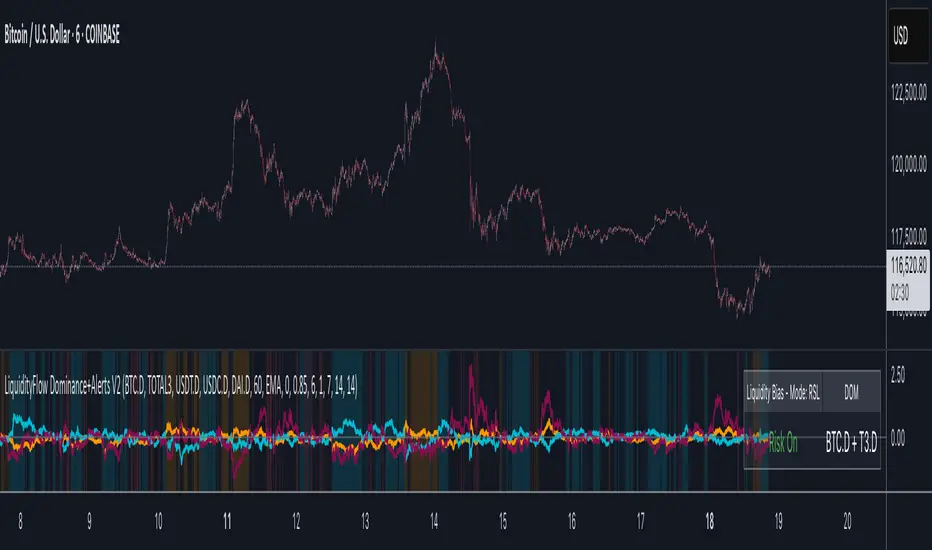
LiquidityFlow Dominance+Alerts (btc.d, T3, Stables)LiquidityFlow Dominance+Alerts: Overview & Usage Guide
Overview
The LiquidityFlow Dominance+Alerts indicator provides a dynamic view of liquidity flow across Bitcoin, Altcoins, and Stablecoins, helping track liquidity shifts and identify market sentiment. By integrating moving averages, custom alerts, and thresholds for extreme outliers, this indicator helps to anticipate bullish and bearish shifts in liquidity and alert market tops and bottoms.
Key features include:
1. Liquidity Flow Monitoring : Track liquidity flow across Bitcoin (BTC), Altcoins (TOTAL3), and Stablecoins (USDT, USDC, DAI).
2. Custom Alerts : Set alerts for key liquidity shifts and extreme conditions in Stablecoin dominance, both with static and moving average (MA)-based calculations.
3. Moving Averages : Use Simple, Exponential, or Weighted Moving Averages to smooth out market data for more reliable signals.
4. Outlier Detection : Identify potential tops and bottoms using thresholds for Stablecoin dominance, with alerts for extreme movements.
Functionality
Data Inputs and Key Metrics
- Symbols Monitored:
- Bitcoin Dominance (BTC.D)
- Altcoin Market Cap (TOTAL3)
- Stablecoins (USDT.D, USDC.D, DAI.D)
- Liquidity Flow Conditions:
- Track percentage changes in dominance across sectors to detect liquidity flow into Bitcoin, Altcoins, or Stablecoins.
- Custom Metrics:
- Liquidity Flow Index: BTC Dominance minus Stablecoin Dominance.
- Liquidity Flow Ratio: BTC Dominance divided by the combined dominance of Stablecoins and Altcoins.
Moving Average Integration
- Select from SMA, EMA, or WMA to apply moving averages to the dominance metrics. Moving averages help smooth out short-term volatility and provide more consistent signals.
- Moving averages are applied to each sector (BTC, Altcoins, and Stablecoins) and compared to their previous period values to determine shifts in liquidity.
Alerts and Thresholds
- % Change Lookback Period: Adjust the lookback period to align with the timeframe of your chart. Shorter timeframes may require a lower lookback period, while higher timeframes may benefit from longer periods.
- Stables Bull/Bear % for Alerts: Set a threshold for when Stablecoin dominance becomes a bullish or bearish signal relative to BTC and Altcoins. A higher threshold may be used in volatile markets to filter out noise.
- Extreme Outliers Detection: Use the **Stables Up/Down Extreme Threshold** to identify potential market tops or bottoms when Stablecoin dominance deviates significantly from historical trends. The **Extreme Lookback Period** controls the time window for detecting these anomalies.
How to Use the Indicator
Adjusting the % Change Lookback Period
- The `% Change Lookback Period` should be adjusted based on your chart’s timeframe. For example, a shorter period (e.g., 7) works well for intraday charts, while longer periods (e.g., 14) might be more suitable for daily or weekly charts.
Setting Thresholds for Alerts
- Stables Bull/Bear % for Alerts: Adjust this setting to define when Stablecoin dominance triggers bullish or bearish alerts. A value like 1% could be a good starting point for most market conditions but can be fine-tuned based on volatility.
- Extreme Lookback Period: Define the lookback period for detecting extreme moves in Stablecoin dominance. This will help identify major tops and bottoms in the market. For shorter-term trades, consider using a shorter extreme lookback (e.g., 7-10 periods).
Alerts for Liquidity Shifts
- The indicator supports alerts for key liquidity shifts, which are useful for staying ahead of market movements. Alerts can be set to notify you when liquidity moves into:
- Bitcoin: Indicating a potential bullish trend for Bitcoin.
- Altcoins: Signaling altcoins are bullish.
- Stablecoins: Suggesting a risk-off environment or market correction.
Extreme Alerts for Stables
- Extreme Up/Down Alerts: These are triggered when Stablecoin dominance crosses extreme thresholds. For example, if Stablecoin dominance rises more than 14% over a set period, it could signal a market top, while a significant drop could indicate a market bottom.
Moving Average Calculations
- In addition to static percentage changes, moving averages can be applied to smooth out dominance values. The type and length of the moving average can be customized:
- SMA (Simple Moving Average): Best for smoothing out volatility in a linear way.
- EMA (Exponential Moving Average): More responsive to recent data, making it useful in faster markets.
- WMA (Weighted Moving Average): Emphasizes more recent data, but less reactive than the EMA.
Additional Usage Tips:
- Background Colors: The indicator visually highlights the dominant liquidity flow:
- Orange: Liquidity is shifting toward Bitcoin.
- Aqua: Liquidity is flowing into Altcoins.
- Red: Liquidity is moving into Stablecoins.
Round Numbers Breakouts Smart Formula Signals and AlertsThis indicator uses Round Numbers breakouts and then uses smart formula with the near Round Numbers to determine best TP (take profit)/SL (stop loss) areas. Furthermore, it calculates win percentage, shows in-profit/in-loss peaks and the price amount result over a customizable date range, which when combined well with the smart formula provides decent profitable outcome. I have decided to write my own backtesting engine as the integrated TradingView strategy one has limitations and has shown inconsistencies when compared to manual backtesting…
There are many settings you can manually change to trade any instrument, any style, any approach and there are presets included for Bitcoin(BTCUSD), FOREX(EURUSD), SPY(S&P500), so you can start trading immediately! Alerts correspond to indicator settings and are turned on with a few clicks. There are 3 tables (each can be shown/hidden) showing everything you need to see/know to calibrate the indicator as you wish.
Labels, lines, tables explanations (everything can be hidden/shown):
- LONG Labels: medium-green: position open, dark-green: SL, bright-green: TP, blue: TP2
- SHORT Labels: medium-red: position open, dark-red: SL, bright-red: TP, purple: TP2
- Gray circles: position entry area | Yellow crosses: SL area
- Green line: Long TP1, Blue line: Long TP2 | Red Line: Short TP1, Purple line: Short TP2
- Grey lines: Round Numbers (customized via “Round Number up/down measure unit” input)
- Yellow labels at end of each week: end of week OVERALL total results
- Red colored background: power segment
- 3 tables: 1) INFO | STATS, 2) SPY Options Calculator, 3) Indicator Settings
If you decide to fully customize the indicator yourself, on the very top - under “PRESETS” select “MANUAL”! NOTE: If you select any of the pre-set presets, only GLOBAL settings can be changed, the rest of the settings will be “frozen” until you switch it to “MANUAL”!
- Global Settings are self-explanatory and mainly observational, show/hide, etc.
- Manual TP2 (Multi-Take-Profit) Settings:
>>>>> Include TP2 System? Turn on/off multi-profit system, with this unchecked, every trade will either end with SL or with TP1.
>>>>> TP2 System: NEAREST/FORMULA, NEAREST – after TP1 is taken > next TP2 will be a round number price target nearest to where TP1 was taken (sometimes it can be very near, sometimes further away…), FORMULA – 2nd round number price target will be optimally selected based on the distance behind and ahead of TP1 area. For TP2 – FORMULA would be the most logical choice as with multi-take-profit setting turned on – you’d want to ride it out as far as possible.
>>>>> TP1/TP2 division type: 1) Each price target (TP1, TP2) will be ½ of the position 2) TP1 will be 2/3 of the position and TP2 will be the remaining 1/3.
>>>>> TP2 hit type: “close” > candle has to close on top/crossing the price target line, “touch” > once candle touches the price target – you will be immediately alerted to take the partial profit (if you will use such setting – you will need to take the partial profits as soon as you receive the alert.
>>>>> TP1 > Back to Entry hit type: similar to TP2, “close” > candle close, “touch” > candle touch. Please note: this is a very tricky setting as if you use “close” option – your profitable trade may become a loss if a huge candle will close against your position eliminating your TP1 profit, however often the price will touch and cross the entry area to only bounce and continue with your position direction for even bigger profits… so experiment with the date range results to see what works best for your instrument/setting/strategy.
>>>>> TP2 count towards trades count: this can be a bit confusing, but it is simply how should TP2 be treated towards trades count. The indicator will show you Win Percentage and Win % is obtained from winning trades count divided by total trades count. While TP2 is not “a new trade”, it expands the profit of the trade. This is an experimental setting to count TP2 as the whole winning trade, ½ of a trade, or not count it at all.
- Manual Signals/TP1 Settings:
>>>>> TP1/TP2 offset: this one is really cool, with this feature you can hunt these conditions when the price comes very near the profit target area, but never touches it. With this setting turned on and with a good offset amount – you will be able to catch these for TP1 and TP2!
>>>>> TP1/TP2 offset amount: just what the title says, please be careful with this as this number varies significantly depending on the instrument you will be trading. Examples: 1) For SPY 0.1 would be $0.10 offset - if TP1 is $400 and price hits $399.90 > TP1 considered taken/signal shown/alert) | 2) For EURUSD, it is very different and if wrong will show TP1 immediately at position open, typical good offset for EURUSD is: 0.0005 | 3) For BTCUSD, 10 - $10 offset, if TP is $15,000 > $14,990, etc.
>>>>> Round Number up/down measure unit (in dollars $): this one is very important if you will be using “MANUAL” selection to build your own setup as it is very different for every instrument. For SPY, round numbers are single dollars or even half-dollar 50 cent numbers: 1 or 0.5 (350, 351, 352, etc. or 350.50, 351, 351.50, 352, etc.), while for Bitcoin (BTCUSD) a single unit ($1) is too small to be a round number as Bitoin moves much faster and wider every second and it would have to be at least 50 ($50) to make sense. Similar for FOREX (EUR/USD) a single 1 unit ($1) will be too big as EURUSD will never move a whole $1 in 15 minutes or even a day.. and would have to be something like 1.05500. You can easily determine if this number makes sense for your instrument by observing the grey Round Number lines which will correspond based on this setting. You can also visually observer if the price of the instrument appreciates these round numbers.
>>>>> Close Position Before Market Closes: just what the title says. Indicator will close the position 15 minutes before market closes (US session), update backtesting stats, alert you.
>>>>> Close Position Before Power Hour: 3PM – 4PM ET is the last hour of US trading session, where sudden move in any direction can happen with huge volatility, while sometimes nothing will happen at all… Many try to avoid it, so if you wish to avoid it as well - turn this on and it will alert you to close your positions 15 minutes before Power Hour starts, backtesting/stats will be adjusted accordingly.
>>>>> Skip OVERSIZED candles in signals: turn on this setting to skip signals, which happen to fall on big candles. This is basically a protection from huge volatility moves, which usually happen during financial news/events and if you are not a fan of these – you can set this option for indicator to not open anything based on the candle size.
>>>>> Color OVERSIZED candles: this will help you calibrate the size of the OVERSIZED candles if you decide to use this setting and overall visually see them.
>>>>> OVERSIZED candle size: OVERSIZED candle size must be input as it varies significantly. Please note: for each instrument – the size number is completely different, as for SPY: 2 would mean any candle bigger than $2 distance will be considered OVERSIZED, for Bitcoin it would have to be several hundred dollars, like 400-500. For FOREX, this would have to be a decimal, for EURUSD something like 0.0005. It’s best to experiment visually with this setting depending on the instrument you will be trading while setting up the size. To see a typical huge unusual candle – look up financial calendar for something like FOMC meeting, then measure the candle input it into this setting.
>>>>> OVERSIZED candle size calculation type: this is just more flexibility for your preference. If you wish to calculate the size of the candle based on the open/close – select “BODY”, if you wish to use high/low – select “STICKS (from tip to tip)”. Hard to say which one is better, so it is up to you to decide.
>>>>> Include EMA in signal formula: LONG signals will only be shown only if above EMA, SHORT if below EMA. EMA length is of course customizable in below.
>>>>> Skip opposite candle types in signals: signals where the candle color confirms the direction of the trade, but the candle type is opposite (like a green colored bearish hammer for example) will be avoided (such candles can be very uncertain/deceptive).
>>>>> Skip doji: signals where the signal candle is doji (uncertain) will be avoided.
>>>>> TP1 hit type/system: same thing as TP2 hit type/system.
>>>>> SL hit type/system: same as TP1 and TP2 types/systems.
>>>>> Intraday Session Signals Active Time in ET: time range during the day when indicator will show signals (open trades, alert you, etc.). This is specifically for intraday trading. You can turn it off completely by selecting a BLANK option.
>>>>> Intraday TP/SL Active Time in ET: same as above, but for taking profits/stop losses.
*** To add the alerts
-Right-click anywhere on the TradingView chart
-Click on Add alert
-Condition: Select this indicator by it’s name
-Alert name: Whatever you want
-Hit “Create”
-Note: If you change ANY Settings within the indicator – you must DELETE the current alert and create a new one per steps above, otherwise it will continue triggering alerts per old Settings!
If you wish to try this out for a week or so – please write me directly and I will give you access.

Original Strategy - Backtest & Alerts [AlgoRider]█ OVERVIEW
This indicator simulates an efficient trading strategy developed by our team in a simple and effective way, the primary objective when designing it was to make its reading and use as simple as possible for TradingView users. The Backtesting feature has been designed to keep only the most essential information to obtain clear and precise results directly on the graph. The settings interface has also been designed for ergonomic and simplified use. The user is free to customize the parameters as he wishes and according to his trading profile by having the choice, for example, of using options to reduce the risk of loss, to increase the win rate, to optimize profits. Automation is made possible and facilitated thanks to preconfigured alert conditions.
█ CONCEPTS
How the strategy works :
When the price is close to its equilibrium (represented by an exponential moving average - EMA) and it starts to take an upward or downward direction the script will issue Long or Short entry orders. If the price turns and goes to the opposite direction, the script quickly cuts the position by issuing a Stop Loss order. When the price takes a real clear direction, this is where the script will be able to accumulate profits.
What makes this script unique is :
• That it is entirely developed by us, inspired by a strategy that is little known and little used in the trading world, in particular because it often involves a greater number of losing trades than winning trades.
• Its ease of reading and use. The backtesting feature was designed to clearly display the most important information in a data table directly on the chart. The user is not lost with dozens of superfluous data and can directly access the most essential information to see how the strategy has performed in the past.
• Its ease of configuration and customization. Once in the configuration window, again the user is not lost, because there is only one main parameter to modify, it is the length of the EMA, which will influence the timing of entries and exits trades. Then there are a few other non-mandatory parameters to fine-tune risk management and maximize profits. (Detailed description of the settings further down the page)
• Strategy automation made easy and fast thanks to several types of alerts which are differentiated for entries, for auto-exits and for Custom TP and SL. These alerts can be configured to send the messages by email or via Webhooks.
• The indicator has several custom options allowing its user to go further than the basic strategy. Several confirmations for entries are available as well as the possibility of adding or not a personalized TP and/or SL.
• There is no repaint, once an entry/exit symbol or drawing is displayed it doesn't change anymore. The Short, Long and auto-Exit signals appear only at the open of the candles, just after the signal was confirmed at the close of the previous candle. The custom TP and custom SL signals can appear when a candle is not yet finished, but once displayed they don't change.
█ HOW TO PROCEED
1 — Once the script is applied to your chart, it already works with its default settings. You can already see the performance of the strategy in the data table directly on the chart (in the top right corner by default).
2 — You can customize the strategy and influence the results/performance by modifying its parameters. 3 types of parameters are present and can be modified.
3 — This strategy is designed for the cryptocurrency market in priority, but you can also try it on other types of assets. It works on Futures but you can also try it on Spot market mainly for LONG trades.
4 — You can apply the script in every timeframe. We do not recommend using it below m30 because in most cases the statistics are unfavorable largely because of the fees. (This is not a financial advice but only for the use of the indicator)
█ FEATURES
Screenshot on BYBIT:EGLDUSDT Bybit Futures, H1, with default parameters, from 2022-01-01 to 2022-09-27, to show the settings window
• Settings For Backtesting
- Strategy : Choose from a drop-down list if the strategy should execute only Long trades or only Short trades or both. Default Both.
- Invest. : Choose the amount you want to invest in the simulation. Default 10000.
- Position : Choose the amount of the position (Size order) that will be used during the simulation. This will be the $ amount staked/involved for each trade entry.
Ex: If you put 20000 in position and 10000 in Invest. We consider that you use at least a leverage x2. Default 10000.
- Slipp. TP : Choose the amount in percentage of average slippage for Take Profits. This parameter makes it possible to predict a potential gap between the theoretical exit price for each TP (On the graph) and the real exit price on an exchange when implementing the strategy for real (slippage may be due to a time lag of a few seconds from execution time of the order on the exchange and/or due to the execution of a market order).
Ex: If a TP exit order of a Long trade, with entry $19000 (on BTCUSDT), is carried out in theory on the chart at $20000, in practice on the exchange the script have indeed sent an exit order at 20000 , but if the true exit price is 20050, the TP slippage is then +0.25%. Default 0.
- Slipp. SL : Choose the amount in percentage of average slippage for Stop Losses. This parameter makes it possible to predict a potential gap between the theoretical exit price for each SL (On the graph) and the real exit price on an exchange when implementing the strategy for real.
Ex: If an SL exit order of a Long trade, entry $19000 (on BTCUSDT), is carried out in theory on the chart at $18000, in practice on the exchange the script have indeed sent an exit order at 18000 $, but if the true exit price is 17950, the slippage SL is then +0.278% . Default 0.
- Fees % : Choose the percentage amount of fees applied to each trade to simulate the application of the strategy on the exchange of your choice. Applies to the entry and exit of each trade. Ex: For Binance Futures: 0.04; For Bybit futures: 0.06; For Ftx Futures: 0.075. Default 0.
- Cumulate Trades : If you check this, the Backtest will use 100% of the balance as Order Size (Position) for All or in the next X consecutive trades. Default not checked.
⚠️ Be Careful please, this option is available to show the full extent and possibilities of the algorithm when pushed to its limits thanks to the accumulation of profits (cumulative earnings), but it is a strategy that involves great risk. If a bad trade suffers a -50% loss, 50% of the account balance is lost, if the position is liquidated, the entire account balance is lost.
- All : If you check this All trades will be accumulated. Default not checked.
- Consecutive Trades : Choose the number of trades to accumulate. After X consecutive trades, the algorithm reassigns the initial order size to the current one and starts again for X consecutive trades. Minimum Value 2, Default 2.
• Settings To Optimize Performances and Risk Management
- (Main Parameter) EMA Length : Choose the length of the EMA. This value will determine the exponential moving average plot (blue line) that represents the equilibrium in this strategy. Depending on the positioning of the price around this equilibrium, the algorithm will decide to trigger Long or Short entry alerts, and exit alerts. Default 200.
- 1 - Confirm (After X Bar(s)) : If you check this, when the algorithm will detect an entry, it will wait for the number of bars you have entered to actually trigger the entry alert. Default not checked.
- Nb Bar : Enter here the number of bar you want, will be taken into account only if you check (1) Confirm (After X Bar(s)). Default 2.
- 2 - Confirm (Trend) : If you check this, when the algorithm will detect an entry, it will check that the trend is similar to the direction of the trade, if not, it will wait that the trade goes in the same direction as the trend to actually trigger the entry alert. Default not checked.
- OR/AND : This choice is taken into account only if you tick both confirmations. If you choose OR: The first of the 2 confirmations to be validated will trigger the entry alert. If you choose AND : once confirmation (1) is validated, the algorithm waits for confirmation (2) to be validated to actually trigger the entry alert. Default OR.
- Use TP / Use SL : If you check these, the algorithm will trigger personalized trade exit alerts when the price evolution has reached the amounts indicated since the trade entry. Default not Checked.
- % TP - SL : Indicate here the personalized amount in percentage that you want for your Take Profit and Stop Loss of each trade. Default 15-5.
• Settings For Appearances
- Small-size Data Table : If you check this, the data table will become smaller to free up more space on the chart to make it visually more pleasing. Default not checked.
Hide Table /
- Hide Labels / : You can check these to get a cleaner chart and focus only on what interests you in the indicator. Default not checked.
Hide Risk-Reward Areas
█ MAIN PARAMETERS TO USE
• In the default settings none of the box settings are checked. Basic strategy is made to be applied this way.
• The main parameter (the length of the EMA) is by default 200 because it is a known value that many traders rely on in many trading strategies. Moreover in this strategy it works in many cases and on different timeframes.
• To go further the user of the indicator is free to modify the parameters of the category "Leading Parameters - Risk Management" to reduce risks and to optimize profits.
• You can find below our recommendations for the EMA length value corresponding to the main timeframes.
m30 — EMA Length = 400 | 800
H1 — EMA Length = 200 | 400
H2 — EMA Length = 200 | 250
H4 — EMA Length = 100 | 200
D — EMA Length = 20 | 40
⚠️ We have chosen to recommend these settings because they will work in most cases, on most cryptoassets, but of course they will not work 100% of the time on all assets and will not always give positive results in the backtest, and they are not the most optimized parameters either. The user of the indicator is free to optimize the asset on which he wants to trade in his own way. Just as we do not give financial advice, we do not encourage to trade any asset in particular.
█ STATISTICS
The statistics presented below are an example of the results that the strategy can provide. (Reminder: These statistics are made over a past period and there is no guarantee that the same performance will reproduce in the future) .
For the demonstration we chose to apply the strategy on the Top 5 marketcap cryptos in September 2022. They are not the most favorable coins for this strategy but at least this way we don't take the most suitable assets to show wonderful and biased results. Likewise for the parameters used which are the default ones and which are not the most optimized parameters, much better results are possible. We chose Binance because it has the highest volumes and liquidity and the most historical data. We chose H1 because it is one of the most used timeframes.
BTC
Screenshot on BINANCE:BTCUSDTPERP Binance Futures, H1, with default parameters (EMA : 400), from 2022-01-01 to 2022-09-27
ETH
Screenshot on BINANCE:ETHUSDTPERP Binance Futures, H1, with default parameters (EMA : 400), from 2022-01-01 to 2022-09-27
BNB
Screenshot on BINANCE:BNBUSDTPERP Binance Futures, H1, with default parameters (EMA : 400), from 2022-01-01 to 2022-09-27
XRP
Screenshot on BINANCE:XRPUSDTPERP Binance Futures, H1, with default parameters (EMA : 200), from 2022-01-01 to 2022-09-27
ADA
Screenshot on BINANCE:ADAUSDTPERP Binance Futures, H1, with default parameters (EMA : 400), from 2022-01-01 to 2022-09-27
To show the potential of the indicator and push it to its limits, here is an example of the strategy applied for about 2 years (Up to the maximum of historical data available).
⚠️ It must be taken into account that during the period of this backtest the last Bullrun took place and it was a very favorable period for the strategy and for this altcoin (FTM), nothing ensures that it will happen again. ⚠️
FTM
Screenshot on BINANCE:FTMUSDTPERP Binance Futures, H4, with default parameters ( without cumulative earnings) and EMA : 400, start on 2020/12/03 to 2022/09/27
✅ All of the above statistics are verifiable by anyone using the indicator's backtesting system.
█ LIMITATIONS
• Despite the fact that we can see good performances when we backtest the strategy, we must take into account the fact that these are results performed in the past and that in no case does this guarantee that these same performances will be repeated again in the future.
• The automation of this strategy is made possible and is facilitated by alerts, but you must be aware of the fact that if you decide to put this strategy into practice in real life, you are solely responsible for the results that you will be able to obtain and you must be aware of the possibility at all times of partial or even total losses of your invested capital.
• Keep in mind that generating profits in trading is difficult. A strategy can perform very well at one time in the past during a period that is favorable to it, then from one day to the next it can give really bad results for several months or years.
• When backtesting a strategy, there are many factors to consider, not just trade entries to which you add a Take Profit and sometimes a Stop Loss. You must at least take into account the size of the position in relation to the capital you want to invest, the trading fees, the slippages (which can be really important depending on the exchange on which you are trading and depending on the asset you are trading), trading frequency, risk management, momentum, volumes and even more.
• This indicator has been optimized for crypto, you can try to use it on other type of assets but again, at your own risk.
The information published here on TradingView is not prohibited, doesn't constitute investment advice, and isn't created solely for qualified investors.
═════════════════════════════════════════════════════════════════════════
Important to note : our indicators with the same backtesting system are published in separate publications, because putting them together in a single script would considerably slow down the execution of the script. In addition each indicator, even when it is based on a simple technical indicator, has several options, parameters and entry/exit conditions specific to the underlying technical indicator. Finally, we want to keep the simplicity of use, configuration and understanding of our indicator by not mixing strategies that have nothing to do with each other.
Cyatophilum Levels [ALERTSETUP]Cyatophilum Levels - Version 1.0 - Alert setup
This indicator allows you to build your own strategy based on Fibonacci levels, and create automated alerts for long & short entries and exits.
This study also has a backtest version. See my previous script.
The Fibonacci levels are printed automatically in real time and without repainting on the chart.
You configure your own strategy in the indicator parameters. You can choose to go long or to go short, or both, on which Fib levels to enter Long/Short, and on which Fib levels to exit (up to 2 entry levels and exit levels).
Detailed Guide:
This is a guide that can be useful if you do not understand the strategy or an indicator parameter. Instructions on how to get access are at the bottom.
To configure your strategy, you need to open the indicator settings. You can either right-click on the indicator and click "settings", or click the settings button near the indicator's name.
You should know that the Fibonnaci levels are calculated from the support and resistance levels, which are calculated using the last swing high and swing low. This behavior can be tweaked in the settings with the first 2 parameters:
· Noise reduction
Dropdown menu. Options are "NONE", "SMALL", "MEDIUM", "HUGE". Used to get a smoother level behavior. The higher it is, the less often the support and resistance levels will move. Can be useful to cut off fakeouts.
· Swings lookback
This is the number of historical bars used to calculate the last swing high and swing low.
In TradingView, we usually wait bar close to validate a signal (trade entry or exit), in order to avoid repainting. But since this indicator is purely based on price action, there is an option called Alert Type if you want to receive intra-bar alerts or not.
· Entry Alert Type
2 options : "Once Per Bar Close", "Once Per Bar". These correspond to the alerts options. You must use the same alert type in the indicator settings and in the alert options. When using "Once Per Bar", the candle high and low are used for the cross conditions, otherwise, candle close is used.
· Exit Alert Type
Same but for exit alerts.
The long trades setup can be configured independantly from the short trade setup, but the parameters are the same.
■ Go Long/Short
Check this box to enable/disable long/short trades.
· Long/Short Entry Condition
Dropdown menu from which you can pick the condition for your entry. Options available are "Cross Over","Cross Under" and "Just Cross".
· Long/Short Entry 1
Dropdown menu from which you can pick the level for your entry n°1. Options available are "Support","FIB 23", "FIB 38", "FIB 50","FIB 61","FIB 78" and "Resistance".
· Long/Short Entry 2
Additional FIB level entry.
· Long/Short Exit 1
Dropdown menu from which you can pick the level for your exit. Options available are "Support","FIB 23", "FIB 38", "FIB 50","FIB 61","FIB 78" and "Resistance".
· Long/Short Exit 2
Additional FIB level exit.
■ Trend Filter
Optionnal Tilson T3 TrendLine to make the strategy go long only when price is above T3 (green) and short only when price is below (red). The length in bars is configurable.
· Configuration Panel
It should appear on the left of the chart. This panel displays the whole indicator settings in a compact and easy-to-read way. You can replicate a strategy from just this info panel. Can be turned off if needed.
· Graphic options
A red/green background corresponding to the strategy position (short/long) can be turned off.
The Fib levels labels can be turned off all at once.
Risk management:
Place your secondary exit one or two levels above/below your entry to act as a stop loss.
Availabe alerts:
To create an alert, right-click on the indicator and click "Add alert".
The LONG alerts corresponds to the green labels on chart, while the SHORT are in red.
Select one of the following signals in order to create your strategy:
· LONG/SHORT ENTRY : Alert to enter a long/short. Make sure to select "Once Per Bar" or "Once Per Bar Close" according to the "Entry Alert Type" parameter.
· LONG/SHORT EXIT : Alert to exit a long/short. Make sure to select "Once Per Bar" or "Once Per Bar Close" according to the "Exit Alert Type" parameter.
Default settings are set for 15m.
Use the link below to obtain access to this indicator

Initial Balance with AlertsThis indicator is a comprehensive tool for Auction Market Theory (AMT) practitioners who rely on the Initial Balance (IB) to determine the day's likely structure. It automatically plots the High and Low of the opening session (user-definable) and extends those levels to provide key support and resistance zones for the remainder of the trading day.
Unlike standard IB indicators, this script features Smart Alerts that are time-filtered. You can define a specific "Active Alert Window" (e.g., RTH only) to ensure you are notified of breakouts during key hours, while avoiding spam notifications during overnight or low-volume sessions.
Key Features:
1. Customizable Initial Balance
Flexible Session: Define the exact start and end time for your IB calculation (Default: 08:30–09:30).
Visual Clarity: Plots IB High, IB Low, and the 50% Midpoint with fully customizable line styles, colors, and widths.
2. Smart Time-Filtered Alerts
Breakout Detection: Triggers an alert when price crosses above the IB High or below the IB Low.
Session Filter: Includes a unique "Allowed Alert Time" input. Alerts will only fire if the breakout happens within this window (Default: 08:30–15:00), preventing unwanted notifications during overnight chop.
3. Advanced Extensions & Targets
Extensions: Option to display multiples of the IB range (2x, 3x) to serve as statistical targets for trend days.
Intermediate Levels: Option to display half-step extensions (e.g., 1.5x) for tighter scalping targets.
4. IB Delta Analytics Dashboard
Context is Key: An optional on-screen dashboard tracks the size of the Initial Balance over the last 20 days.
Sentiment: Automatically categorizes today's IB as "Huge," "Medium," or "Small" compared to the 20-day average. This helps you anticipate if the day is likely to be a "Range Day" (Large IB) or a "Trend Day" (Small IB).
Settings Overview:
Calculation Period: The time used to measure the high and low (e.g., first 60 mins).
Allowed Alert Time: The window during which alerts are active.
Show Extra Levels: Toggles the 2x and 3x extensions.
Fill IB Areas: Adds a background color to the opening range for better visibility.
Delta Analytics: Toggles the statistics table on/off.
Author's Instructions
How to Configure the Time Settings: This script uses two distinct time inputs to give you maximum control:
"Calculation period": This is when the script measures the High and Low.
Example: 0830-0930 (The first hour of the NYSE session).
"Allowed Alert Time (RTH)": This is when the script is allowed to send you alerts.
Example: 0830-1500 (The full trading day).
Why this matters: If price breaks the IB High at 18:00 (during the overnight session), the script will ignore it if your alert time ends at 15:00. This saves you from waking up to low-probability signals.
Setting Up Alerts: To activate the alerts, add the indicator to your chart, click the "Alerts" button (clock icon) in the top toolbar, select this indicator from the "Condition" list, and choose "Any alert() function call".
Disclaimer: This tool is for informational purposes only. Past performance does not guarantee future results.

Super-AO with Risk Management Alerts Template - 11-29-25Super-AO with Risk Management: ALERTS & AUTOMATION Edition
Signal Lynx | Free Scripts supporting Automation for the Night-Shift Nation 🌙
1. Overview
This is the Indicator / Alerts companion to the Super-AO Strategy.
While the Strategy version is built for backtesting (verifying profitability and checking historical performance), this Indicator version is built for Live Execution.
We understand the frustration of finding a great strategy, only to realize you can't easily hook it up to your trading bot. This script solves that. It contains the exact same "Super-AO" logic and "Risk Management Engine" as the strategy version, but it is optimized to send signals to automation platforms like Signal Lynx, 3Commas, or any Webhook listener.
2. Quick Action Guide (TL;DR)
Purpose: Live Signal Generation & Automation.
Workflow:
Use the Strategy Version to find profitable settings.
Copy those settings into this Indicator Version.
Set a TradingView Alert using the "Any Alert() function call" condition.
Best Timeframe: 4 Hours (H4) and above.
Compatibility: Works with any webhook-based automation service.
3. Why Two Scripts?
Pine Script operates in two distinct modes:
Strategy Mode: Calculates equity, drawdowns, and simulates orders. Great for research, but sometimes complex to automate.
Indicator Mode: Plots visual data on the chart. This is the preferred method for setting up robust alerts because it is lighter weight and plots specific values that automation services can read easily.
The Golden Rule: Always backtest on the Strategy, but trade on the Indicator. This ensures that what you see in your history matches what you execute in real-time.
4. How to Automate This Script
This script uses a "Visual Spike" method to trigger alerts. Instead of drawing equity curves, it plots numerical values at the bottom of your chart when a trade event occurs.
The Signal Map:
Blue Spike (2 / -2): Entry Signal (Long / Short).
Yellow Spike (1 / -1): Risk Management Close (Stop Loss / Trend Reversal).
Green Spikes (1, 2, 3): Take Profit Levels 1, 2, and 3.
Setup Instructions:
Add this indicator to your chart.
Open your TradingView "Alerts" tab.
Create a new Alert.
Condition: Select SAO - RM Alerts Template.
Trigger: Select Any Alert() function call.
Message: Paste your JSON webhook message (provided by your bot service).
5. The Logic Under the Hood
Just like the Strategy version, this indicator utilizes:
SuperTrend + Awesome Oscillator: High-probability swing trading logic.
Non-Repainting Engine: Calculates signals based on confirmed candle closes to ensure the alert you get matches the chart reality.
Advanced Adaptive Trailing Stop (AATS): Internally calculates volatility to determine when to send a "Close" signal.
6. About Signal Lynx
Automation for the Night-Shift Nation 🌙
We are providing this code open source to help traders bridge the gap between manual backtesting and live automation. This code has been in action since 2022.
If you are looking to automate your strategies, please take a look at Signal Lynx in your search.
License: Mozilla Public License 2.0 (Open Source). If you make beneficial modifications, please release them back to the community!

ICT PDA - Gold & BTC (QuickScalp Bias/FVG/OB/OTE + Alerts)What this script does
This indicator implements a complete ICT Price Delivery Algorithm (PDA) workflow tailored for XAUUSD and BTCUSD. It combines HTF bias, OTE zones, Fair Value Gaps, Order Blocks, micro-BOS confirmation, and liquidity references into a single, cohesive tool with early and final alerts. The script is not a mashup for cosmetic plotting; each component feeds the next decision step.
Why this is original/useful
Symbol-aware impulse filter: A dynamic displacement threshold kTune adapts to Gold/BTC volatility (body/ATR vs. per-symbol factor), reducing noise on fast markets without hiding signals.
Scalping preset: “Quick Clean” mode limits drawings to the most recent bars and keeps only the latest FVG/OB zones for a clear chart.
Three display modes: Full, Clean, and Signals-Only to match analysis vs. execution.
Actionable alerts: Early heads-up when price enters OTE in the HTF bias direction, and Final alerts once mitigation + micro-break confirm the setup.
How it works (high-level logic)
HTF Bias: Uses request.security() on a user-selected timeframe (e.g., 240m) and EMA filter. Bias = close above/below HTF EMA.
Dealing Range & OTE: Recent swing high/low (pivot length configurable) define the range; OTE (62–79%) boxes are drawn contextually for up/down ranges.
Displacement: A candle’s body/ATR must exceed kTune and break short-term structure (displacement up/down).
FVG: 3-bar imbalance (bull: low > high ; bear: high < low ). Latest gaps are tracked and extended.
Order Blocks: Last opposite candle prior to a qualifying displacement that breaks recent highs/lows; zones are drawn and extended.
Entry & Alerts:
Long: Bullish bias + price inside buy-OTE + mitigation of a bullish FVG or OB + micro BOS up → “PDA Long (Final)”.
Short: Bearish bias + price inside sell-OTE + mitigation of a bearish FVG or OB + micro BOS down → “PDA Short (Final)”.
Early Alerts: Trigger as soon as price enters OTE in the direction of the active bias.
Inputs & controls (key ones)
Bias (HTF): timeframe minutes, EMA length.
Structure: ATR length, Impulse Threshold (Body/ATR), swing pivot length, OB look-back.
OTE/FVG/OB/LP toggles: show/hide components.
Auto-Tune: per-symbol factors for Gold/BTC + manual tweak.
Display/Performance: View Mode, keep-N latest FVG/OB, limit drawings to last N bars.
Recommended usage (scalping)
Timeframes: Execute on M1–M5 with HTF bias from 120–240m.
Defaults (starting point): ATR=14, Impulse Threshold≈1.6; Gold factor≈1.05, BTC factor≈0.90; Keep FVG/OB=2; last 200–300 bars; View Mode=Clean.
Workflow: Wait for OTE in bias direction → see mitigation (FVG/OB) → confirm with micro BOS → manage risk to nearest liquidity (prev-day H/L or recent swing).
Alerts available
“PDA Early Long/Short”
“PDA Long (Final)” / “PDA Short (Final)”
Attach alerts on “Any alert() function call” or the listed conditions.
Chart & screenshots
Please include symbol and timeframe on screenshots. The on-chart HUD shows the script name and state to help reviewers understand context.
Limitations / notes
This is a discretionary framework. Signals can cluster during news or extreme volatility; use your own risk management. No guarantee of profitability.
Changelog (brief)
v1.2 QuickScalp: added Quick Clean preset, safer array handling, symbol-aware impulse tuning, display modes.
------------------------------
ملخص عربي:
المؤشر يطبق تسلسل PDA عملي للذهب والبتكوين: تحيز من فريم أعلى، مناطق OTE، فجوات FVG، بلوكات أوامر OB، وتأكيد micro-BOS، مع تنبيهات مبكرة ونهائية. تمت إضافة وضع “Quick Clean” لتقليل العناصر على الشارت وحساسية إزاحة تتكيّف مع الأصل. للاستخدام كسكالب: نفّذ على M1–M5 مع تحيز 120–240 دقيقة، وابدأ من الإعدادات المقترحة بالأعلى. هذا إطار سلوكي وليس توصية مالية.

Open Range Breakout (ORB) with Alerts
🚀 ChartsAlgo – Open Range Breakout (ORB) with Alerts
The Open Range Breakout (ORB) Indicator by ChartsAlg is designed for intraday traders looking to capitalize on price movements after the market’s opening range. This tool is especially effective for futures (MNQ, MES) and high-volatility stocks or crypto where initial volatility sets the tone for the session.
This indicator identifies a user-defined opening range window, plots the high/low lines of that range, and visually alerts users when price breaks out above or below the range — with options to customize breakout repetitions, background fill, and alerts.
💡 What is an Open Range Breakout (ORB)?
The opening range represents the high and low established during the first few minutes of the trading session — usually 15 or 30 minutes. Many intraday strategies are based on the idea that breaking out of this initial range often signals strong momentum and trend continuation.
Traders often enter:
Long when price breaks above the range high.
Short when price breaks below the range low.
⚙️ How It Works
You define a session window (e.g., 09:30–09:45 EST).
The indicator tracks the high and low during this time.
Once the session ends, the high and low become your range breakout levels.
The indicator then:
Plots lines for visual clarity
Optionally fills background between the range
Triggers breakout signals if price crosses the levels
Provides alerts when breakouts occur
🛠️ Settings Breakdown
🔹 Session Settings
Range Session: Set your preferred window (e.g., 0930–0945). Can be premarket, first 30 mins, or any custom time.
Time zone: Use "America/New York" for EST (default) or change to "GMT+0" for international traders.
🔹 Breakout Settings
Bullish Breakout Signals: Number of allowed breakout alerts above the range.
Bearish Breakout Signals: Number of allowed breakout alerts below the range.
This prevents repeated alerts once breakout has been confirmed.
🔹 Display Settings
Show Background Fill: Fills area between high/low of the range for easier visual analysis.
Show Breakout Signals: Triangle markers plotted on the chart when breakouts happen.
Only Show Today’s Range: Keeps the chart clean by showing only the most current day’s range.
🔹 Color Settings
Range High/Low Line Colors: Choose any color for clarity.
Range Fill Color: Customize the highlight area for your chart style.
📊 Chart Features
Range High/Low Lines: Automatically plotted after range session ends.
Visual Fill Box: Optional background shading between the opening range.
Triangle Breakout Markers: Appear at the breakout candle.
Alerts: Can be used with TradingView’s alert system to notify you of breakouts in real-time.
🔔 Alerts
Two alert conditions are built in:
Bullish Breakout: Triggers when price breaks above the high of the range.
Bearish Breakout: Triggers when price breaks below the low of the range.
Example Alert Message:
📈 “Bullish Breakout above Open Range on AAPL!”
To activate:
Click “🔔 Alerts” on TradingView.
Set condition to this script.
Choose “ORB Breakout Up” or “ORB Breakout Down”.
Choose alert frequency and notification method.
⚠️ DISCLAIMER
ChartsAlgo tools are for informational and educational purposes only.
They are not financial advice or signals. Past performance does not guarantee future results. Use at your own risk and always implement solid risk management.
By using this indicator, you agree that you are solely responsible for any trades or decisions made based on the information provided.

Vietnamese Stocks: Multi-Ticker Fibonacci AlertThis Pine Script™ indicator is designed specifically for traders monitoring the Vietnamese stock market (HOSE, HNX). Its primary goal is to automate the tracking of Fibonacci retracement levels across a large list of stocks, alerting you when prices breach key support zones.
Core Functionality:
The script calculates Fibonacci retracement levels (23.6%, 38.2%, 50%, 61.8%, 78.6%) for up to 40 tickers simultaneously. The calculation is based on the highest high and lowest low identified since a user-defined Start Time. This allows you to anchor the Fibonacci analysis to a specific market event, trend start, or time period relevant to your strategy.
What it Does For You:
Automated Watchlist Scanning: Instead of drawing Fib levels on dozens of charts, select one of the two pre-configured watchlists (up to 40 symbols each, customizable in settings) populated with popular Vietnamese stocks.
Time-Based Fibonacci: Define a Start Time in the settings. The script uses this date to find the subsequent highest high and lowest low for each symbol in your chosen watchlist, forming the basis for the Fib calculation.
Intelligent Alerts: Get notified via TradingView's alerts when the candle closing price of any stock in your active watchlist falls below the critical 38.2%, 50%, 61.8%, or 78.6% levels relative to its own high/low range since the start time. Alerts are consolidated for efficiency.
Visual Aids:
- Plots the same time-based Fibonacci levels directly on your current chart symbol for quick reference.
- Includes an optional on-chart table showing which monitored stocks are currently below key Fib levels (enable "Show Debug Info").
- Features experimental background coloring to highlight potential bullish signals on the current chart.
Configuration:
Start Time: Crucial input – sets the anchor point for Fib calculations.
WatchList Selection: Choose between WatchList #1 (Bluechip/Midcap focus) or WatchList #2 (Defensive/Other focus) using the boolean toggles.
Symbol Customization: Easily replace the default symbols with your preferred Vietnamese stocks directly in the indicator settings.
Notification Prefix: Add custom text to the beginning of your alert messages.
Alert Setup: Remember to create an alert in TradingView, selecting this indicator and the alert() condition, usually with "Once Per Bar Close" frequency.
This tool is open-source under the MPL 2.0 license. Feel free to use, modify, and learn from it.

5 Consecutive Candle Alert Multi-TimeframeMaximize your trading strategy with our sophisticated "5 Consecutive Candle Alert Multi-Timeframe" indicator, designed for the TradingView platform using Pine Script version 6. This custom indicator is meticulously crafted to monitor five consecutive green or red candles across multiple key timeframes, including 1-minute, 5-minute, 15-minute, 1-hour, and 4-hour charts.
**Key Features:**
- **Multi-Timeframe Analysis:** Simultaneously tracks and alerts on consecutive candle patterns across five different timeframes, providing a comprehensive view of market momentum and trend consistency.
- **Custom Alerts:** Receive real-time notifications when five consecutive green or red candles close on any of the specified timeframes. These alerts are tailored to keep you abreast of significant market movements, enabling timely and informed trading decisions.
- **Easy Visualization:** Uses distinct plotting features to clearly mark the occurrence of these patterns directly on your trading chart. Green labels below the bar indicate a bullish streak, while red labels above the bar denote a bearish streak, making it visually intuitive.
- **Precision and Confirmation:** Integrates Pine Script's `barstate.isconfirmed` to ensure alerts are based on fully formed candles, adding an extra layer of precision to your trading signals.
**Ideal for Traders Who:**
- Are momentum or trend traders looking for clear signals of market continuation or potential exhaustion.
- Want to enhance their trading decisions by analyzing behavior across multiple timeframes from a single chart.
- Prefer to be alerted about significant events without the need to constantly monitor the charts.
**How to Use:**
Simply add this script to your TradingView chart, customize the alert settings in the TradingView UI according to your preferences, and start receiving alerts that help you capitalize on market movements efficiently and effectively.
Leverage the power of advanced scripting to make your trading as proactive and responsive as possible. Try out our "5 Consecutive Candle Alert Multi-Timeframe" indicator today and experience a significant improvement in your trading approach!