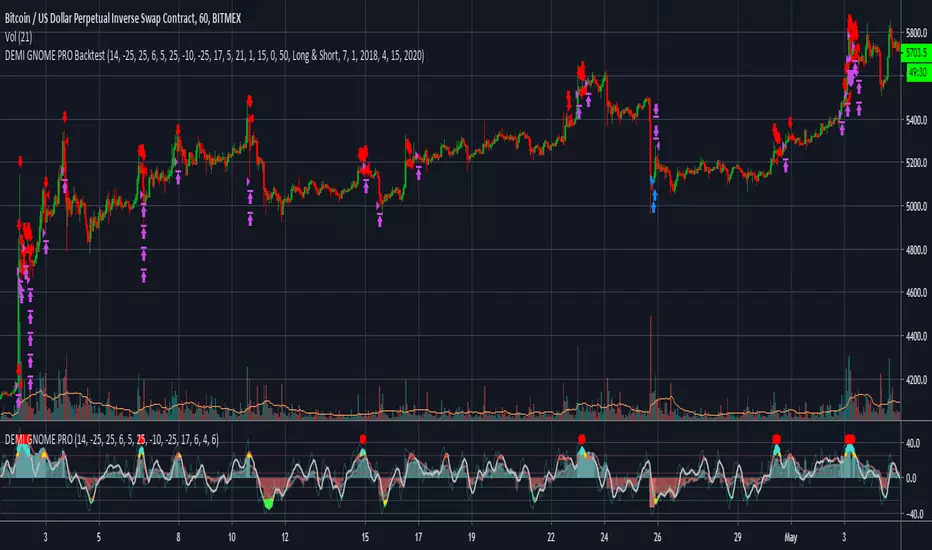
DEMI GNOME PROHello Fellow Traders!
-------------------------------------------
This is the newest addition to Gnome Alerts PRO
This is one of the newer scripts that we are using for scalping on the lower time frames on Bitmex & Binance.
This is a transformed version of GODMODE that adapts to market swings.
INCLUDES:
------------------------
*Autoview Ready*
BUY ALERTS
- multiple long positions
SELL ALERTS
- sell with oversold alerts
- sell based of %gain
Short Alerts For Bitmex
Backtesting is also available!
More info on how gain access in my profile!
Cari dalam skrip untuk "alert"
CM_Ultimate_MA_MTF_V2 with Alert Long and Short Hello All,
Here is a scirpt of ChrisMoody modified with the alerts of purchases and sales.
I just have a problem with automation. At the bottom of my script my alerts "Buy1" and "Sell2" give alerts constantly and I wish to have a single alert before the order is completed. Before "Sell1" or Buy2 ".
I found the function "barstate.isfirst" that could possibly work?
Does anyone have an idea ? :)

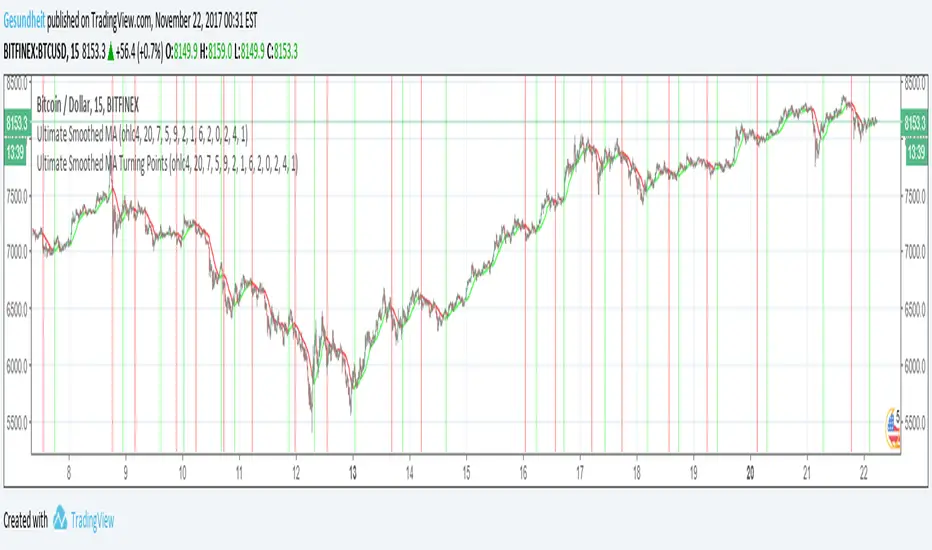
Ultimate Smoothed MA Turning PointsCompanion script to "Ultimate Smoothed MA" , details in that description.
Adapted from Chris Moody's "Ultimate Moving Average-Multi-TimeFrame-7 MA Types"
If you'd like to receive alerts on turning points, the conditions in line 96 and 97 can be used for alertcondition.
Trend-following Microprofit w/ Smart DCA BACKTESTING VERSIONCompanion to the alert script:
Tradingview doesn't like backtesting with too little capital or trade sizes less than 1 share, so the "Net Profit" number may not be accurate right off the bat. To get a better idea, change the order size or initial capital so the strategy is trading the appropriate % of initial capital. For example, if your personal capital is $2000 and you are making $100 trades, your trades are 5% of initial capital. That is roughly equivalent to the defaults using orders of 1 BTC with $100,000 capital.
Tightening the stop level will improve the Net Profit to Max Drawdown ratio, making the strategy more suitable for large trade sizes.
This script does not provide alerts for Gunbot. Find the settings you like using this strategy script, then plug those values into the alert script.
If you like this you can buy me chocolate below. Cheers!

Double Bottom Chart Pattern with alertDouble bottom is a very common chart pattern, as its name indicates, it consists of two bottoms, and these two bottoms need to be in a relative flat price level. One of the bottom can't be much higher or lower than the other.
This indicator will detect and highlight double bottom pattern automatically on chart and alert you via SMS, email and sound.
Features:
Adjust the threshold between two bottoms.
Adjust the number of bars used to form each bottom.
Check if the first bottom is the highest in a given number of bars
Adjust the number of bars between two bottoms.
Switch of alert.
It works on all timeframes and any symbol.
You can also load more than one with different inputs to get more results on chart.

Double Top Chart Pattern detector with alert
Double top is a very common chart pattern, as its name indicates, it consists of two tops, and these two tops need to be in a relative flat price level. One of the top can't be much higher or lower than the other.
This indicator will detect and highlight double top pattern automatically on chart and alert you via SMS, email and sound.
Features:
Adjust the threshold between two tops.
Adjust the number of bars used to form each top.
Check if the first top is the highest in a given number of bars
Adjust the number of bars between two tops.
Switch of alert.
A detailed instruction will show you how to properly adjust each input.
It works on all timeframes and any symbol.
You can also load more than one with different inputs to get more results on chart.

Auto Trendline, Upper Descending Trend line detector with alertThis is a custom Tradingview indicator that automatically plots descending trend lines above price bars. It will alert when the price closes above the trend line.
The concept is straightforward: the trend line is formed by two adjacent peaks when the price is in a downtrend. It will save a lot of time for people (just like me) who uses trendline often.
By deploying this indicator, should the condition meet, you don't need to draw the trend lines by hand anymore. You can also consider it as a trend line reminder.
It's also very easy to use, just load it on chart and set your desired inputs.
Features:
Adjust the strength of the 2 peaks that form the trend line.
Set price difference between two peaks in two variables: amount or percentage.
Turn on/off the cross above alert.
It works on all symbols and all timeframes.
never paint
A detailed instruction will show you how to properly adjust each input.

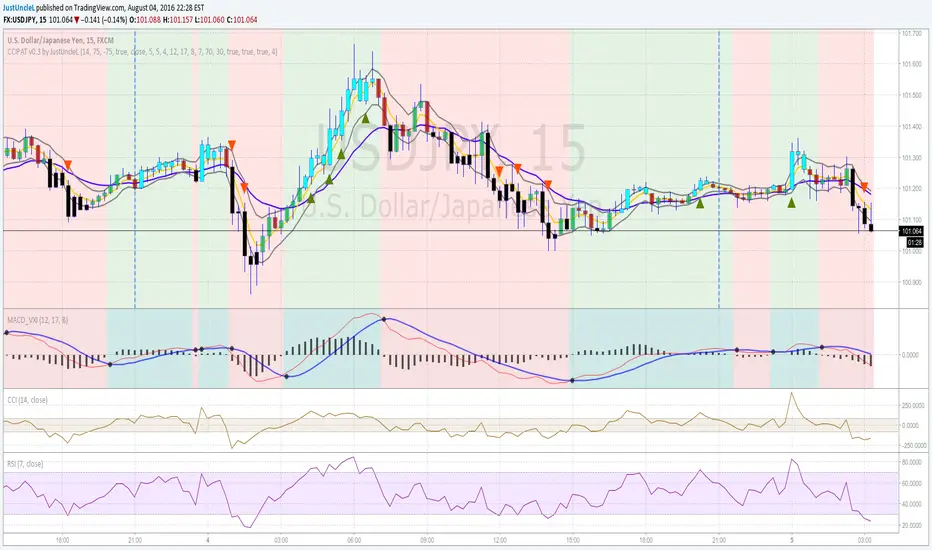
Price Action Trading System v0.3 by JustUncleLThis is an updated and improved version of my "Price Action Trading strategy". I have added two extra optional filters, one is a trend direction filter based on the MACD slow EMA(17), blue line, and the other is a RSI(7) filter which works similarly to CCI(14) but slightly different dynamics (thank you to gianfranco60 for the suggestion). Also made a couple of corrections:
- input for lenLower minval=1 should be maxval=-1
- one bar pullback did not reset trigger, missing some alerts
Some Notes about usage:
- this is an alert indicator not a signal generator, each alert is a strong trend continuance candidate,
but should be treated on it's own merits by looking at chart dynamics and market conditions.
- will work well on trending markets only.
- works best on the first alert after MACD cross over.
- don't take trades when MACD and signal are close together.
- don't trade when channel and slow MA are flat or close together or
chopper (yellow and blue MA cross over quickly over short period).
[AutoView] Trailing Stop Back Testing and alerts + TP and TSThe number one request since the creation of autoview was to have alerts triggered for Take Profit, Stop Loss and Trailing Stops. Finally, we've figured it out, and as an additional bonus, this allows us to back test trailing stops in the strategy tester.
YouTube Video about this script and setup: bit.ly
This script contains 2 things people have been asking for, multiple time frames and of course, a trailing stop that can be both back tested and setup for alerts.
This strategy itself seems to perform better without the use of the Trailing Stop, so play around and monitor it before actually trying to trade it live.
View all the trades being tracked in a Google Sheets here: bit.ly
To learn more about back testing strategies, automation and AutoView join our free slack group via slack.crypto.pink
Referral Tax:
This requires 4 alerts, so you are going to have to upgrade to PRO. It'd be greatly appreciated if you signed up using our referral link.
bit.ly
1Broker
bit.ly
okcoin
bit.ly

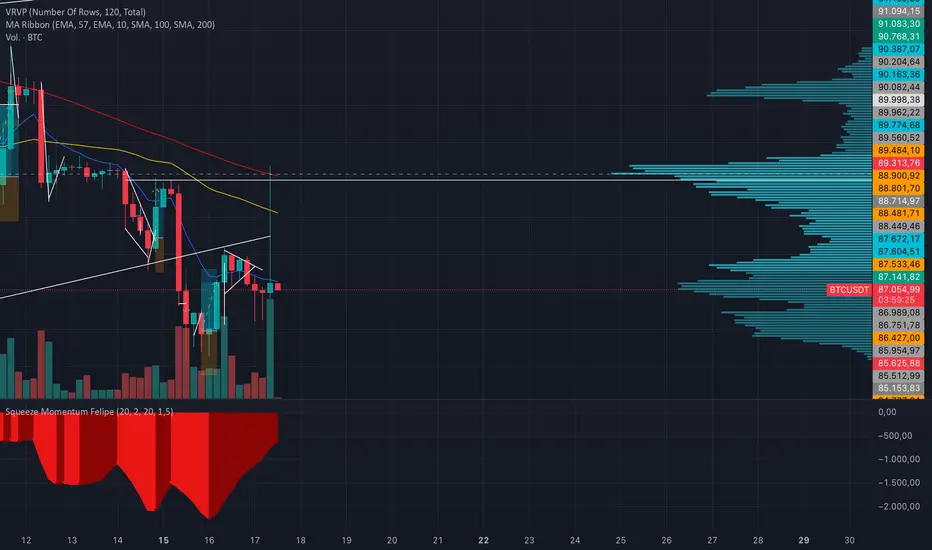
Squeeze Momentum con AlertasSqueeze Momentum with alerts to detect pattern changes from light green to dark green or from light red to dark red.
Best used in combination with ADX.
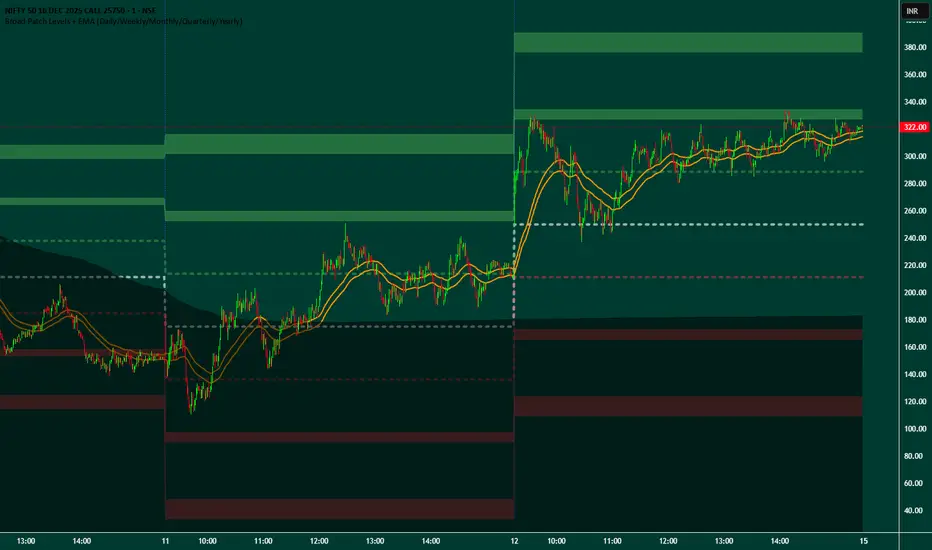
Broad Patch Levels + EMA (Daily/Weekly) with Directional AlertsThis indicator provides dynamic support and resistance levels along with trend guidance using EMA lines for daily or weekly timeframes. It is fully customizable, offering toggles for individual levels, trend lines, and alert notifications.
Key highlights:
Clearly visualize key market levels for potential trade entries and exits.
Monitor trend direction with EMA-based guidance.
Receive alerts when price interacts with important levels or trend zones.
Configurable visibility and alert options for a clean and personalized chart layout.
Ideal for professional traders looking for a structured, easy-to-read market perspective without exposing proprietary methods or calculations.
Triple MA Candle Alert - FINALTitle:
Triple MA Candle Alert — Trend Shift Buy & Sell Signals
Short Title:
Triple - MA - Alert
Tags:
moving-average, trend, crossover, buy-sell, momentum, market-structure, signal, entry
Short Description:
A triple moving average trend indicator that highlights BUY and SELL signals at confirmed trend shifts.
Full Description:
The Triple MA Candle Alert indicator is a trend-following tool designed to detect clear bullish and bearish market transitions using a three–moving-average alignment system.
It focuses on identifying moments when short-term momentum aligns decisively with the broader trend, signaling potential entry opportunities.
The indicator highlights only the initial candle of a new trend phase, helping traders avoid late entries and excessive chart noise.
How It Works
The script monitors the relationship between three moving averages representing short-, mid-, and longer-term market behavior.
A signal is triggered when these averages align in a consistent directional order, indicating a confirmed trend shift.
BUY signal: when bullish alignment begins
SELL signal: when bearish alignment begins
Only the first candle of the new alignment is highlighted to mark the transition point clearly.
Key Features
Triple moving average trend confirmation
Clear BUY and SELL signals at trend transitions
Candle coloring only on the signal bar (no repainting)
Supports multiple MA calculation types (SMA, EMA, WMA, RMA)
Optional on-chart MA labels for clarity
Built-in alerts for BUY and SELL signals
Compatible with all markets and timeframes
Use Cases
Identifying early trend reversals
Trend-following entry confirmation
Filtering trades in trending markets
Supporting swing and intraday trading strategies
Confluence tool with price action or support/resistance
Notes
Signals are generated only at confirmed trend changes.
The indicator does not repaint.
Best results are achieved when used with proper risk management and higher-timeframe trend analysis.
Disclaimer
This script is for educational and analytical purposes only and does not constitute financial advice.
Trading involves risk; always confirm signals before executing trades.
Developer
Developed by Abdulrahman Alotaibi ..

IDX - 7UP v6 ENHANCED alertsIDX-7UP v6 ENHANCED — Short Public Description
IDX-7UP v6 ENHANCED is a multi-confirmation trend system built for FX, indices, commodities, and metals.
It combines Supertrend, multi-asset strike levels, volume momentum, standard-deviation zones, support/resistance, RSI, ADX, and session behavior to generate high-probability BUY/SELL signals.
The indicator includes four signal types:
REV (reversal), CONT (trend continuation), STRK (strike-momentum break), and SESS (session re-entry).
Each signal is scored using an 8-point confirmation model to ensure quality.
Features include:
• Auto-strike detection for 10 symbols
• Optional simple or detailed chart labels
• Daily SD levels, S/R, ADX-colored trend MA
• Volume spike detection
• Full dashboard with trend, RSI, ADX, volume, and last signal info
• Buy/Sell alerts included
Designed for traders who want structured, strike-based trend detection with strong filtering and clean visual signals.
Alerts
The script includes three alert types:
Buy Signal, Sell Signal, Any Signal Detected
Alerts fire immediately when confirmation thresholds are met.
Confirmation Scoring (0-8 Points)
Every signal passes through an 8-point confirmation system including:
Strike proximity or strike alignment
Daily Standard-Deviation levels (+1, +0.3, -0.3, -1)
Support/Resistance breaks or bounces
Volume filter or high-volume continuation
RSI momentum (OB/OS or rising/falling sequences)
ADX trend-strength filter
SMA-based trend alignment (SMA8 & SMA21)
Signals must meet your minimum confirmation threshold before triggering.

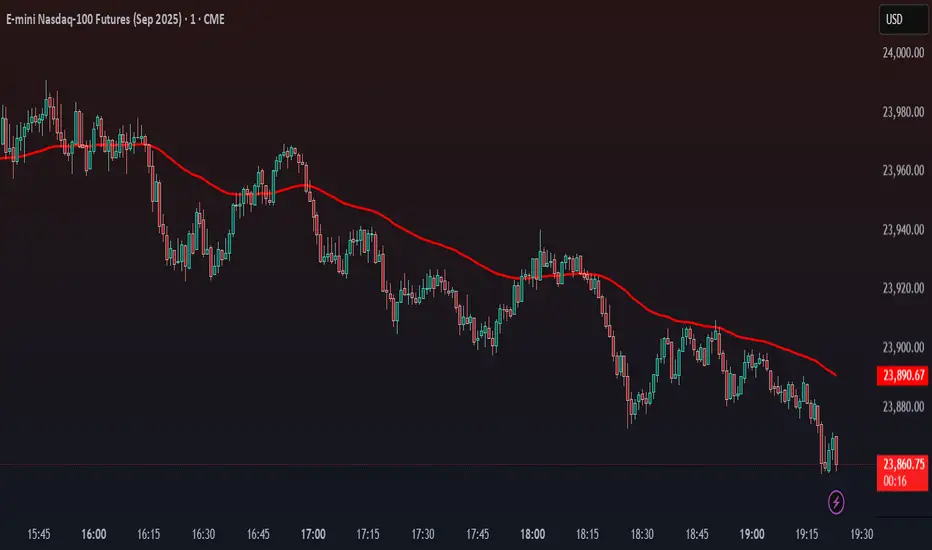
SMT + CVD (NQ vs ES) w/ AlertsSMT + CVD (NQ vs ES) w/ Alerts
This tool combines Smart Money Technique (SMT) and Cumulative Volume Delta (CVD) to highlight high-probability inflection points on NQ (primary) versus ES (secondary).
How it works
SMT condition: the primary breaks its most recent swing (High for bearish / Low for bullish) while the secondary does not break the corresponding swing within a small retest window.
CVD confirmation: at the same time, the primary’s CVD shows divergence (higher price but lower/equal CVD for shorts, lower price but higher/equal CVD for longs).
When both align, the script plots a marker/label and draws a line from the primary swing to the signal bar. Alerts are fired.
Signals & Alerts
Labels: “SMT+CVD DOWN/UP” on the signal bar.
Lines: connects the primary swing → signal bar so you can see the structure that produced the signal.
Alert names: “SMT+CVD Bearish” and “SMT+CVD Bullish.”
Inputs
Primary / Secondary symbols: defaults NQ & ES (you can change them).
Resolution: use chart timeframe or specify one.
Swing Left/Right Bars: pivot detection depth (higher = larger swings).
Break Window Bars: how many bars the secondary has to not break for SMT to be valid.
CVD Up/Down By: Close vs Previous Close (default) or Close vs Open.
Anchor CVD Daily: resets CVD at session/day start.
CVD Smoothing (EMA): smooths the CVD line (optional show).
FAST Pivots (no future bars): left-only swing detection so signals appear sooner and behave well in Replay/live.
Require Secondary Pivot: if ON, SMT checks wait for a confirmed secondary swing; if OFF, signals can appear while the secondary swing is still forming (useful for Replay/testing).
Show CVD line: optional, may compress price scale.
Non-repaint notes
With FAST Pivots ON, swings are detected with no future bars (minimal latency = leftBars).
With FAST Pivots OFF, standard pivots require rightBars future bars to confirm the swing (classic, but naturally delayed).
Tips
For intraday futures, keep leftBars/rightBars small (e.g., 3/3) and Break Window 1–3.
In Replay, enable FAST Pivots and consider disabling Require Secondary Pivot if you want signals to appear as soon as the primary breaks.
Combine with session filters, execution rules, or liquidity zones for context.

Breakout Volume AlertThis indicator helps traders identify true breakouts confirmed by strong volume.
It automatically highlights candles where the current bar’s volume is greater than 1.5× the 10-bar average volume, confirming institutional participation and momentum strength.
How It Works:
A yellow line tracks the 10-bar volume average.
When current volume exceeds 1.5× the average, the bar turns green — signaling strong buying/selling interest.
Normal or weak bars remain faded red.
You can use this with your Price Action + Multi-Timeframe strategy to validate breakouts, retests, and reversals
Best Used For:
Breakout + Retest confirmation (Intraday or Swing)
Volume spike detection before momentum moves
Filtering fake breakouts with low participation
Works perfectly with 5m / 15m / 30m / 4H charts
Settings:
Default volume average length = 1
Volume strength multiplier = 1.5×
Add alert: "Volume > 1.5x average" for instant notifications

Price Above PDH - Complete Multi-Confirmation Alert
Cashapp $jmoskyhigh
Initial Breakout: Must have ALL confirmations to even start counting
During Hold Period: If ANY confirmation fails at ANY bar, the counter RESETS to zero
Must Re-qualify: If confirmations fail, must cross PDH again with all confirmations to restart
Alert Only Fires: When ALL confirmations are continuously met for the ENTIRE hold period
3. Visual Feedback:
Green background: Above PDH + ALL confirmations present
Red background: Above PDH but MISSING one or more confirmations
Red X above bar: Shows when a confirmation is lost during breakout (counter resets)
Green triangle with "✓ ALL": Alert triggered after full confirmation period
4. Example Scenario:
Scenario 1 - SUCCESS:
Bar 1: Price crosses PDH, Volume spike, MA bullish, Above VWAP → Counter = 1
Bar 2: Still above PDH, ALL confirmations still met → Counter = 2
Bar 3: Still above PDH, ALL confirmations still met → Counter = 3
Bar 4: Still above PDH, ALL confirmations still met → Counter = 4
Bar 5: Still above PDH, ALL confirmations still met → Counter = 5 → ALERT!
Scenario 2 - FAILURE (resets):
Bar 1: Price crosses PDH, Volume spike, MA bullish, Above VWAP → Counter = 1
Bar 2: Still above PDH, ALL confirmations still met → Counter = 2
Bar 3: Still above PDH, but volume drops below threshold → RESET Counter = 0
Bar 4: Still above PDH, ALL confirmations back → Counter = 1 (starts over)
5. Info Panel:
Shows which specific confirmations are failing
"OFF" displayed for disabled confirmations
Big "ALL CONFIRMED" row shows overall status
Warning message if confirmations are lost during breakout
This ensures you only get alerts when the setup is truly strong with ALL confirmations maintained throughout the entire hold period! 🎯

QT Insights [Pro +]: PSP + TPD Alerts | [cephxs]This indicator's primary function is to highlight chart candlestick divergence with candle closes.
*A full list of the Supported Correlated Asset Pairings (CAPs) will be linked at the bottom.
There are two primary operating modes
PSP Only
All precision candles
There is a tooltip describing what each operating mode does in the indicator settings
Asset Selection
The indicator handles asset selection for divergences automatically for a large variety of asset(s) classes automatically and is ready for use Out of the Box with Major Assets like:
CME_MINI:NQ1! , CME_MINI:ES1! , CBOT_MINI:YM1!
It also works with non-futures for indices (CFD), for best functionality with no stress, we only have support for the following brokers. CAPITALCOM, VANTAGE, OANDA
It works with Forex, Crypto and Energies, also works with Metals.
The default pairings are determined by the active chart
i.e CME_MINI:NQ1! will pair with Asset 2 as CME_MINI:ES1! and Asset 3 as CBOT_MINI:YM1!
Alerts
This version has alerts, I will create a tutorial for that. You can use the alerts by adding alerts and selecting the indicator from the "Contdition" Dropdown in the Alert Creation Pop-up
Customizations
The indicator is fully customizable in the Styles tab under the settings
Play around with it and determine what works best with your aesthetic, it comes out of the box with a lot of clutter and as you can see in the showcase image, it's clean and functional, just how I like it.
*Supported CAPs
CFD
Forex:
EURUSD / GBPUSD (FOREXCOM Only)
Indices:
NAS100 / SPX500 / US 30 (CAPITALCOM / Vantage / Oanda Only)
Metals:
XAUUSD / XAGUSD
Futures
Indices:
NQ / MNQ , ES / MES , YM / MYM
Metals:
GC / MGC , SI / SIL
Crypto
BTCUSD / ETHUSD, this will work for any asset with "BTC" or "ETH" in the asset name
Note: There is support for Micro contracts automatically
Subsequent Updates Will be posted, Stay tuned.
Note: I wrote this description on the fly so there might be flaws, Regardless, made with ❤️ by cephxs

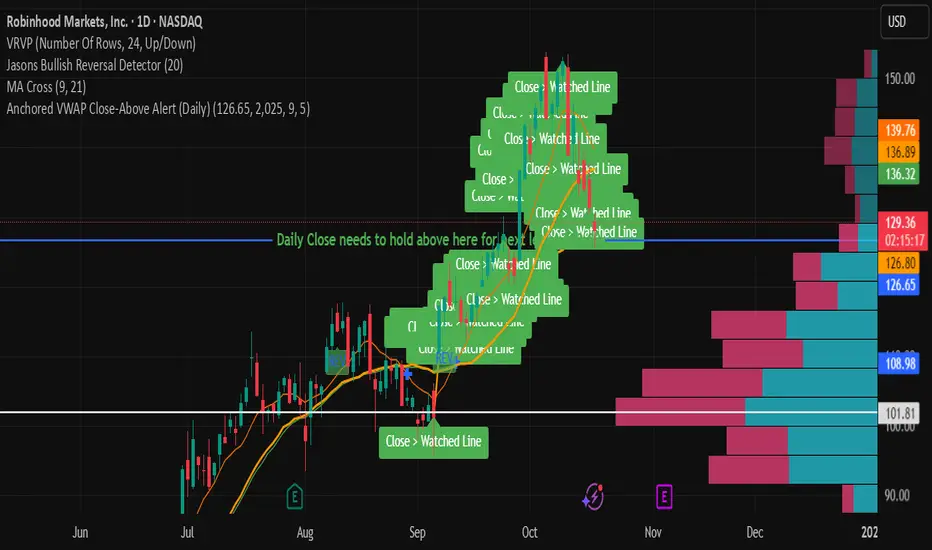
Anchored VWAP Close-Above Alert (Daily)This indicator is a daily anchored VWAP (Volume-Weighted Average Price) tracker that alerts you when price closes above a key pivot line you’ve defined — either dynamically (anchored VWAP from a date like 9/5) or statically (a fixed level like 126.65).
Here’s how each piece works:
1. The anchor date
You give it a date — say September 5, 2025. The script starts calculating VWAP from that day forward. That line represents the average price buyers and sellers have transacted at since that anchor. It’s a kind of “fair-value line” for that period.
2. The logic
Every bar after that date, it adds up (price × volume) and divides by total volume — giving a running VWAP from that starting point. You can instead lock it to a flat number (like 126.65) if you don’t want it recalculating.
3. The alert trigger
Once per day — when the daily candle closes — it checks:
“Did price close above my watched line?”
If yes, it fires an alert (and can draw a label) to tell you that the day’s candle reclaimed that level.
4. The why
That kind of move — a daily close reclaiming a major anchored VWAP — often signals a shift in sentiment or trend strength. Traders watch it to confirm rebounds or invalidations of downside moves.
So in your context:
You anchored to 9/5 (the downside pivot).
You want to know if price closes back above that VWAP (~126.65).
If it does, the alert lights up — confirming the “reclaim” you mentioned in your note.
It’s basically your guard dog for the daily close reclaim.
Ichimoku Cloud Indicator [TradingFinder] Kinko Hyo Cross Alerts🔵 Introduction
The Ichimoku Cloud (Ichimoku Kinko Hyo) is one of the most powerful and complete trading indicators in technical analysis. Originally developed by Japanese journalist Goichi Hosoda, the Ichimoku system combines multiple tools in one indicator, providing traders with instant insights into trend direction, support and resistance levels, and momentum. Unlike simple moving averages (SMA – Simple Moving Average), the Ichimoku Cloud (Kumo – Cloud) integrates dynamic elements that help traders forecast potential price action with greater clarity.
The Ichimoku Indicator (Ichimoku Signal System) is widely used across global markets, from Forex trading (FX – Foreign Exchange) to stocks, indices, and even cryptocurrencies. Its popularity comes from its ability to generate clear buy signals and sell signals based on the interaction of its components: Tenkan Sen (Conversion Line), Kijun Sen (Base Line), Senkou Span A, Senkou Span B, and Chikou Span (Lagging Line). When combined, these lines create the Ichimoku Cloud, which visually represents the balance between price action and market structure.
Ichimoku Cloud Lines Formulas :
Conversion Line (Tenkan Sen / Conversion Line) : Average of the highest high and lowest low over the past 9 periods => (9-PH + 9-PL) ÷ 2
Base Line (Kijun Sen / Base Line) : Average of the highest high and lowest low over the past 26 periods => (26-PH + 26-PL) ÷ 2
Leading Span A (Senkou Span A / Leading Span A) : Average of the Conversion Line and Base Line, plotted 26 periods ahead => (Tenkan Sen + Kijun Sen) ÷ 2
Leading Span B (Senkou Span B / Leading Span B) : Average of the highest high and lowest low over the past 52 periods, plotted 26 periods ahead => (52-PH + 52-PL) ÷ 2
Lagging Span (Chikou Span / Lagging Span) : Current closing price, plotted 26 periods behind.
One of the biggest advantages of the Ichimoku Trading Strategy (Ichimoku Cloud Trading System) is that it allows traders to identify the market condition at a glance. When the price is above the Kumo (Cloud), it indicates a bullish trend (uptrend). When the price is below the Kumo, the market is in a bearish trend (downtrend). And when the price is inside the cloud, the market is ranging (sideways trend). This simplicity and visual clarity make Ichimoku an essential indicator for both beginner traders and professional analysts.
The Ichimoku Cloud Indicator (Ichimoku Technical Analysis Tool) continues to be one of the most reliable charting methods. Traders often consider it superior to basic moving averages (MA – Moving Average) or exponential moving averages (EMA – Exponential Moving Average), because it not only shows trend direction but also highlights potential future support and resistance levels. With its unique combination of trend analysis, price forecasting, and trading signals, Ichimoku remains a core strategy in modern trading systems.
🔵 How to Use
The Ichimoku Cloud is more than just a set of lines; it’s a complete trading system that helps traders identify trends, momentum, and key support and resistance levels. By combining its five lines Conversion Line, Base Line, Leading Span A, Leading Span B, and Lagging Span traders can develop clear buy and sell strategies.
🟣 Identifying Trend Direction
Bullish Trend (Uptrend) : Price is above the cloud (Kumo), and the cloud is green. Leading Span A is above Leading Span B, signaling strong upward momentum.
Bearish Trend (Downtrend) : Price is below the cloud, and the cloud is red. Leading Span A is below Leading Span B, confirming a downward momentum.
Ranging / Sideways Market : Price is inside the cloud, indicating indecision and consolidation. Traders often avoid opening strong positions during these periods.
🟣 Buy Strategies
Conversion/Base Line Crossover : A buy signal occurs when the Conversion Line (Tenkan Sen) crosses above the Base Line (Kijun Sen). The signal is strongest when this crossover happens above the cloud.
Price Above Base Line : If the price moves above the Base Line while in an uptrend, it confirms bullish momentum and provides a favorable entry point.
Cloud Support Pullback : During a pullback in an uptrend, the price may touch or slightly enter the cloud. Traders can use the cloud as a dynamic support zone for buying opportunities.
Lagging Span Confirmation : Ensure the Lagging Span (Chikou Span) is above the price of 26 periods ago to confirm the strength of the bullish trend.
🟣 Sell Strategies
Conversion/Base Line Crossover : A sell signal is generated when the Conversion Line (Tenkan Sen) crosses below the Base Line (Kijun Sen). This signal is strongest when it occurs below the cloud.
Price Below Base Line : If the price falls below the Base Line in a downtrend, it confirms bearish momentum and strengthens the sell setup.
Cloud Resistance Pullback : During a bounce in a downtrend, the cloud acts as a resistance zone. Traders can enter sell positions when price approaches or touches the cloud from below.
Lagging Span Confirmation : The Lagging Span should be below the price of 26 periods ago, confirming downward momentum.
🟣 Cloud Breakout Signals
A strong buy occurs when the price breaks above the cloud from below, signaling a potential trend reversal.
A strong sell occurs when the price breaks below the cloud from above, indicating a shift toward a bearish trend.
🟣 Combining Signals for Stronger Entries
For higher probability trades, combine multiple signals : trend direction (cloud color and position), crossovers (Tenkan/Kijun), and Lagging Span position.
Avoid trading against the overall trend. For example, avoid buying when price is below a red cloud or selling when price is above a green cloud.
🔵 Setting
Tenkan Sen Period : Lookback period for Conversion Line (default: 9).
Kijun Sen Period : Lookback period for Base Line (default: 26).
Span B Period : Lookback period for Leading Span B, forms one Cloud boundary (default: 52).
Shift Lines : Periods forward for Cloud / backward for Lagging Span (default: 26).
Cross Tenkan/Kijun Alert : Alert on Conversion/Base Line crossover.
Cross Price/Tenkan Alert : Alert when price crosses Tenkan Sen.
Cross Price/Kijun Alert : Alert when price crosses Kijun Sen
🔵 Conclusion
The Ichimoku Cloud (Ichimoku Kinko Hyo) is much more than a simple indicator it is a complete trading system that combines trend detection, momentum analysis, and support/resistance identification in one view. By interpreting the position of price relative to the cloud, the interaction between Tenkan Sen (Conversion Line) and Kijun Sen (Base Line), the leading spans (Senkou Span A and B), and the Chikou Span (Lagging Line), traders can identify potential buy and sell opportunities with higher confidence.
The main advantage of the Ichimoku Cloud is its ability to provide a “one-look equilibrium” snapshot of the market. It highlights bullish trends when the price is above the cloud, bearish conditions when the price is below it, and indecision or transition when the price is inside the cloud. Crossovers, cloud breakouts, and confirmations by the Chikou Span strengthen the trading signals.
However, traders should keep in mind the limitations of the Ichimoku system. It is based on historical data and should not be used in isolation. Combining it with other tools such as RSI, volume analysis, or candlestick patterns can significantly improve accuracy and reduce false signals.

Stalonte EMA - Stable Long-Term EMA with AlertsStalonte EMA - The Adaptive & Stable EMA - Almost Eternal
Here's why you will love "Stalonte":
The Stalonte (Stable Long-Term EMA) is a highly versatile trend-following tool. Unlike standard EMAs with fixed periods, it uses a configurable smoothing constant (alpha), allowing traders to dial in the exact level of responsiveness and stability they need. Finding the "sweet spot" (e.g., alpha ~0.03) creates a uniquely effective moving average: it is smooth enough to filter out noise and identify safe, high-probability trends, yet responsive enough to provide actionable signals without extreme lag. It includes alerts for crossovers and retests.
Pros and Cons of the Stalonte EMA
Pros:
Unparalleled Adaptability: This is its greatest strength. The alpha input lets you seamlessly transform the indicator from an ultra-slow "trend-revealer" (low alpha) into a highly effective and "safe" trend-following tool (medium alpha, e.g., 0.03), all the way to a more reactive one.
Optimized for Safety & Signal Quality: As you astutely pointed out, with the proper setting (like 0.03), it finds the perfect balance. It provides a smoother path than a standard 20-50 period EMA, which reduces whipsaws and false breakouts, leading to safer, higher-confidence signals.
Superior Trend Visualization: It gives a cleaner and more intuitive representation of the market's direction than many conventional moving averages, making it easier to "see" the trend and stick with it.
Objective Dynamic Support/Resistance: The line created with a medium alpha setting acts as a powerful dynamic support in uptrends and resistance in downtrends, offering excellent areas for entries on retests with integrated alerts.
Cons:
Requires Calibration: The only "con" is that its performance is not plug-and-play; it requires the user to find their optimal alpha value for their specific trading style and the instrument they are trading. This demands a period of testing and customization, which a standard 50-period EMA does not.
Conceptual Hurdle: For traders only familiar with period-based EMAs, the concept of a "smoothing constant" can be initially confusing compared to simply setting a "length."
In summary:
The Stalonte EMA is not a laggy relic. It is a highly sophisticated and adaptable tool. Its design allows for precise tuning, enabling a trader to discover a setting that offers a superior blend of stability and responsiveness—a "sweet spot" that provides safer and often more effective signals than many traditional moving averages. Thank you for pushing for a more accurate and fair assessment.
Use Case Example:
You can combine it with classical EMAs to find the perfect entry.
Price Proximity Alert: EMA 25, MA 100, EMA 200 Holding LLCCustomised EMA`s and MA`s Proximity Alert System Indicator.

ADVANCED EMA RIBBON SUITE PRO [Multi-Timeframe + Alerts + Dash]🎯 ADVANCED EMA RIBBON SUITE PRO
📊 DESCRIPTION:
The most comprehensive EMA Ribbon indicator on TradingView, featuring 14 customizable
EMAs (5-200), multi-timeframe analysis, gradient ribbon visualization, smart alerts,
and a real-time dashboard. Perfect for trend following, scalping, and swing trading.
🔥 KEY FEATURES:
• 14 EMAs with Fibonacci sequence option (5, 8, 13, 21, 34, 55, 89, 144, 200)
• Multi-Timeframe (MTF) analysis - see higher timeframe trends
• Dynamic gradient ribbon with trend-based coloring
• Golden Cross & Death Cross detection with alerts
• Professional themes (Dark/Light) with 6 visual styles
• Real-time information dashboard
• Customizable transparency and colors
• Trend strength visualization
• Price position analysis
• Smart alert system for all major crossovers
📈 USE CASES:
• Trend Identification: Ribbon expansion/contraction shows trend strength
• Entry/Exit Signals: EMA crossovers provide clear trade signals
• Support/Resistance: EMAs act as dynamic S/R levels
• Multi-Timeframe Confluence: Combine timeframes for higher probability trades
• Scalping: Use faster EMAs (5-20) for quick trades
• Swing Trading: Focus on 50/200 EMAs for position trades
🎯 TRADING STRATEGIES:
1. Ribbon Squeeze: Trade breakouts when ribbon contracts
2. Golden/Death Cross: Major trend reversals at 50/200 crosses
3. Price Above/Below: Long when price above most EMAs, short when below
4. MTF Confluence: Trade when multiple timeframes align
5. Dynamic S/R: Use EMAs as trailing stop levels
⚡ OPTIMAL SETTINGS:
• Scalping: 5, 8, 13, 21 EMAs on 1-5 min charts
• Day Trading: Full ribbon on 15-60 min charts
• Swing Trading: Focus on 50, 100, 200 EMAs on daily charts
• Position Trading: Use weekly timeframe with monthly MTF
📌 KEYWORDS:
EMA, Exponential Moving Average, Ribbon, Multi-Timeframe, MTF, Golden Cross,
Death Cross, Trend Following, Scalping, Swing Trading, Dashboard, Alerts,
Support Resistance, Fibonacci, Professional, Advanced, Suite, Indicator
*Created using PineCraft AI (Link in Bio)

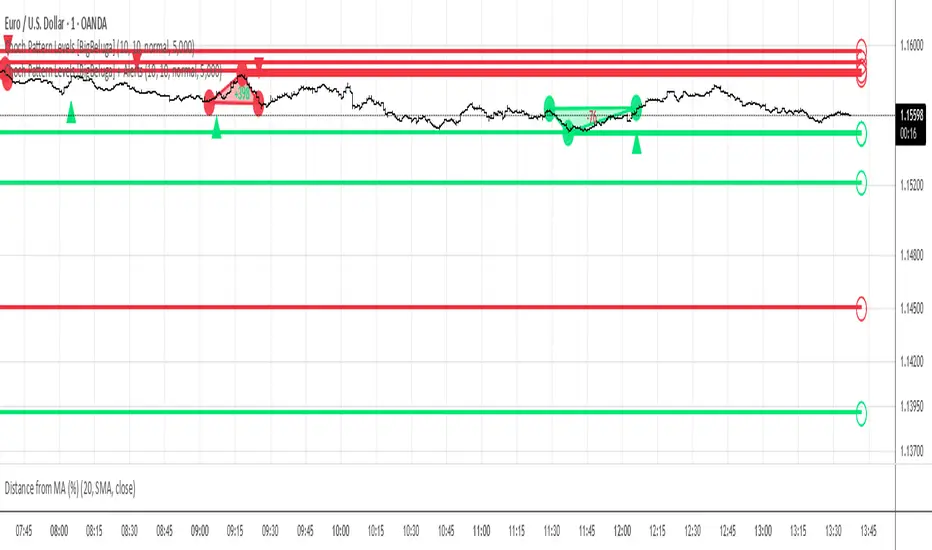
Choch Pattern Levels [BigBeluga] + AlertsThis version of Choch Pattern Levels includes built-in alert conditions for both ChoCh Up and ChoCh Down patterns. You can now set TradingView alerts directly when either pattern occurs, with optional visual markers (triangles) plotted on the chart.
Based on the original script by BigBeluga, licensed under CC BY-NC-SA 4.0. This is a modified version with alert conditions added.