MACs EasyMoney - BOT Trade with AlertSytemsNew Version: MACs EasyMoney - BOT Trade with AlertSytems
Introducing the BOT version with proper alerts systems to enter and exit trades.
Also furnished with latest noise filtering architecture to this tool.
Strategy Test report for this tool - holds the Profit Factor of 134 - based on '1 contract' size with '0.25% commission' rate as well.
(Means it is very solid and healthy Profit Factor . happy to say that, you wont get any like this in today's Market)
Refer the Strategy Publication for details.
Thanks,
Mac.
Cari dalam skrip untuk "alert"

Ichimoku with Alerts (Flexible Conditions)This is the standard Ichimoku indicator with very flexible BUY and SELL conditions.
Inputs
Standard Ichimoku Inputs:
Conversion Line Periods
Base Line Periods
Lagging Span 2 Periods
Displacement
BUY Options
Crossover happens Above the Cloud : Buy when conversion line crosses over baseline above the ichimoku cloud.
Crossover happens Inside the Cloud : Buy when conversion line crosses over baseline inside the ichimoku cloud.
Crossover happens Below the Cloud : Buy when conversion line crosses over baseline below the ichimoku cloud.
Buy when price crosses over Conversion Line : Buy when price crosses over conversion line (could happen below, inside or above the cloud).
Buy when price crosses over Base Line : Buy when price crosses over base line (could happen below, inside or above the cloud).
Buy when price crosses over min of CL and BL : Buy when price crosses over min of conversion and base line pair (could happen below, inside or above the cloud).
Buy when price crosses over max of CL and BL : Buy when price crosses over max of conversion and base line pair (could happen below, inside or above the cloud).
Consecutive ups : Number of bars for the selected buy condition to stay valid in order to trigger a BUY signal/alert.
SELL Options
Note: Each of the following conditions could happen below, inside or above the cloud.
Sell with Crossunder : Sell when converison line crosses under base line.
Sell when price crosses under Conversion Line : Sell when price crosses under conversion line.
Sell when price crosses under Base Line : Sell when price crosses under base line.
Sell when price crosses under min of CL and BL : Sell when price crosses under min of conversion and base line pair.
Sell when price crosses under max of CL and BL : Sell when price crosses under max of conversion and base line pair.
Consecutive downs : Number of bars for the selected sell condition to stay valid in order to trigger a SELL signal/alert.
This indicator has pretty much every possible scenarios to use the Ichimoku indicator effectively. I have also added consecutive ups/downs input, so you can avoid false signals and trade safely.
You can combine different options together. In that case, Buy or Sell signals will be triggered if at least one of the condtions is true.
Please report the bugs you found with a screenshot of the chart. Please make sure that the time stamp is visible, and also include the inputs you selected so I can reproduce the problem and fix it.
Please provide some feedback so we can improve this indicator together.
If you have any questions, please feel free to ask.
The strategy of this indicator is available here:

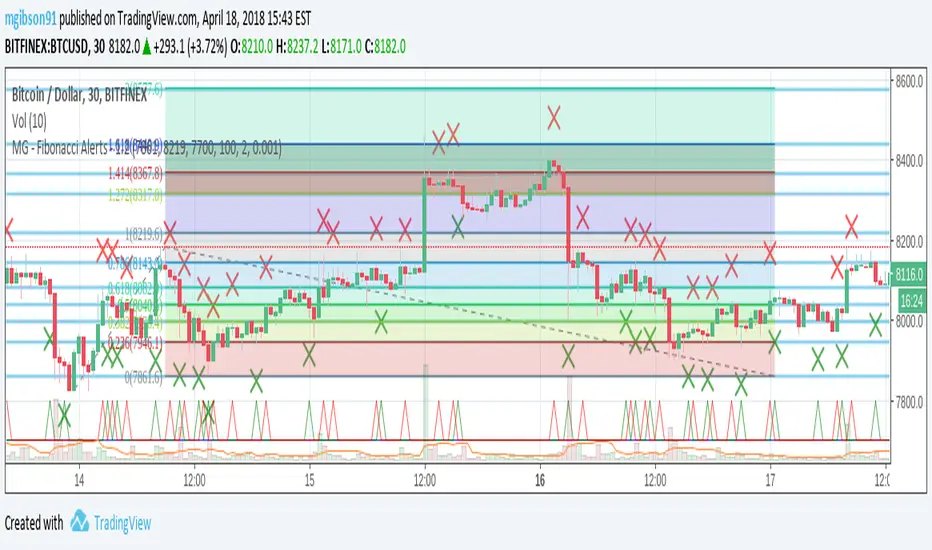
MG - Fibonacci Alerts - 1.2Updated version of:
The main change with this version, is that the indicator is now always overlayed and the user has to specify where they want the alerts to be displayed on the chart. (New 'Alert Base' and 'Alert Amplitude' properties define where this is shown in the chart and how large the alert spikes are). It also now includes optional bull and sell markers
This update therefore allows us to:
- Show the Fibonacci Levels being used by the indicator
- Plot buy and sell signals at the correct points on the price chart
- Trigger alerts when price reaches a Fibonacci level (without displaying this on the chart, the indicator can't be overlayed on the main chart)
MG - Fibonacci Level AlertsThis script allows a user to get alerts when the price goes within a certain percentage threshold of a Fibonacci level.
If connected with AutoView, it could allow an easy way to do automated range trading between Fibonacci levels. Although I plan to do this myself, I haven't used it for this purpose yet so please be cautious and verify with live results beforehand before using it for any automation.
NOTE: The image shown of the indicator is not fully correct as the close price is used. In many cases in the example image, the candle close price DID come within the alert threshold but closed outside the threshold
Usage:
1. User performs a Fibonacci retracement / extension analysis to identify a sensible high and low point. (Currently, this script is geared towards dip pullbacks during a bull market with the ability to toggle rise pullbacks in a bear market in the pipeline)
2. User enters the high and low points into this indicator
3. User can then set alerts on the buy and sell signals which should provide alerts at excellent entry / exit points.
4. Set the alerts to once per bar (not per close). In this indicator, we want to catch things as soon as they happen.
NOTE: Should use in conjunction with another indicator for maximum results.
I personally use this indicator ()
TODO
- Add negative alert levels
- Allow user to specify direction of Fib retracement as the levels are different in bull and bear markets
All feedback is welcome

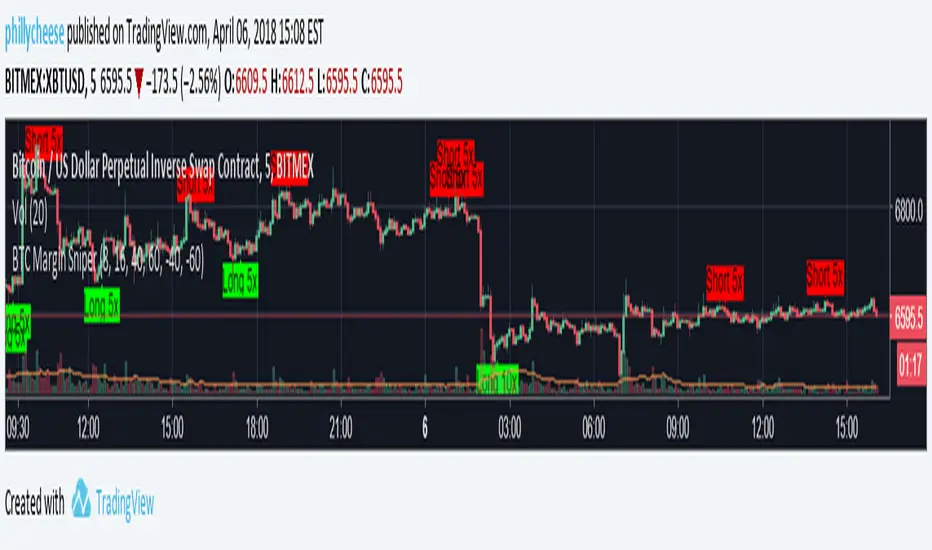
BTC Margin Sniper w/ AlertsMargin Sniper uses 2 levels for overbought and oversold to overlay possible trades on the chart. You can adjust its sensitivity by either increasing or decreasing the overbought and oversold threshold numbers. It must meet one of these levels and the short-term trend has to change direction for it to create the alert and entry on the overlay.
Increasing the overbought input makes the trigger more precise, but it may not trigger as often. Decreasing the oversold input will do the same for that trigger.
You can adjust the alerts and the overlaid position suggestions to match your preferred leverage amount.
To set an alert, click "add alert", then select this script. Choose one of the oversold or overbought alerts and enter your message.
I primarily use this on BitMEX with BTC, but you can use it with other exchanges and coins. You may have to adjust the inputs depending on the coin and the timeframe you use. Do not blindly follow this to make purchases. This is just an alert system to notify you of possible trades.
UCS Squeeze Momentum Overlay with AlertsAll credit to the great ucsgears. His original indicator is on this page:
I just remixed the visuals and added alerts when price is released from the squeeze. I find it works well on lower timeframes for Forex and Bitcoin. Suggestions for other instruments and timeframes are welcome! When adding alerts use 'On Condition' to get the fastest alerts.
Best used in conjunction with the USC_SQZ_Opt Ooscillator from this page:
Possibly useful tip: the squeeze code here is great for identifying ranging markets, and can be used with other indicators to stop alerts firing in choppy markets.

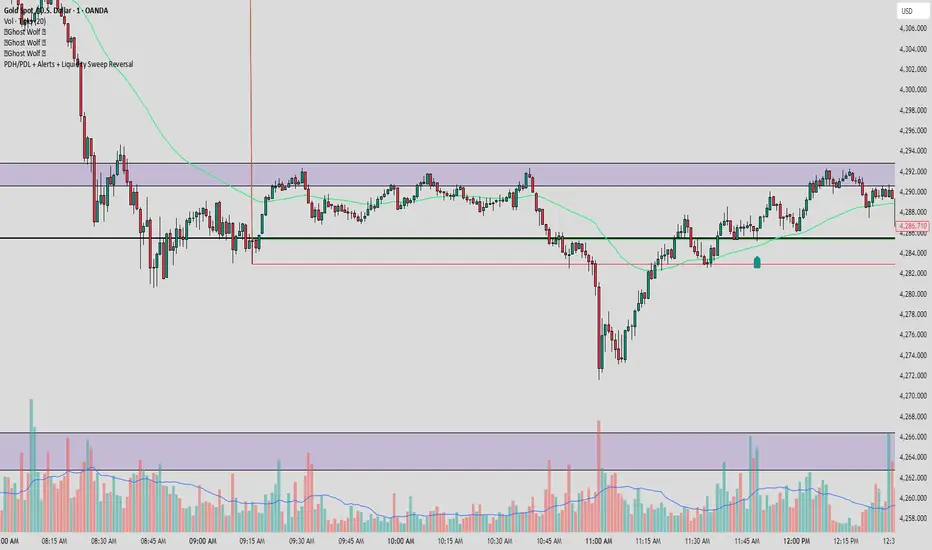
PDH/PDL + Alerts + Liquidity Sweep ReversalThis indicator is designed for traders who utilize Price Action to identify high-probability reversal zones at daily liquidity levels. It automatically plots the Previous Day High (PDH) and Previous Day Low (PDL) and monitors them for institutional "fake-outs" or liquidity sweeps.
Core Functionality
Daily Liquidity Levels: Automatically fetches and plots the PDH and PDL with custom labels and line styles.
Strict Reversal Logic: Unlike standard breakout indicators, this script looks for specific "trap" behavior where price pierces a level and is immediately rejected.
Institutional Precision Tooltips: Includes built-in precision guides for Wick Percentages and Lookback counts based on professional trading standards.
The "Strict Reversal" Setup
The indicator only triggers a Buy/Sell label when three specific criteria are met:
The Lookback: The level must have been respected as a boundary for a user-defined number of candles (Default: 7), confirming its strength.
The Sequence: The candle must open on the "safe" side of the level, pierce through it to grab liquidity, and then close back on the original side.
The Rejection (Wick %): The candle must leave a significant wick (Default: 72%). This 72% threshold aligns with the 2.5x Wick-to-Body ratio, signaling a violent institutional rejection.
Alert Options
The script features four consolidated alert conditions for seamless automation:
Sell Signal (Rejection): Triggers on strict bearish wick sweeps at key levels.
Buy Signal (Rejection): Triggers on strict bullish wick sweeps at key levels.
Price Cross Up: Alerts when price breaks above either PDH or PDL.
Price Cross Down: Alerts when price breaks below either PDH or PDL.
How to Use
Scalping: Use a 3–5 candle lookback on the 1m or 5m timeframe.
Intraday Reversals: Use the 7–10 candle lookback on the 5m or 15m timeframe for standard SMC setups.
Swing Trading: Use the 15+ candle lookback on the 1h or 4h timeframe to target major daily liquidity pools.
Matt's Multi-Timeframe MACD Direction AlertThe indicator monitors the direction of the Moving Average Convergence Divergence (MACD) lines on four specific timeframes: 1-hour, 15-minute, 5-minute, and 1-minute.
It only generates a signal when the MACD in all four timeframes is trending in the same direction (either all are bullish, or all are bearish). This alignment suggests a strong, synchronized market momentum from short-term scalping views up to immediate-term swing views.
Key Features:
Multi-Timeframe Confirmation: Uses TradingView's request.security() function to fetch data from different timeframes (1h, 15m, 5m, 1m), preventing the need to manually switch charts.
Visual Dashboard: A dashboard table is displayed on your chart, providing an immediate visual status (Bullish/Bearish/Neutral) for each of the four timeframes.
On-Chart Signals: The indicator plots visual shapes (green triangles for bullish alignment, red triangles for bearish alignment) directly on the sub-chart when the condition is met.
Custom Alert Integration: It includes a built-in alertcondition() function, allowing traders to set up real-time, hands-free notifications whenever a synchronized trading opportunity arises.
This tool helps filter out noise and potential false signals that might appear on a single timeframe, focusing instead on robust signals confirmed by a consensus of time perspectives.

BHUVANA Fib 50–61.8 • Turn Alerts when FIB directions change
Detects step-up / step-down on both Fib 50 & 61.8 (your “stairs” logic).
Triggers BUY/SELL on that slope change (optionally also requires price to be above/below the line).Spot volatility compression around the 50%–61.8% Fibonacci mid-band of the current swing, then trade the first expansion with clean, rules-based entries and auto SL references.
Swing mapping: Finds the active high/low over a user-defined lookback and computes Fib 50% and Fib 61.8%.
Squeeze detection: Measures the distance between 50% and 61.8%. If the band width is ≤ (ATR × multiplier), the zone is flagged as a Squeeze.
Breakout entries (on close):
Long when price crosses up through 50% while squeezed.
Short when price crosses down through 61.8% while squeezed.
Risk framework: Auto-plots stop lines from the signal bar:
Long SL = swing low; Short SL = swing high.
Visuals: Fib lines (50/61.8) + optional yellow zone highlight during squeeze.
Signals evaluate on bar close (no forward-looking data).
Works well on XAUUSD / US30 intraday (5–15m) during London/NY sessions.
Add your own alertcondition() lines if you want push alerts on Long/Short entries.

Pivot Alert Bot - Multi-TimeframeOverview
Pivot Alert Bot automatically detects and labels pivot highs and pivot lows as they confirm across multiple timeframes. Designed for active traders who want clean, actionable signals without chart clutter.
Two-Tier Pivot System
📍 Main Pivots (Length 20)
Confirmed swing points that have proven themselves with 20 bars of price action on each side. Marked with clean PH (Pivot High) and PL (Pivot Low) labels. These are your high-conviction levels.
⭐ Temporary Pivots (Length 3)
Early-stage pivots marked with ***** labels in blue. These signal potential reversals before full confirmation — ideal for aggressive entries with tighter stops.
How to Trade
The indicator is built around a simple pivot-to-pivot strategy:
🔴 Short Setup: Enter short at a Pivot High → Target the previous Pivot Low
🟢 Long Setup: Enter long at a Pivot Low → Target the previous Pivot High
This approach gives you logical, structure-based profit targets instead of arbitrary calculations.
Multi-Timeframe Support
Scan for setups across:
⚡ 5 minute — Scalping and quick intraday moves
📊 15 minute — Primary day trading timeframe
📊 30 minute — Confirmation and larger moves
⏱️ 1 hour — Context and swing trade setups
Built-In Alerts
Never miss a pivot. Alert conditions included for:
Main Pivot High confirmed
Main Pivot Low confirmed
Temporary Pivot High detected
Temporary Pivot Low detected
Set alerts once and get notified on any timeframe.
Best Used On
High-volume, liquid instruments: SPY, QQQ, NVDA, TSLA, AMD, META, AMZN, COIN, and similar names with clean price action.
Settings
Adjustable pivot lengths for both main and temporary pivots
Toggle temporary pivot visibility on/off
Customizable label colors and sizes

Camarilla Trading - D/W/M, Alerts, TP/SL, ADX, VWAP/EMA, VolumeCamarilla Trading System
Overview
This advanced Pine Script indicator implements a comprehensive Camarilla trading system with multiple filtering mechanisms, position management, and real-time statistics. It's designed for day traders and swing traders using Camarilla pivot levels with enhanced confirmation filters.
Key Features
🎯 Core Components
- Camarilla Levels: Calculates H3, H4, H5, L3, L4, L5 pivot levels from previous period data
- Multi-Timeframe Support: Daily (D), Weekly (W), and Monthly (M) timeframe options
- Smart Position Management: Automated entry/exit with take profit and stop loss levels
📊 Advanced Filtering System
- ADX Filter**: Optional trend strength filter using Average Directional Index
- Volume Filter**: High-volume confirmation with customizable multiplier
- Trend Filter**: VWAP or EMA-based trend direction confirmation
💹 Trading Signals
Long Entries:
- Condition 1: Open crosses above H4 (below H5)
- Condition 2: Open crosses above L3 (below H3)
Short Entries:
- Condition 1: Open crosses below L4 (above L5)
- Condition 2: Open crosses below H3 (above L3)
📈 Visual Features
- Level Display: Clear plotting of all Camarilla levels
- Signal Markers: Visual entry/exit signals on chart
- Volume Coloring: Bars colored lime/purple during high-volume periods
- Trend Indicators: Colored VWAP/EMA lines based on ADX trend direction
- Real-time Statistics: Performance table with win rate, P&L, and trade metrics
⚙️ Customization Options
- Toggle individual filters on/off
- Adjustable parameters for all indicators
- Customizable display options
- Flexible timeframe selection
🔔 Alert System
- Buy/Sell signal alerts
- Position exit alerts
- Customizable alert conditions
📊 Performance Tracking
- Automatic trade statistics
- Win rate calculation
- Average profit per trade
- Total P&L tracking
- Trade history from start date
Input Parameters
Timeframe & Levels
- Timeframe levels: D/W/M selection for pivot calculations
- Show levels labels: Toggle level price labels
Filter Settings
- ADX filter: Enable/disable trend strength filter
- ADX length/treshold: Customize ADX parameters
- Volume filter: High-volume confirmation
- Volume length/multiplier: Volume MA settings
- Trend filter: VWAP/EMA trend confirmation
- EMA length: EMA period for trend filter
Display Options
- Show signals: Display entry/exit markers
- Show TP/SL: Show take profit/stop loss levels
- Show statistics: Performance table display
- Colored bars: Volume-based bar coloring
Usage Notes
- Non-repainting: Signals are fixed at bar open price
- Multi-timeframe: Uses security calls for accurate previous period data
- Position Management: Automated TP/SL based on Camarilla levels
- Risk Management: Built-in trading time restrictions
This system provides institutional-grade Camarilla trading with professional risk management features suitable for both manual trading and strategy development.

Strat 3-Bar (Outside Bar) AlertThis indicator automatically detects and alerts you when a Strat 3-Bar (Outside Bar) forms on any chart or timeframe.
An Outside Bar (3) occurs when both sides of the previous candle’s range are taken out — the high breaks above the prior bar’s high AND the low breaks below its low. It signals expansion in price discovery and potential reversals or continuations.
📈 How to Use:
1. Add this script to your chart.
2. Look for red “3” labels or triangles above outside bars.
3. To get alerts, click the TradingView alert icon (⏰):
• Condition → Strat 3-Bar (Outside Bar) Alert
• Option → “Outside Bar (3) Detected”
• Choose “Once per bar close.”
💡 Pro Tips:
- Use with Strat Assist for visual context.
- Combine with timeframe continuity for directional bias.
- Great on 15-min, 1H, and Daily charts.
---
👩🏽💻 Shared with love by Yolanda
Inspired by community discussions with Jalen (ChatGPT)
Let’s keep building each other up and mastering The Strat together! 💛
TheStrat, outsidebar, 3bar, priceaction, tradingstrategy, alert, reversal, continuation, stratassist, strat, technicalanalysis, pinev6, smartmoney

EMA Cloud + AlertsThe only EMA indicator you'll ever need.
- Flexible EMAs: Customize EMA lengths (e.g., 9, 21) to match your trading style.
- Dynamic Cloud: Auto-shades bullish (green) or bearish (red) clouds between EMAs for clear trend signals.
- Trend Change Alerts: Auto-alerts that signal when a trend change (EMA crossover) happens on the timeframe you're currently viewing.
- Timeframe Lock: Lock EMAs to a specific timeframe (e.g., 5m on a 1m chart) for consistent analysis.
- Personalized Design: Adjust EMA colors, thickness, and cloud transparency for optimal visibility.
A friendly reminder that no tool or indicator guarantees success. Integrate this into a robust trading plan.

Multi-GPS (Long Only, with Alert Mode)A guided long‑only strategy with built‑in risk controls and smart alerts — your GPS for trend trading
**Multi‑GPS (Long Only, with Alert Mode)**
The Multi‑GPS strategy is built to help traders navigate trends with a structured, risk‑managed approach. It focuses exclusively on **long opportunities**, combining multiple moving‑average signals with layered risk controls to keep trades disciplined and consistent.
Key features include:
- **Dynamic trade management** with stop loss, take profit, and trailing stop options (all adjustable by percentage).
- **Flexible order sizing**, allowing positions to scale as a percentage of account equity.
- **Customizable moving averages** (SMA or EMA) and timeframe selection to adapt to different markets and styles.
- **Integrated alerts** with multiple modes, so traders can choose between order‑based notifications, alert() calls, or both.
- **Clear chart visuals**, including entry/exit markers and plotted guide lines for transparency.
This strategy is designed to act like a **navigation system for trend trading** — guiding entries, managing exits, and keeping risk under control, all while maintaining a clean and intuitive charting experience.
---
Would you like me to also craft a **short tagline version** (like a one‑liner hook) for this strategy, so it pairs neatly with the longer description when you publish it?

Bollinger ALTswap Alert v1.0 (MA28 Rotation ALT↔BTC)Inspired by: Bollinger Awesome Alert R1 by JustUncleL
What is it?
BBALTSWAP overlays Bollinger Bands (20, 2), a 3-EMA, and a Rotation MA (default 28), then gives state-change alerts to rotate between ALT ↔ BTC on any ALT/BTC chart.
Core rotation rule
• Rotate → ALT when close > Bollinger middle and close > MA28.
• Rotate → BTC when close < Bollinger middle and close < MA28.
• Otherwise: Wait (no rotation).
Labels only print when the state changes (to avoid spam). You can also compute the rotation on a higher timeframe (default 4h) while viewing a lower one (e.g., 1h).
Optional extras
• Breakout arrows (scalping-style) when 3-EMA crosses the Bollinger middle with an Awesome Oscillator direction filter.
• Bollinger Squeeze coloring (relative width) to highlight expansion/contraction.
• Min bars between labels to throttle how often rotation labels appear.
Inputs (highlights)
• Use EMA for Bollinger / Rotation MA
• Bollinger length & multiplier
• AO fast/slow lengths
• Higher-timeframe selector for rotation (default 240 = 4h)
• Show breakout arrows / show “Wait” / min bars between labels
How to use (simple playbook)
1. Chart: open your ALT/BTC pair (e.g., ETHBTC).
2. Direction: leave rotation HTF at 4h for steadier signals.
3. Execution: take rotations on bar close; manage entries on your lower TF (1h/15m) if desired.
4. Override check (optional): when BTCUSDT is in a fresh breakout, prefer BTC even if ALT flashes briefly.
Alerts
Add two alerts, Once per bar close:
• “Rotate to ALT (state change)”
• “Rotate to BTC (state change)”
Notes
• Works on any ALT/BTC pair.
• The breakout arrows are optional and independent from the rotation signals.
• This tool is educational; not financial advice.

EMA 89 và EMA 34 - MTF AlertEMA34/89 in MTF and alert. If you want to find indicator for alert, I thing it for you

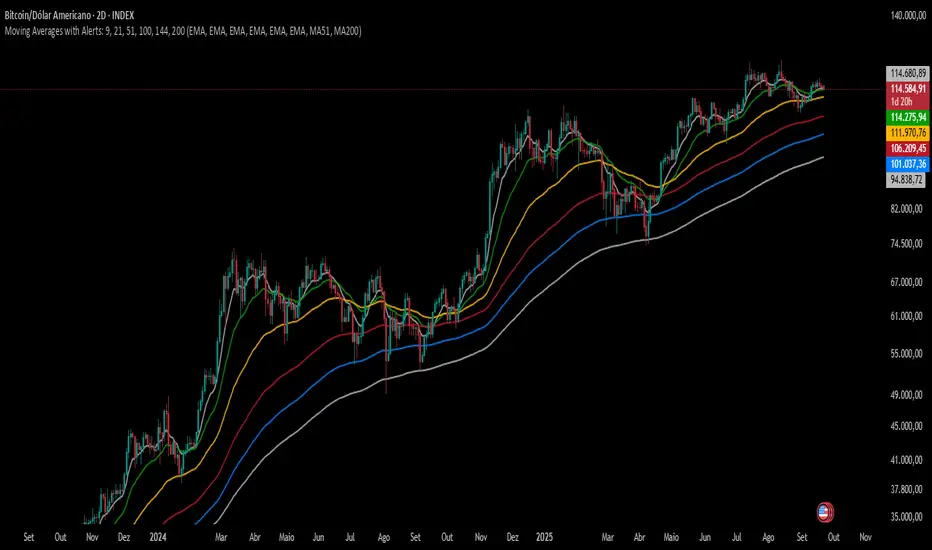
Moving Averages with Alerts: 9, 21, 51, 100, 144, 200---
This indicator plots six configurable moving averages (MA) with options for EMA, SMA, RCI, HMA, and Pivô Boss types. It highlights key crossover points, especially monitoring the 9-period MA for crosses with others. Users can enable alerts for these crossovers, as well as set custom alerts between any two selected MAs. Additionally, the indicator marks the important crossovers of the 51 and 200 MAs on the chart with an “X”. This helps traders identify trend changes and potential entry or exit points efficiently.
---
Swing Failure Pattern (SFP) with AlertsSwing Failure Pattern (SFP) — Indicator Overview
Detects classic Swing Failure Patterns and their confirmations, with optional volume validation and EMA-based trend/reversal filters. Includes convenient alert categories.
1) What are SFPs?
Price briefly breaks a prior swing high/low (liquidity grab), fails to continue, and snaps back inside the range — often a potential reversal from trapped breakout participants.
2) What the indicator plots
SFP candle: wick extending beyond the previous swing (bearish above a swing high, bullish below a swing low).
Opposite/confirmation level: dotted level derived from the opposite side of the swing structure.
Confirmation: a later close beyond the opposite level; optional ▲/▼ triangles can appear with the “SFP” labels.
Two moving averages: fast/slow MAs for context (plot type selectable); style (color/width) set in the Style tab.
3) Volume validation (optional)
Uses a lower timeframe to compare the share of volume outside the swing level (wick area) against a threshold.
None: Use when volume data is questionable (CFDs/FX) or when you want maximum SFP visibility and rely on price confirmation only.
Volume outside swing < Threshold: Default for ranges/quiet phases. Idea: thin volume outside the level suggests a liquidity sweep rather than a true breakout. Start with 20–30%. Fewer but cleaner setups; works well near HTF zones (Daily/4H).
Volume outside swing > Threshold: For news/volatility/capitulation spikes. Idea: heavy pressure beyond the level was absorbed (long wick) — strong reversals possible but more false signals. Start with 50–60%. Always wait for price confirmation.
You can auto-select a lower timeframe or set one manually for the volume check.
4) EMA filter: Trend vs. Reversal
Filtering uses EMAs of the chosen fast/slow lengths (independent of the plotted MA type).
NO MA-Filter: no EMA condition; all SFPs allowed.
Reversal Signal: bullish SFP only if fast EMA < slow EMA ; bearish SFP only if fast EMA > slow EMA .
Trend Follow: bullish SFP only if fast EMA > slow EMA ; bearish SFP only if fast EMA < slow EMA .
Tip: MA colors/widths are controlled in the Style tab; the EMA filter logic isn’t affected by the plotted MA type.
5) Alerts
Multiple alert categories let you react to events like any bullish/bearish signal, SFP detected, and confirmation occurred — without listing each individual condition. Create an alert on the indicator and pick what fits your workflow.
Always trade without risk management.
Reminder: Backtest, align with HTF context and sessions, and use solid risk management.

Emre AOI Zonen Daily & Weekly (mit Alerts, max 60 Pips)This TradingView indicator automatically highlights Areas of Interest (AOI) for Forex or other markets on Daily and Weekly timeframes. It identifies zones based on the high and low of the previous period, but only includes zones with a width of 60 pips or less.
Features:
Daily AOI Zones in blue, Weekly AOI Zones in yellow with 20% opacity, so candlesticks remain visible.
Persistent zones: AOI boxes stay on the chart until the price breaks the zone.
Multiple zones: Supports storing multiple Daily and Weekly AOIs simultaneously.
Break Alerts: Sends alerts whenever a Daily or Weekly AOI is broken, helping traders spot key levels in real-time.
Fully automated: No manual drawing needed; zones are updated and extended automatically.
Use Case:
Ideal for traders using a top-down approach, combining Weekly trend analysis with Daily entry signals. Helps identify support/resistance, supply/demand zones, and critical price levels efficiently.

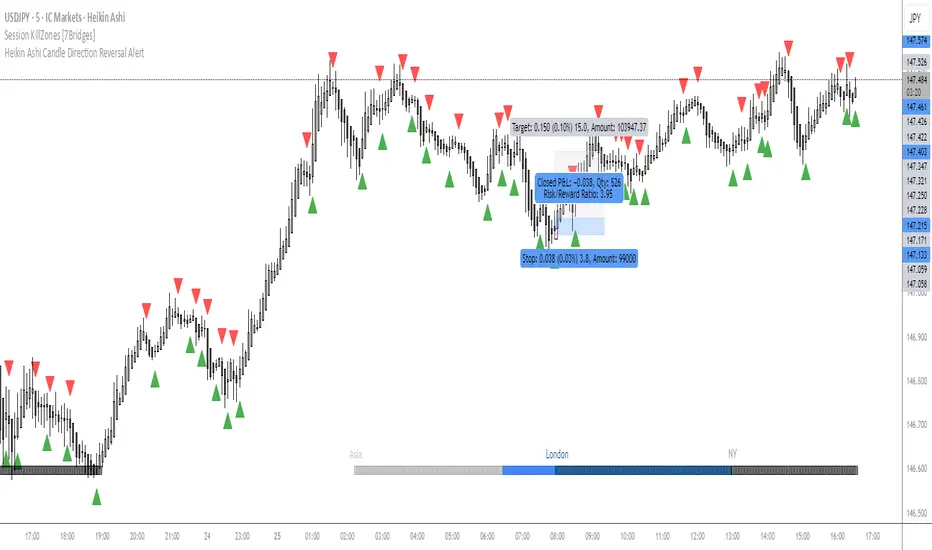
OMN Heikin Ashi Candle Direction Reversal AlertThis is a indicator to let you know once Heikin Ashi candle has changed direction compared to the candle before it. Set an alert on the indicator to get an audible alert.
Andean • Dot Watcher (Exact Math + Optional Alerts)Title: Andean • Dot Watcher (1m + 1000T Alerts)
Description:
The Andean • Dot Watcher is a precision trend-detection tool that plots Bull and Bear “dot” signals for both the 1-minute chart and the 1000-tick chart — all in one indicator. It’s designed for traders who want early confirmation from tick data while also monitoring a traditional time-based chart for added confluence.
Key Features:
Dual-Timeframe Signals – Plots and alerts for both 1m and 1000T chart conditions.
Bull Dots – Green markers indicating bullish dominance or trigger events.
Bear Dots – Red markers indicating bearish dominance or trigger events.
Customizable Dot Mode – Choose between continuous dominance, flip-only signals, or crossover conditions.
Real-Time Alerts – Built-in TradingView alerts for:
1m Bull / 1m Bear signals
1000T Bull / 1000T Bear signals
Alert Flexibility – Users can set alerts for either timeframe independently or combine them for confirmation setups.
Usage Tips:
For fastest reaction, combine 1000T dots with 1-minute dots as a confirmation filter.
If your TradingView plan does not include tick charts, you can still use the 1-minute signals without issue.
Works best when combined with your existing trade plan for entries, exits, and risk management.
Requirements:
1-minute chart signals work on any TradingView plan (including Basic).
1000T tick chart signals require a TradingView plan that supports tick charts.
Triple EMA with Alert | 21, 50, 200 EMA Strategy + Crossover🚀 Boost your trading edge with the Triple EMA with Alert — a professional-grade indicator designed for traders who want precise, real-time trend confirmation across short, medium, and long-term market movements.
🔹 What Makes This Indicator Powerful?
Three Adjustable EMAs — Default: 21, 50, 200 periods (fully customizable 1–200).
Toggle Visibility — Show only the EMAs you need for your strategy.
Real-Time Alerts — Get notified instantly when:
EMA 1 crosses EMA 2 → short-term trend change.
EMA 2 crosses EMA 3 → medium-term trend alignment.
Works on All Markets & Timeframes — Forex, crypto, stocks, indices, and commodities.
🔹 Why Traders Love It
📊 Multi-Timeframe Trend Confirmation — Filter out noise and trade with market momentum.
🎯 Accurate Crossover Signals — Identify bullish and bearish momentum shifts.
🔔 Hands-Free Monitoring — Alerts keep you informed even when you’re away from the chart.
💡 Versatile for Any Strategy — Perfect for scalping, swing trading, or long-term investing.
🔹 How to Use It
Bullish Signal — EMA 1 crossing above EMA 2 or EMA 2 crossing above EMA 3.
Bearish Signal — EMA 1 crossing below EMA 2 or EMA 2 crossing below EMA 3.
Combine with support/resistance zones, RSI, or volume for higher probability trades.
📌 Pro Tip:
Use EMA 21 & EMA 50 for momentum confirmation.
Use EMA 200 to spot the overall market direction.
If you’re serious about trend trading with precision, the Triple EMA with Alert will keep you one step ahead of market moves — no more missed entries or exits.

Daily Signal Alert**📄 English Description (English version)**
**Indicator Name:** Daily Signal Alert + Multi-Indicator Dashboard & Volume Profile
This all-in-one indicator combines multiple technical analysis tools into a single dashboard to help you read market movements easily and make better trading decisions.
It provides technical signals, key support/resistance levels, and a basic volume profile, along with a smart alert system.
**Included Indicators:**
1. **Exponential Moving Averages (EMA 9/20/50):**
* Shows current trend by comparing EMA9 & EMA20 with EMA50.
* Generates bullish and bearish crossover signals.
2. **MACD (12/26/9):**
* Generates bullish and bearish crossovers between MACD line and Signal line.
3. **Relative Strength Index (RSI 14):**
* Detects overbought (RSI > 70) and oversold (RSI < 30) conditions.
4. **Average Directional Index (ADX 14):**
* Measures trend strength and indicates if the trend is bullish or bearish.
5. **Candle Behavior (Squeeze):**
* Compares the current candle size with the previous one to detect momentum squeeze/expansion.
6. **Relative Volume (RVOL):**
* Shows if current volume is above or below average.
7. **Traditional Pivot Levels (Daily / Weekly / Monthly / Auto):**
* Displays key support and resistance levels.
8. **Approximate Volume Profile (POC / VAH / VAL):**
* Identifies Point of Control (POC) and Value Area range.
**Features:**
* Option to display all signals or only the latest one (removing old ones).
* Dashboard table summarizing indicator states with automatic coloring.
* Automatic alerts when any signal appears.
* Auto mode for pivot timeframe selection.
* Basic volume profile to highlight accumulation/distribution zones.
**How to Use:**
* Enable or disable “Show All Signals” depending on your trading style.
* Monitor the dashboard to quickly check indicator states.
* Use Pivot Levels & Volume Profile for key market zones.
* Enable alerts to get notified immediately after a candle closes.
**📄 Arabic Description (الوصف العربي)**
**اسم المؤشر:** Daily Signal Alert + Multi-Indicator Dashboard & Volume Profile
هذا المؤشر المتكامل يجمع بين عدة أدوات تحليل فني في لوحة واحدة، ليساعدك على قراءة حركة السوق بسهولة واتخاذ قرارات تداول أفضل.
المؤشر يعرض إشارات فنية، مستويات دعم ومقاومة، وجانب من تحليل حجم التداول، بالإضافة إلى نظام تنبيه ذكي.
**المؤشرات المدمجة:**
1. **المتوسطات المتحركة الأسية (EMA 9/20/50):**
* يعرض الاتجاه الحالي عبر مقارنة EMA9 و EMA20 مع EMA50.
* إشارات تقاطع صاعدة وهابطة.
2. **مؤشر الماكد (MACD 12/26/9):**
* يعطي إشارات تقاطع صاعدة وهابطة بين خط الماكد وخط الإشارة.
3. **مؤشر القوة النسبية (RSI 14):**
* يحدد حالات التشبع الشرائي (RSI > 70) والتشبع البيعي (RSI < 30).
4. **مؤشر الاتجاه المتوسط (ADX 14):**
* يقيس قوة الاتجاه مع تحديد إذا كان صاعداً أو هابطاً.
5. **سلوك الشموع (Squeeze):**
* يقارن حجم الشمعة الحالية مع السابقة لتحديد ضغط أو انفراج الحركة.
6. **حجم التداول النسبي (RVOL):**
* يحدد إذا كان حجم التداول أعلى أو أقل من المتوسط.
7. **مستويات Pivot التقليدية (Daily / Weekly / Monthly / Auto):**
* تعرض نقاط الدعم والمقاومة الرئيسية.
8. **بروفايل الحجم التقريبي (POC / VAH / VAL):**
* يحدد نقطة التحكم (POC) ومنطقة القيمة.
**المزايا:**
* عرض جميع الإشارات أو آخر إشارة فقط (مع حذف الإشارات القديمة).
* جدول ملخص لحالة كل مؤشر مع تلوين تلقائي.
* تنبيهات تلقائية عند ظهور أي إشارة فنية.
* دعم الوضع التلقائي لاختيار إطار مستويات الـ Pivot.
* عرض بروفايل حجم تداول تقريبي لمناطق التجميع/التوزيع.
**طريقة الاستخدام:**
* فعّل أو عطّل عرض جميع الإشارات حسب أسلوبك.
* راقب الجدول لمعرفة حالة المؤشرات لحظياً.
* استخدم مستويات الـ Pivot والبروفايل لتحديد مناطق الدعم والمقاومة.
* فعّل التنبيهات لتصلك الإشارات فور إغلاق الشمعة.
