Order Blocks v2Order Blocks v2 – Smart OB Detection with Time & FVG Filters
Order Blocks v2 is an advanced tool designed to identify potential institutional footprints in the market by dynamically plotting bullish and bearish order blocks.
This indicator refines classic OB logic by combining:
Fractal-based break conditions
Time-level filtering (Power of 3)
Optional Fair Value Gap (FVG) confirmation
Real-time plotting and auto-invalidation
Perfect for traders using ICT, Smart Money, or algorithmic timing models like Hopplipka.
🧠 What the indicator does
Detects order blocks after break of bullish/bearish fractals
Supports 3-bar or 5-bar fractal structures
Allows OB detection based on close breaks or high/low breaks
Optionally confirms OBs only if followed by a Fair Value Gap within N candles
Filters OBs based on specific time levels (3, 7, 11, 14) — core anchors in many algorithmic models
Automatically deletes invalidated OBs once price closes through the zone
⚙️ How it works
The indicator:
Tracks local fractal highs/lows
Once a fractal is broken by price, it backtracks to identify the best OB candle (highest bullish or lowest bearish)
Validates the level by checking:
OB type logic (close or HL break)
Time stamp match with algorithmic time anchors (e.g. 3, 7, 11, 14 – known from the Power of 3 concept)
Optional FVG confirmation after OB
Plots OB zones as lines (body or wick-based) and removes them if invalidated by a candle close
This ensures traders see only valid, active levels — removing noise from broken or out-of-context zones.
🔧 Customization
Choose 3-bar or 5-bar fractals
OB detection type: close break or HL break
Enable/disable OBs only on times 3, 7, 11, 14 (Hopplipka style)
Optional: require nearby FVG for validation
Line style: solid, dashed, or dotted
Adjust OB length, width, color, and use body or wick for OB height
🚀 How to use it
Add the script to your chart
Choose your preferred OB detection mode and filters
Use plotted OB zones to:
Anticipate price rejections and reversals
Validate Smart Money or ICT-based entry zones
Align setups with algorithmic time sequences (3, 7, 11, 14)
Filter out invalid OBs automatically, keeping your chart clean
The tool is useful on any timeframe but performs best when combined with a liquidity-based or time-anchored trading model.
💡 What makes it original
Combines fractal logic with OB confirmation and time anchors
Implements time-based filtering inspired by Hopplipka’s interpretation of the "Power of 3"
Allows OB validation via optional FVG follow-up — rarely available in public indicators
Auto-cleans invalidated OBs to reduce clutter
Designed to reflect market structure logic used by institutions and algorithms
💬 Why it’s worth using
Order Blocks v2 simplifies one of the most nuanced parts of SMC: identifying clean and high-probability OBs.
It removes subjectivity, adds clear timing logic, and integrates optional confluence tools — like FVG.
For traders serious about algorithmic-level structure and clean setups, this tool delivers both logic and clarity.
⚠️ Important
This indicator:
Is not a signal generator or financial advice tool
Is intended for experienced traders using OB/SMC/time-based logic
Does not predict market direction — it provides visual structural levels only
Cari dalam skrip untuk "algo"

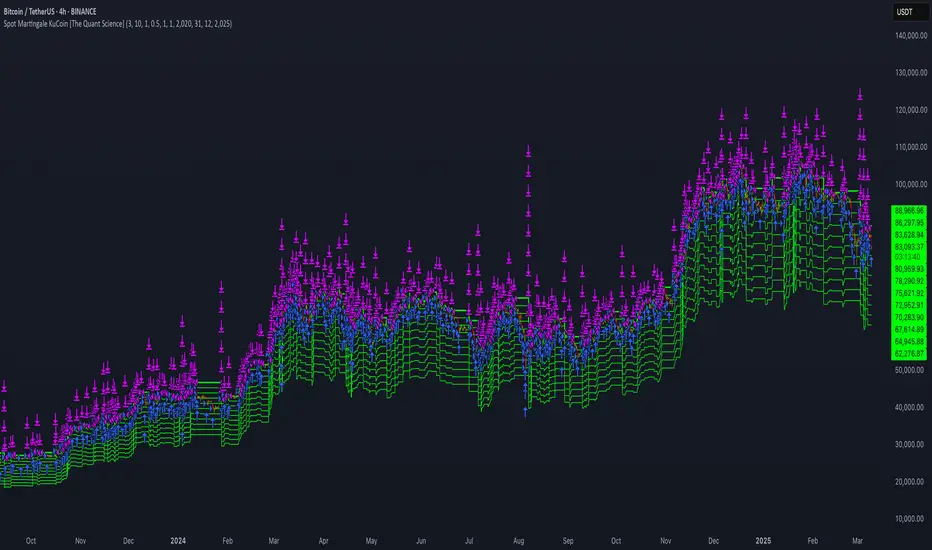
Spot Martingale KuCoin - The Quant ScienceINTRODUCTION
Backtesting software of the Spot Martingale algorithm offered by the KuCoin exchange.
This script replicates the logic used by the KuCoin bot and is useful for analyzing strategy on any cryptocurrency historical series.
It's not intended as an automatic trading algorithm and does not offer the possibility of automatic order execution.
The trader will use this software exclusively to research the best parameters with which to work on KuCoin.
LOGIC OF EXECUTION
The execution of orders is composed as follows:
1) Start Martingale: initial order
2) Martingale-Number: orders following Start Martingale
(A) The software is designed and developed to replicate trading without taking into account technical indicators or particular market conditions. The Initial Order (Start Martingale) will be executed immediately the close of the previous Martingale when the balance of market orders is zero. It will use the capital set in the Properties section for the initial order.
(B) After the first order, the software will open new orders as the price decreases. For orders following Start Martingale, the initial capital, multiplier, and number of orders in the exponential growth context are considered. The multiplier is the factor that determines the proportional increase in capital with each new order. The number of orders, indicates how many times the multiplier is applied to increase the investment.
Example
To find out the capital used in Martingale order number 5, with a Multiple For Position Increase equal to 2 and a starting capital of $100, the formula will be as follows:
Martingale Order = ($100 * (2 * 2 * 2 * 2 * 2)) = $100 * 32 = $3.200
(C) A multiplier is used for each new order that will increase the quantity purchased.
(D) All previously open orders are closed once the take profit is reached.
USER MANUAL
The user interface consists of two main sections:
1. Settings
Percentage Drop for Position Increase (0.1-15%) : percentage distance between Martingale orders. For example, if you set 5% each new order will be opened after a 5% price decrease from the previous one.
Max Position Increases (1-15) : number of Martingale orders to be executed after Start Martingale. For example, if you set 10, up to10 orders will be opened after Start Martingale.
Multiple For Position Increase (1-2x) : capital multiplier. For example, if you set 2 each for each new order, the capital involved will be doubled, order by order.
Take Profit Percentage (0.5-1000%) : percentage take profit, calculated on the average entry price.
2. Date Range Backtesting
The Date Range Backtesting section adjusts the analysis period. The user can easily adjust the UI parameters, and automatically the software will update the data.
LIMITATIONS OF THE MODEL
Although the Martingale model is widely used in position management, even this model has limitations and is subject to real risks during particular market conditions. Knowing these conditions will help you understand which asset is best to use the strategy on.
The main risks in adopting this automatic strategy are 2:
1) The price falls below our last order.
It happens during periods of strong bear-market in which the price collapses abruptly without experiencing any pullback. In this case the algorithm will enter a drawdown phase and the strategy will become a loser. The trader will then have to consider whether to wait for a price recovery or to incur a loss by manually closing the algorithm.
2) The price increases quickly.
It happens during periods of strong bull-market in which the price rises abruptly without experiencing any pullback. In this case the algorithm will not optimize order execution, working only with Start Martingale in the vast majority of trades. Given the exponential nature of the investment, the algorithm will in this case generate a profit that is always less than that of the reference market.
The best market conditions to use this strategy are characterized by high volatility such as correction phases during a bull run and/or markets that exhibit sideways price trends (such as areas of accumulation or congestion where price will generate many false signals).
FEATURES
This script was developed by including features to optimize the user experience.
Includes a dashboard at launch that allows the user to intuitively enter backtesting parameters.
Includes graphical indicator that helps the user analyze the behavior of the strategy.
Includes a date period backtesting feature that allows the user to adjust and choose custom historical periods.
DISCLAIMER
This script was released using parameters researched solely for the BTC/USDT pair, 4H timeframe, traded on the KuCoin Exchange (2017-present). Do not consider this combination of parameters as universal and usable on all assets and timeframes.
Maddrix_club III (strategy)Maddrix club III (STRATEGY) is an advanced trading algorithm that goes long and short in spite of the market condition. It aims to capture large moves. It is the fruit of over a thousand hours of work, trials, errors, research, etc.
The STUDY version is also posted.
There are 5 main variables to adjust the indicator:
Framework length – Use this to establish the environment. Shorter length = volatile environment. Longer length = steadier.
Framework multiplier – Use this to adjust the environment to the asset. Lower value for less volatile price action and higher value for very volatile price action.
Search timeframe – Use this to lookback for a fractal . In theory, the longer the lookback the more reliable the fractal recognition.
Trigger line – Use this to adjust the trigger level. In theory, the lower the trigger the more signals you get.
Threshold – Use this to filter the signals. The higher the threshold, the less signal you get.
The best way to go about changing the settings, is to start off the default value. I’d do a monthly check-in playing with few of them and readjusting based on results from the exchange.
They are different, as this one can show you the equity curve.
It works on many markets as long as there is sufficient activity to create patterns and repetition.
You will notice a slight difference between the strategy calculation and the algo calculation (built in the algo) - this is because the exits are not exactly at the same levels. I left this on purpose, so that you can see that even with a little slippage, overall this is positive.
Very good results have been observed on the 15 min time frame though it technically works on all timeframe (5 min for example, 1 hour also). On the example above ETHUSDT – 15 min, the back test shows consistency in the results for the last 2 years. The theory behind it is based on probabilities, human emotions, and repetition in market patterns.
Results have also shown great adaptability, meaning the total profits don’t change considerably when we play with settings. This is very good because even if you try to fine tune a set of settings to the past, the probability that it keeps working in the future is rather high.
Very important note: the calculations DO NOT take into account any fee or slippage that you always experience on the exchanges.
The indicators only uses real time data, therefore it can’t repaint.
There are absolutely no guarantees about this algorithm and past results are not indicative of future performance.
Fees, slippage and API delay: for any algorithm you will use (from me or others), please keep in mind that fees add up, slippage and delay creates differences between algo theory and reality. We can put in place systems to circumvent that, but we will always have them.

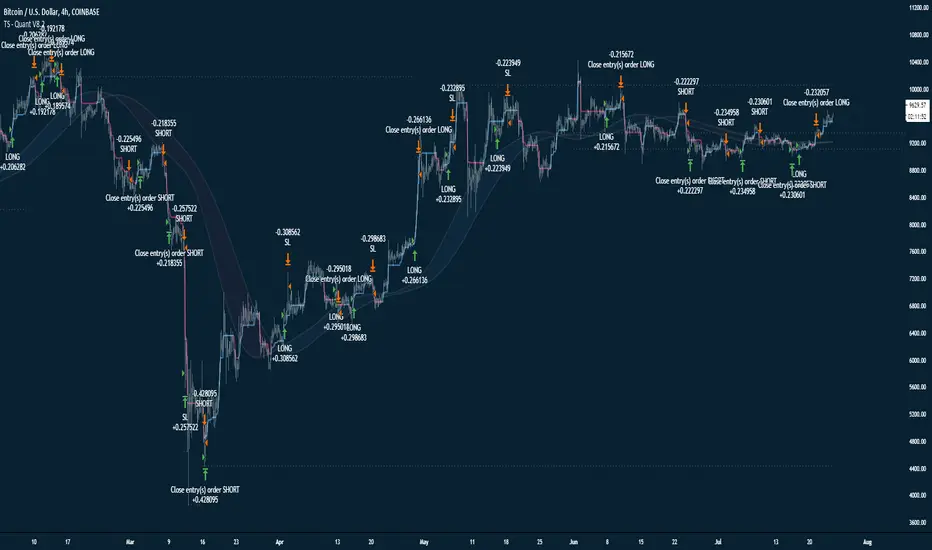
Unicorn Quant Strategy [Astride Unicorn]Deeply customizable trading algorithm with instant back-testing. Its position management and trading signals engines emulate every step of the trading process and display all the actions on the chart. For example, the algorithm shows when to enter or partially close a position, move stop-loss to breakeven, etc. The trader can use these signals in their decision-making and replicate these actions in their trading terminal. The script can also send real-time alerts to the user’s Email.
The trading signals feature calculates entry signals for momentum and trend trading. The calculation is based on trend filtering using our custom filter based on rolling historical volatility. The historical volatility is used to distinguish the market regime and determine the current trend direction. In its calculations, the algorithm uses linear regressions instead of averaging. As our practice shows, it helps to reduce signal lag while keeping the number of false signals low.
HOW TO USE
Set stop-loss and up to three take-profit levels, choose rules for moving the stop-loss level, adjust sensitivity of the entry signals and see the back-test result immediately. If the performance of the strategy satisfies you, proceed with the forward-testing or live-trading.
When using this script, please, keep in mind that past results do not necessarily reflect future results and that many factors influence trading results.
SETTINGS
Use Starting Date - when the flag is turned off, the algorithm uses all available pricing data to calculate back-tests; when turned on, back-tests start from a starting date the user can select in the setting below.
Starting Date - sets a starting date for back-testing.
Trading Signals
Trade Length - defines the length of the trades the algorithm tries to calculate entry signals for. Recommended values are from 1.0 to 6.0.
Sensitivity - controls the sensitivity of the trading signals algorithm. The sensitivity determines the density of trading signals and how close the trailing-stop levels follow the price. The higher the value of this parameter is, the less sensitive the algorithm is. High values of the Sensitivity parameters (100-500) can help to withstand large price swings to stay in longer price moves. Lower values (10-100) work well for short- and medium-term trades.
Signals Type - In the Signals Type dropdown list, there are two options: Market Timing and Market Bias. Market timing is a type of trading signaling when the algorithm tries to find a perfect moment to enter and exit a trade. Market Bias is the type of trading signaling when the algorithm tries to be in a position all the time. When a trade is closed, the algorithm determines a direction to which the market is currently “biased” and immediately opens a trade in this direction.
Position Management
SL - sets stop-loss level measured as a percentage of the trade entry price
TP1, TP2, TP3 - sets take-profit levels measured as a percentage of the trade entry price
Close % at TP1, Close % at TP2, Close % at TP3 - Sets portions of the open position(as a percentage of the initial order size) to close at each of the TP levels
At TP1 move SL to, At TP2 move SL to - Sets the rules for moving stop-loss level in an open trade to protect the floating profit
Dashboards
Active Position Information - turns on/off a dashboard that shows the current SL and TP levels for the active position.
Recommended SL,TP Settings - turns on/off a dashboard that shows recommended settings for the SL and TP levels.

Relativity Autonomous Distribution Blocks
The relativity method is a method of trade inspired by the Theory of Relativity of Albert Einstein , which argues that trade is a relative concept and, according to the case it advocates, creates the values to be evaluated relatively by using various engineering methods, and converts these values to factors to ensure the highest efficiency.
Many layers are common with Autonomous LSTM.
For more information about Autonomous LSTM :
But there are additional layers that are much higher than that.
These systems use COT (Commitment of Traders) data positively in trade and significantly increase the hit rate compared to conventional methods.
And in all traded instruments, it decides the degree of scoring by linking with global markets.
The more liquidity of the selected parities, the higher the success rate, the higher liquidity in the markets.
***STRUCTURE
Feature Layer 1 : Formulation : Common Layer with Autonomous LSTM
Feature Layer 2: Forecast Algorithm : Common Layer with Autonomous LSTM
Feature Layer 3 : Composite of Two Layers : Adaptive Period (Length) Algorithm : Common Layer with Autonomous LSTM
Feature Layer 4 : High - Low Selection Algorithm : Common Layer with Autonomous LSTM
Feature Layer 5 : Volume (Ticker ) - Open Interest (Global Market) Power Factor according to Global Markets and Related instrument (Ticker)
Feature Layer 6 : Quantum Equations including COT Commercial Positions (Communicate with layer 5)
Feature Layer 7 : World's Price/Earnings Ratio (This layer is automatically added to layer 6 as a factor each week.)
Feature Layer 8 : Distribution Blocks : The design of script as a histogram, with distributional buying and selling points and positive/negative zone coloring, with alerts.
Uses the relativity algorithm. This will contribute not only to leveraged transactions but also to portfolio management and will give a more realistic perspective.
Informs the trading points within the regions.
In this way, it allows for gradual buying and selling and reduces the risk to a much lower level.
These feature allows a difference perspective especially for traders who act with portfolio logic and / or add regular income.
The educational idea I shared in order to set an example for this logic:
***SETTINGS
Menu
1. * Market Type
The menu is divided into 5 different algorithms and covers all instruments around the world.
For example:
Futures : XAUUSD , GC , XAGUSD , SUGARUSD , SB1! , XAGUSD
Stocks : All Stocks and Modified Parities (Example : AAPL/EUR , XAU/XAG , AAPL , MT , BAC)
Forex Excluding USD/X : CHFUSD , EURUSD , EURJPY , AUDNZD
Forex USD/X : USDJPY , USDTRY , USDMXN
Crypto : BTCUSD , ETHUSD , ADAUSD or BTCETH , ETHBTC
2. * Barcolor
Barcolor Plotting Rules : On / off section with these rules when barcolor on :
Orange : Distributional Sell Signal ( Not Short )
Blue : Distributinaol Buy Signal
*** FEATURES
Indicator Features :
Red Background with Cross : Short Signal
Green Background with Cross : Buy Signal
Blue Histogram Color : Distributional Buy Signal
Orange Histogram Color : Distributional Sell Signal
Alerts
Long Alert
Short Alert
Distributional Buy Alert
Distributional Sell Alert
*** USAGE
Since the script uses various Commitment of Traders data, it is designed only for the weekly time frame. ( TF = 1W )
Script does not repaint 1 Week and above time frames . (Source = close )
NOTE :
The script design was inspired by one of RafaelZioni's script :
Best regards.

My AlgoTraderFirst, please find it in your heart to donate to my broke college student fund. I am in the final stages of making an algorithmic trading bot in Python, which hooks up to this particular exchange, but I do not have the disposable income to really test it out, so any donation helps. Comment below to let me know you donated so others can see your support!
Please send BTC Donations to: 13ZJ3xTLgJ6hNrv7e5eyEqhabxivYnuu8p
Please send LTC Donations to: LYeFrR9faLaAxJdB1anqVu3mCNxADZDHND
Anyway, on the the program.
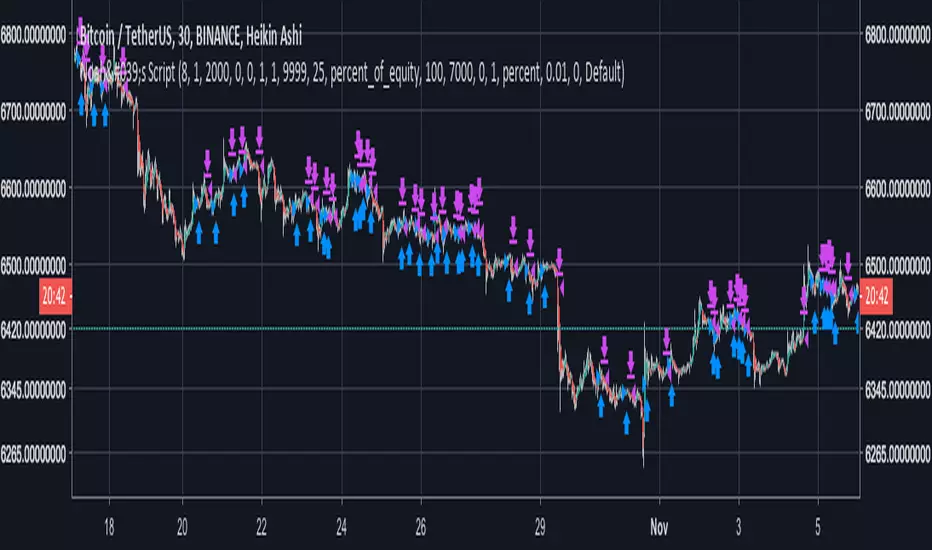
I made an algorithmic trader which uses a set of self made indicators. This algorithm was written in pine version 3 and does not calculate_on_tick , therefore it does not repaint . The numbers you see are, to the best of my understanding, accurate.
Because I was concerned about overfitting, I created this algorithm with the intention of being generalizable to many different trading pairs. This program is generalizable to most trading pairs -- both crypto and normal stocks. This algorithm works best on shorter time frames for crypto markets, and longer timeframes for the conventional stock market.
Please let me know what you think and what I could do better!
Mustang Algo - Momentum Trend Zone Backtest🐎 MUSTANG ALGO - Momentum Trend Zone Strategy
A complete trading system combining MACD momentum analysis with visual trend zones, full backtesting capabilities, and advanced risk management tools.
══════════════════════════════════════════════════════════════════════════
🔹 OVERVIEW
Mustang Algo transforms traditional MACD analysis into a powerful visual trading system. It instantly identifies market bias through colored background zones and provides clear entry/exit signals with customizable stop loss and take profit management.
══════════════════════════════════════════════════════════════════════════
🔹 KEY FEATURES
✅ Visual Trend Zones (Green = Bullish | Red = Bearish)
✅ Clear Buy/Sell Triangles on Chart
✅ Full Backtesting Engine
✅ Multiple Stop Loss Types
✅ Multiple Take Profit Types
✅ Trailing Stop Option
✅ Time Filter for Backtesting
✅ Real-time Info Panel
✅ Customizable Alerts
══════════════════════════════════════════════════════════════════════════
🔹 HOW IT WORKS
The strategy uses a smoothed MACD system to detect trend changes:
- MACD Line (White): Fast EMA minus Slow EMA - shows raw momentum
- Signal Line (Yellow): EMA of MACD - shows smoothed trend direction
- Trend Zone: Changes when the smoothed signal line crosses zero
- Entry Signals: Generated at zone transitions
When the trend line crosses above zero → GREEN zone → BUY signal 🔺
When the trend line crosses below zero → RED zone → SELL signal 🔻
══════════════════════════════════════════════════════════════════════════
🔹 STOP LOSS OPTIONS
🛑 Percentage: Fixed percentage from entry price
🛑 ATR-Based: Dynamic SL based on market volatility
🛑 Fixed Points: Set number of points/pips
🛑 Swing Low/High: Uses recent swing levels as stops
══════════════════════════════════════════════════════════════════════════
🔹 TAKE PROFIT OPTIONS
🎯 Percentage: Fixed percentage target
🎯 ATR-Based: Dynamic TP based on volatility
🎯 Fixed Points: Set number of points/pips
🎯 Risk Reward: Automatic TP based on R:R ratio (e.g., 2:1, 3:1)
══════════════════════════════════════════════════════════════════════════
🔹 TRAILING STOP
📈 Percentage-Based: Trail by a fixed percentage
📈 ATR-Based: Trail using ATR multiplier for dynamic adjustment
══════════════════════════════════════════════════════════════════════════
🔹 SETTINGS
MACD Parameters:
- Fast Length (default: 12)
- Slow Length (default: 26)
- Signal Length (default: 9)
- Trend Smoothing (default: 5)
Risk Management:
- Enable/Disable Stop Loss
- Enable/Disable Take Profit
- Enable/Disable Trailing Stop
- Customize all SL/TP parameters
Visual Options:
- Show/Hide Buy/Sell Triangles
- Show/Hide SL/TP Lines
- Show/Hide Labels
Time Filter:
- Set Start Date for backtest
- Set End Date for backtest
══════════════════════════════════════════════════════════════════════════
🔹 SIGNALS EXPLAINED
🟢 GREEN TRIANGLE (Below Bar):
Bullish zone detected - Consider LONG entry
🔴 RED TRIANGLE (Above Bar):
Bearish zone detected - Consider SHORT entry
🟢 GREEN BACKGROUND:
Currently in bullish trend zone
🔴 RED BACKGROUND:
Currently in bearish trend zone
══════════════════════════════════════════════════════════════════════════
🔹 INFO PANEL
The real-time info panel (top right) displays:
- Current Trend Zone status
- MACD value
- Signal Line value
- Active SL Type
- Active TP Type
══════════════════════════════════════════════════════════════════════════
🔹 ALERTS
Set up alerts for:
🔔 Buy Signals: "🐎 Mustang Algo: BUY Signal on {ticker} at {price}"
🔔 Sell Signals: "🐎 Mustang Algo: SELL Signal on {ticker} at {price}"
══════════════════════════════════════════════════════════════════════════
🔹 BEST PRACTICES
1. Use higher timeframes (1H, 4H, Daily) for more reliable signals
2. Combine with price action and support/resistance levels
3. Adjust ATR multipliers based on asset volatility
4. Use Risk Reward ratio for consistent risk management
5. Backtest on your preferred asset before live trading
══════════════════════════════════════════════════════════════════════════
🔹 RECOMMENDED TIMEFRAMES
⏱️ Scalping: 5M, 15M (more signals, more noise)
⏱️ Day Trading: 1H, 4H (balanced signals)
⏱️ Swing Trading: Daily, Weekly (fewer but stronger signals)
══════════════════════════════════════════════════════════════════════════
🔹 MARKETS
Works on all markets:
📈 Forex
📈 Crypto
📈 Stocks
📈 Indices
📈 Commodities
📈 Futures
══════════════════════════════════════════════════════════════════════════
🐎 RIDE THE TREND WITH MUSTANG ALGO!
══════════════════════════════════════════════════════════════════════════
⚠️ DISCLAIMER
This indicator/strategy is for educational and informational purposes only. It is not financial advice. Trading involves substantial risk of loss and is not suitable for all investors. Past performance is not indicative of future results. Always use proper risk management, do your own research, and consider consulting a financial advisor before making any trading decisions. Use at your own risk.
══════════════════════════════════════════════════════════════════════════
📝 VERSION HISTORY
v1.0 - Initial Release
- MACD-based trend detection
- Visual trend zones
- Multiple SL/TP options
- Full backtesting support
- Trailing stop functionality
- Time filter
- Info panel
- Alert system
══════════════════════════════════════════════════════════════════════════
💬 FEEDBACK
If you find this strategy useful, please leave a comment or suggestion!
Your feedback helps improve future updates.
🐎 Happy Trading!

NexTrade
Overview of NexTrade: The Future of Crypto Trading
Introduction
NexTrade is a cutting-edge algorithmic trading platform designed to optimize cryptocurrency trading strategies. Developed by myself, a software engineer with a passion for quantitative development. Over the past year, I have focused on learning and applying quantitative techniques to the crypto space, ultimately crafting a platform that leverages advanced market analysis, automation, and robust risk management to help investors maximize returns while minimizing risk. NexTrade is engineered to help you capitalize on market movements in a fast-paced and highly competitive space, that is Cryptocurrency.
Key Features and Advantages
Sophisticated Market Analysis: NexTrade uses a comprehensive market analysis framework that examines historical trends, price movements, and market conditions across multiple cryptocurrency exchanges. The algorithm identifies trading opportunities by chart analysis on higher timeframes in order to follow trends, allowing it to execute trades at optimal moments.
Multi-Exchange Integration: NexTrade connects to multiple leading cryptocurrency exchanges, such as Binance, Kraken, and Coinbase Pro, to ensure access to diverse liquidity pools. This multi-exchange connectivity allows the platform to execute trades at the most favorable prices, optimizing profitability and minimizing slippage across various platforms. However, we suggest using the exchange with lowest fees possible.
Risk Management: NexTrade’s risk management features such as Stop Losses, ATR Trailing SL, and ADX chop indicator allows us to ensure we are effectively managing our risk.
Backtesting and Optimization: Before going live, NexTrade’s trading strategies undergo rigorous backtesting using historical market data. This enables users to see how strategies would have performed under various conditions, providing transparency and confidence in the platform’s potential for generating consistent returns. Ongoing optimization ensures that strategies evolve in response to market changes.
Real-Time Performance Monitoring: Users have access to detailed, real-time performance reports, tracking key metrics such as trades executed, profits, losses, and overall portfolio performance. This transparency allows investors to make informed decisions and monitor their investments closely at any time.
Market Opportunity
The cryptocurrency market continues to experience rapid growth, with trillions of dollars in trading volume annually. However, it is also notoriously volatile, creating both risk and reward opportunities for traders. To successfully navigate this market, investors need sophisticated tools that can automate the trading process and optimize decisions based on accurate market analysis.
NexTrade was developed to address this need. With its combination of data-driven market analysis, automated execution, and risk management, NexTrade is positioned to help investors gain an edge in a market that is often unpredictable and challenging. The platform offers a reliable, scalable solution to crypto trading, designed for both beginners and seasoned professionals.
Why Invest in NexTrade?
Scalable and Flexible: Whether you’re trading small amounts or large volumes, NexTrade can scale to accommodate your needs. The platform supports multiple exchanges, giving users the flexibility to diversify and grow their investments. Users can start with as low as $100!
Risk-Adjusted Returns: By focusing on risk management, NexTrade aims to deliver returns that are balanced with the level of risk the investor is willing to accept. The algorithm continuously adjusts trading strategies to align with market conditions, maximizing the potential for profits while minimizing the likelihood of significant losses.
24/7 Trading: The cryptocurrency market operates around the clock, and NexTrade is designed to take advantage of this. Its automated nature means that it can execute trades at any time, without the need for human intervention.
Conclusion
NexTrade offers a sophisticated yet accessible solution for investors looking to capitalize on the growth of the cryptocurrency market. With its focus on data-driven analysis, automated trade execution, and advanced risk management, NexTrade empowers investors to achieve optimal returns while managing risk effectively. Whether you are new to crypto or an experienced trader, NexTrade provides the tools needed to stay competitive and succeed in a fast-moving market.
By investing in NexTrade, you are gaining access to a proven algorithmic trading platform that has the potential to enhance your crypto trading strategy and deliver consistent results. The future of cryptocurrency trading is automated, risk-managed, and optimized—and NexTrade is leading the way.
If users wish the enable the chop detector on the bot, which uses ADX, they can turn it on in the settings after the strategu is added to the chart. By default, it is set to false.

Simple Decesion Matrix Classification Algorithm [SS]Hello everyone,
It has been a while since I posted an indicator, so thought I would share this project I did for fun.
This indicator is an attempt to develop a pseudo Random Forest classification decision matrix model for Pinescript.
This is not a full, robust Random Forest model by any stretch of the imagination, but it is a good way to showcase how decision matrices can be applied to trading and within Pinescript.
As to not market this as something it is not, I am simply calling it the "Simple Decision Matrix Classification Algorithm". However, I have stolen most of the aspects of this machine learning algo from concepts of Random Forest modelling.
How it works:
With models like Support Vector Machines (SVM), Random Forest (RF) and Gradient Boosted Machine Learning (GBM), which are commonly used in Machine Learning Classification Tasks (MLCTs), this model operates similarity to the basic concepts shared amongst those modelling types. While it is not very similar to SVM, it is very similar to RF and GBM, in that it uses a "voting" system.
What do I mean by voting system?
How most classification MLAs work is by feeding an input dataset to an algorithm. The algorithm sorts this data, categorizes it, then introduces something called a confusion matrix (essentially sorting the data in no apparently order as to prevent over-fitting and introduce "confusion" to the algorithm to ensure that it is not just following a trend).
From there, the data is called upon based on current data inputs (so say we are using RSI and Z-Score, the current RSI and Z-Score is compared against other RSI's and Z-Scores that the model has saved). The model will process this information and each "tree" or "node" will vote. Then a cumulative overall vote is casted.
How does this MLA work?
This model accepts 2 independent variables. In order to keep things simple, this model was kept as a three node model. This means that there are 3 separate votes that go in to get the result. A vote is casted for each of the two independent variables and then a cumulative vote is casted for the overall verdict (the result of the model's prediction).
The model actually displays this system diagrammatically and it will likely be easier to understand if we look at the diagram to ground the example:
In the diagram, at the very top we have the classification variable that we are trying to predict. In this case, we are trying to predict whether there will be a breakout/breakdown outside of the normal ATR range (this is either yes or no question, hence a classification task).
So the question forms the basis of the input. The model will track at which points the ATR range is exceeded to the upside or downside, as well as the other variables that we wish to use to predict these exceedences. The ATR range forms the basis of all the data flowing into the model.
Then, at the second level, you will see we are using Z-Score and RSI to predict these breaks. The circle will change colour according to "feature importance". Feature importance basically just means that the indicator has a strong impact on the outcome. The stronger the importance, the more green it will be, the weaker, the more red it will be.
We can see both RSI and Z-Score are green and thus we can say they are strong options for predicting a breakout/breakdown.
So then we move down to the actual voting mechanisms. You will see the 2 pink boxes. These are the first lines of voting. What is happening here is the model is identifying the instances that are most similar and whether the classification task we have assigned (remember out ATR exceedance classifier) was either true or false based on RSI and Z-Score.
These are our 2 nodes. They both cast an individual vote. You will see in this case, both cast a vote of 1. The options are either 1 or 0. A vote of 1 means "Yes" or "Breakout likely".
However, this is not the only voting the model does. The model does one final vote based on the 2 votes. This is shown in the purple box. We can see the final vote and result at the end with the orange circle. It is 1 which means a range exceedance is anticipated and the most likely outcome.
The Data Table Component
The model has many moving parts. I have tried to represent the pivotal functions diagrammatically, but some other important aspects and background information must be obtained from the companion data table.
If we bring back our diagram from above:
We can see the data table to the left.
The data table contains 2 sections, one for each independent variable. In this case, our independent variables are RSI and Z-Score.
The data table will provide you with specifics about the independent variables, as well as about the model accuracy and outcome.
If we take a look at the first row, it simply indicates which independent variable it is looking at. If we go down to the next row where it reads "Weighted Impact", we can see a corresponding percent. The "weighted impact" is the amount of representation each independent variable has within the voting scheme. So in this case, we can see its pretty equal, 45% and 55%, This tells us that there is a slight higher representation of z-score than RSI but nothing to worry about.
If there was a major over-respresentation of greater than 30 or 40%, then the model would risk being skewed and voting too heavily in favour of 1 variable over the other.
If we move down from there we will see the next row reads "independent accuracy". The voting of each independent variable's accuracy is considered separately. This is one way we can determine feature importance, by seeing how well one feature augments the accuracy. In this case, we can see that RSI has the greatest importance, with an accuracy of around 87% at predicting breakouts. That makes sense as RSI is a momentum based oscillator.
Then if we move down one more, we will see what each independent feature (node) has voted for. In this case, both RSI and Z-Score voted for 1 (Breakout in our case).
You can weigh these in collaboration, but its always important to look at the final verdict of the model, which if we move down, we can see the "Model prediction" which is "Bullish".
If you are using the ATR breakout, the model cannot distinguish between "Bullish" or "Bearish", must that a "Breakout" is likely, either bearish or bullish. However, for the other classification tasks this model can do, the results are either Bullish or Bearish.
Using the Function:
Okay so now that all that technical stuff is out of the way, let's get into using the function. First of all this function innately provides you with 3 possible classification tasks. These include:
1. Predicting Red or Green Candle
2. Predicting Bullish / Bearish ATR
3. Predicting a Breakout from the ATR range
The possible independent variables include:
1. Stochastics,
2. MFI,
3. RSI,
4. Z-Score,
5. EMAs,
6. SMAs,
7. Volume
The model can only accept 2 independent variables, to operate within the computation time limits for pine execution.
Let's quickly go over what the numbers in the diagram mean:
The numbers being pointed at with the yellow arrows represent the cases the model is sorting and voting on. These are the most identical cases and are serving as the voting foundation for the model.
The numbers being pointed at with the pink candle is the voting results.
Extrapolating the functions (For Pine Developers:
So this is more of a feature application, so feel free to customize it to your liking and add additional inputs. But here are some key important considerations if you wish to apply this within your own code:
1. This is a BINARY classification task. The prediction must either be 0 or 1.
2. The function consists of 3 separate functions, the 2 first functions serve to build the confusion matrix and then the final "random_forest" function serves to perform the computations. You will need all 3 functions for implementation.
3. The model can only accept 2 independent variables.
I believe that is the function. Hopefully this wasn't too confusing, it is very statsy, but its a fun function for me! I use Random Forest excessively in R and always like to try to convert R things to Pinescript.
Hope you enjoy!
Safe trades everyone!

[Round Numbers] Signal Clean Up Analysis with Backtest (TSO)Round Numbers NEW GEN indicator!
===========================================================================
===========================================================================
This is a full-cycle trading system indicator - it will show and alert each step of the trade from open to close. The algorithm here uses Round Numbers for generating signals, TP (Take Profit) and SL (Stop Loss) levels. Round numbers play big role in trading and can easily become strong support and resistance levels where price can bounce and go the opposite way or go through with a very nice run afterwards.
In addition there is a chained (NOTE: You can select several or ALL of the features, this is not limited to either one) signal cleanup and analysis approach with scheduling and alerting capabilities. Works with most popular timeframes: 1M, 3M, 5M, 15M, 30M, 1H, 4H, D.
NOTE: Every action of the trade is calculated on a confirmed closed candle bar state (barstate.isconfirmed), so the indicator will never repaint!
NOTE: At position open - there will be calculated Take-Profit and Stop-Loss targets, however each target is considered hit, when candle bar closes breaking that target, so Take-Profit and Stop-Loss when hit will slightly differ then what you see at trade/position open.
===========================================================================
===========================================================================
Round Numbers up|down unit setting and overall explanation
---------------------------------------------------------------------------
Round Number up|down unit: is the distance between round numbers on the chart. Since these round number levels are also used by the algorithm to open/close trades, it is important to set this setting to a logical number, which will correspond to an average price movement of the instrument.
Here are some examples for a few popular instruments on what will the default 1 round number unit correspond to and what would be suggested:
BTCUSD > $1 (this won't work for Bitcoin, try at least $100 - 100units)
SPY: > $1 (one of the best settings for SPY or QQQ, 50cents shows good results as well - 0.5units)
FOREX (all major pairs): > 10PIPs (that may be a bit small, unless scalping, try 50PIPs - 5units)
===========================================================================
===========================================================================
Explanation of all the Features | Strategy Configuration Guide | Indicator Settings | Signal Cleanup Analysis
---------------------------------------------------------------------------
>>> Customizable Backtesting for a specific date range, results via TradingView strategy, which includes “Deep Backtesting” for largest amounts of data on trading results.
>>> Trading Schedule with customizable trading daily time range, automatic closing/alert trades before Power Hour or right before market closes or leave it open until next day.
>>> 3 Trading Systems.
>>> Static/Dynamic/Trailing Take-Profit and Stop-Loss setups (HIGHLIGHT: Stop-Loss will be moved to Entry after TP1 is taken or a smart trailing Stop-Loss can be used with Stop-Loss dynamically following the trade to minimize risk).
>>> Single or Multiple profit targets (up to 5).
>>> Take-Profit customizable offset feature (set your Take-Profit targets slightly before everyone is expecting it!).
>>> Candle bar signal analysis (matching candle color, skip opposite structured and/or doji candle uncertain signals).
>>> Additional analysis of VWAP/EMA/ATR/EWO (Elliot Wave Oscillator)/Divergence MACD+RSI/Volume signal confirmation (clean up your chart with indicator showing only the best potential signals!).
>>> Advanced Alerts setup, which can be potentially setup with a trading bot over TradingView Webhook (NOTE: This will require advanced programming knowledge).
===========================================================================
Labels, plots, colors explanations:
---------------------------------------------------------------------------
>>>>> LONG open: green "house" looking arrow below candle bar.
>>>>> SHORT open: red "house" looking arrow above candle bar.
>>>>> LONG/SHORT take-profit target: green/red circles (multi-profit > TP2/3/4/5 smaller circles).
>>>>> LONG/SHORT stop-loss target: green/red + crosses.
>>>>> LONG/SHORT take-profit hits: green/red diamonds.
>>>>> LONG/SHORT stop-loss hits: green/red X-crosses.
>>>>> LONG/SHORT EOD (End of Day | Intraday style) close (profitable trade): green/red squares.
>>>>> LONG/SHORT EOD (End of Day | Intraday style) close (loss trade): green/red PLUS(+)-crosses.
===========================================================================
Date Range and Trading Schedule Settings
---------------------------------------------------------------------------
>>>>> Date Range: Select your start and/or end dates (uncheck “End” for indicator to show results up to the very moment and to use for LIVE trading) for backtesting results, if not using backtesting – uncheck “Start”/“End” to turn it off.
>>>>> Use TradingView “Strategy Tester” to see backtesting results
NOTE: If Strategy Tester does not show any results with Date Ranged fully unchecked, there may be an issue where a script opens a trade, but there is not enough TradingView power to set the Take-Profit and Stop-Loss and somehow an open trade gets stuck and never closes, so there are “no trades present”. In such case you will need to manually check “Start”/“End” dates or use “Depp Backtesting” feature!
>>>>> Trading Schedule: This is where you can setup Intraday Session or any custom session schedule you wish. Turn it ON. Select trading hours. Select EOD (End of Day) setting (NOTE: If it will be OFF, the indicator will assume you are holding your position open until next day!). Please note the EOD trade closure times with the 2 different Intraday close settings when turned on:
At Market Close:
1/3/5min > will close at 15:55pm ET
15min > will close at 15:45pm ET
30min > will close at 15:30pm ET
45min > will close at 15:45pm ET
60min > will close at 15:00pm ET
Before Power Hour:
1/3/5min > will close at 15:00pm ET
15min > will close at 15:00pm ET
30min > will close at 15:00pm ET
45min > will close at 15:00pm ET
60min > will close at 15:00pm ET
>>> Trading Systems: 1) "Open Until Closed by TP or SL": the signal will only open a trade if no trades are currently open/trunning, a trade can only be closed by Take Profit, Stop Loss or End of Day close (if turned on) | 2) "Open Until Closed by TP or SL + OCA": Same as 1), but if there is an opposite signal to the trade which is currently open > it will immediately be closed with new trade open or End of Day close (if turned on) | 3) "OCA (no TP or SL)": There are is Take Profit or Stop Loss, only an opposite signal will close current trade and open an opposite one or End of Day close (if turned on).
>>> Turn On/Off: Current Position SL + Opposite Position Open Signal on the same closing candle bar (If current trade hits Stop-Loss and at that same closing candle bar there is a signal for an opposite direction trade > indicator will close current position as Stop-Loss and immediately open an opposite position). NOTE: With this option turned on, there will be more trades, but not necessarily better results, since after Stop-Loss is hit, it may make sense to wait a little before opening an opposite trade, even if it matches the condition at the same time when Stop-Loss is hit, but sometimes it shows great results, so this setting/feature is included. NOTE: This setting only will work/make sense with TP and SL style/behavior both be set to "Fully Closed Candle"!
>>> Turn On/Off: Turn On/Off: Current Position REGULAR SL | Only the SL + Opposite Position Open will trigger if turned on, IF NOT - THERE WILL BE NO STOP-LOSS AT ALL!!! NOTE: It is very dangerous to trade without Stop-Loss!
>>>>> Signal Candle Bar consuming Take-Profits - position/trade signal candle bar is big enough to "consume"/close ahead the first TP setting > the signal can either be skipped, or all Take-Profit areas pushed ahead using smart formula)
>>>>> MULTIPROFIT | TP (Take-Profit) System: 1) Static – Once the trade is open, all Take-Profit target(s) are immediately calculated and set for the trade > once the target(s) is hit > trade will be partially closed (if candle bar closes beyond several Take-Profit targets > trade will be reduced accordingly to the amount of how many Take-Profit targets were hit) ||| 2) Dynamic – Once the trade is open, only the 1st Take-Profit target is calculated, once the 1st Take-Profit is hit > next Take-Profit distance is calculated based on the distance from trade Entry to where 1st Take-Profit was taken, once 2nd Take-Profit is taken > 3rd Take-Profit is calculated per same logic, these are good for price momentum as with price speeding up – profits increase as well!
>>>>> MULTIPROFIT: SL (stop loss) System | Static: SL is set at position open and remains such; Dynamic: Once ANY TP is taken > SL will be moved to Entry; Trailing: SL will be moved along the position (smart trailing stop-loss), at TP1 taken > SL moves to Entry, at TP2 taken > SL moves to TP1, at TP3 taken > SL moves to TP2 and so on.
>>>>> # of TPs (number of take profit targets): Just like it is named, this is where you select the number of Take-Profit targets for your trading system (NOTE: If "OCA (no TP or SL)" Trading System is selected, this setting won’t do anything, since there are no TP or SLs for that system).
>>>>> TP(s) offset: This is a special feature for all Take-Profit targets, where you can turn on a customizable offset, so that if the price is almost hitting the Take-Profit target, but never actually touches it > you will capture it. This is good to use with HHLL (Highest High Lowest Low), which is pretty much a Support/Resistance as often the price will nearly touch these strong areas and turn around…
===========================================================================
Dynamic/Static/Trailing Take-Profit and Stop-Loss visual examples:
---------------------------------------------------------------------------
1) Fully Static Take-Profit and Stop-Loss
This one is a fully static setup for both Take-Profit and Stop-Loss, you can also observe how trade is closed right before the Power Hour (trade can be closed right before Power Hour or right before Market Closes or left overnight as desired).
2) Static/Dynamic, Static Take-Profit and Dynamic Stop-Loss
You can see a static Take-Profit set at position open, while Stop-Loss moves to Entry once TP1 target is taken.
3) Static/Trailing, Static Take-Profit and Trailing Stop-Loss
In here with each Take-Profit taken, Stop-Loss moves along the trade to previous Take-Profit level, you can notice how stop-loss literally follows the trade and reduces the potential loss.
4) Dynamic/Trailing, Dynamic Take-Profit and Trailing Stop-Loss
See how Take-Profit distances increase with price momentum. Just like in previous example - Trailing Stop-Loss is following the trade and reducing the riks.
===========================================================================
Signal Analysis and Cleanup Settings
---------------------------------------------------------------------------
>>>>> Candle Analysis | Candle Color signal confirmation: If closed candle bar color does not match the signal direction > no trade will be open.
>>>>> Candle Analysis | Skip opposite candle signals: If closed candle bar color will match the signal direction, but candle structure will be opposite (for example: bearish green hammer, long high stick on top of a small green square) > no trade will be open.
>>>>> Candle Analysis | Skip doji candle signals: If closed candle bar will be the uncertain doji > no trade will be open.
>>>>> Divergence/Oscillator Analysis | EWO (Elliot Wave Oscillator) signal confirmation: LONG will only be open if at signal, EWO is green or will be at bullish slope (you can select which setting you desire), SHORT if EWO is red or will be at bearish slope.
>>>>> Divergence/Oscillator Analysis | VWAP signal confirmation: LONG will only be open if at signal, the price will be above VWAP, SHORT if below.
>>>>> Divergence/Oscillator Analysis | Moving Average signal confirmation: LONG will only be open if at signal, the price will be above selected Moving Average, SHORT if below.
>>>>> Divergence/Oscillator Analysis | ATR signal confirmation: LONG will only be open if at signal, the price will be above ATR, SHORT if below.
>>>>> Divergence/Oscillator Analysis | RSI + MACD signal confirmation: LONG will only be open if at signal, RSI + MACD will be bullish, SHORT if RSI + MACD will be bearish.
>>>>> Volume signal confirmation: LONG/SHORT will only be opened with strong Volume matching the signal direction, by default, strong Volume percentage is set to 150% and weak to 50%, but you can change it as you desire.
===========================================================================
||||||||||||||||||||||||||||||||||| *** ||||||||||||||||||||||||||||||||||| *** |||||||||||||||||||||||||||||||||||
||||||||||||||||||||||||||||||||||| *** ||||||||||||||||||||||||||||||||||| *** |||||||||||||||||||||||||||||||||||
TP System - VERY IMPORTANT INFO!
-------------------------------------------------------------------------------------------------------------------
"TP PERCENTAGE" - amount by which current trade/position needs to be reduced/partially closed/sold.
-------------------------------------------------------------------------------------------------------------------
TP System: Dynamic
"TP PERCENTAGE" - will always be the same amount (trade/position size divided by the # of take-profit(TP) targets) and percentage to be closed will always be of the ORIGINAL trade/position.
-------------------------------------------------------------------------------------------------------------------
TP System: Static
"TP PERCENTAGE" - will always be the same amount IF take-profit(TP) targets are hit 1-by-1 (TP1 > TP2 > TP3 > TP4 > TP5), otherwise it will vary and unless it is a 1st take-profit(TP1), the REMAINING trade/position size will always be smaller than original and therefore the percentage to be closed will always be of the REMAINING trade/position and NOT the original one!
-------------------------------------------------------------------------------------------------------------------
"TP PERCENTAGE" CheatSheet (these are the only percentages you may see)
-----------------------------------------------------------------------
TP PERCENTAGE---Close/Sell Amount-------------Example (trade size: 50 stocks)
20%-------------trade size * 0.2--------------50 * 0.2 = 10 stocks
25%-------------trade size * 0.25-------------50 * 0.25 = 12.5(~13) stocks
34%-------------trade size * 0.34-------------50 * 0.34 = 17 stocks
40%-------------trade size * 0.4--------------50 * 0.4 = 20 stocks
50%-------------trade size * 0.5--------------50 * 0.5 = 25 stocks
60%-------------trade size * 0.6--------------50 * 0.6 = 30 stocks
66%-------------trade size * 0.66-------------50 * 0.66 = 33 stocks
75%-------------trade size * 0.75-------------50 * 0.75 = 37.5(~38) stocks
80%-------------trade size * 0.8--------------50 * 0.8 = 40 stocks
100%------------trade size--------------------50 = 50 stocks
-----------------------------------------------------------------------
If for any reason a portion of the current/remaining trade closed at such occurrence was slightly wrong, it is not an issue. Such occurrences are rare and with slight difference in partial TP closed is not significant to overall performance of our algorithms.
||||||||||||||||||||||||||||||||||| *** ||||||||||||||||||||||||||||||||||| *** |||||||||||||||||||||||||||||||||||
||||||||||||||||||||||||||||||||||| *** ||||||||||||||||||||||||||||||||||| *** |||||||||||||||||||||||||||||||||||
Alert Settings (you don’t have to touch this section unless you will be using TradingView alerts through a Webhook to use with trading bot)
---------------------------------------------------------------------------
Here is how a LONG OPEN alert looks like.
NOTE: Each label , , etc. is customizable, you can change the text of it within indicator Input settings.
ALERT >>>>>>>>>>>>>>>>>>>>>>>>>>>>>>>>>>>>>>>>>>>>>>>
COIN: BTCUSD
TIMEFRAME: 15M
LONG: OPEN
ENTRY: 20000
TP1: 20500
TP2: 21000
TP3: 21500
TP4: 22500
TP5: 23500
SL: 19000
Leverage: 0
---------------------------------------------------------------------------
Here is how a TP1 alert will look with 5 TPs breakdown of the trade.
NOTE1: Next to TP1 taken it will show at which price it was triggered.
NOTE2: Next to "TP Percentage" it shows how much of the CURRENT/ACTIVE/REMAINING trade needs to be closed.
NOTE2: If TP2/3/4/5 comes before TP1 - the alert will tell you exactly how many percent of the trade needs to be closed!
ALERT >>>>>>>>>>>>>>>>>>>>>>>>>>>>>>>>>>>>>>>>>>>>>>>
COIN: BTCUSD
TIMEFRAME: 15M
LONG: TP1
TP1: 20500
TP Percentage: 20%
---------------------------------------------------------------------------
Here is how an alert will look for LONG - STOP-LOSS.
ALERT >>>>>>>>>>>>>>>>>>>>>>>>>>>>>>>>>>>>>>>>>>>>>>>
COIN: BTCUSD
TIMEFRAME: 15M
ENTRY: 20000
LONG: SL
SL: 19000
---------------------------------------------------------------------------
Here is how an alert will look for LONG - EOD (End of Day) In Profit close.
ALERT >>>>>>>>>>>>>>>>>>>>>>>>>>>>>>>>>>>>>>>>>>>>>>>
COIN: BTCUSD
TIMEFRAME: 15M
LONG: EOD-Close (profit)
ENTRY: 20000
EOD-Close: 21900
===========================================================================
Adding Alerts in TradngView
---------------------------------------------------------------------------
-Add indicator to chart and make sure the correct strategy is configured (check Backtesting results)
-Right-click anywhere on the TradingView chart
-Click on Add alert
-Condition: Select this indicator by it’s name
-Immediately below, change it to "alert() function calls only", as other wise there will be 2 alerts for every alert!
-Expiration: Open-ended (that may require higher tier TradingView account, otherwise the alert will need to be occasionally re-triggered)
-Alert name: Whatever you desire
-Hit “Create”
-Note: If you change ANY Settings within the indicator – you must DELETE the current alert and create a new one per steps above, otherwise it will continue triggering alerts per old Settings!
===========================================================================
If you have any questions or issues with the indicator, please message me directly via TradingView.
---------------------------------------------------------------------------
Good Luck! (NOTE: Trading is very risky, past performance is not necessarily indicative of future results, so please trade responsibly!)
---------------------------------------------------------------------------
NOTE: There seems to be a strange glitch when strategy is running live, it will show "double-take" take-profits labels on the chart. This is not affecting the script logic and backtesting results, if you simply change the timeframe real quick to something else then back - it will no longer show the duplicate orders... this must be some sort of a glitch as every alert was thoroughly tested to make sure everything is working!

Alpha-Numerologia by Alien CrewAlpha-Numerologia is our latest generation of market analytical tools, built completely from the ground up using a new cutting-edge mathematical formula, designed by the Alien Crew team.
The purpose of this tool, is to tap into the mathematics behind the market prices themselves, in order to extrapolate areas where the price is likely to find support or resistance. This indicator does not use Fibonacci or Pivot Points in any way whatsoever. It does however rhyme with them every now and then, as is the systematic nature of markets. The key strength of this indicator is its ability to adapt to ever-evolving market conditions, providing users with a real-time, clear visualization of essential price zones.
There are several aspects to the process that goes on in this algorithm. Firstly, it gathers range data from multiple lookback periods of time to understand the underlying asset volatility and reference points for calculation. Following that, it identifies the numerical structure of all the ranges, and finds their common denominators, which are essentially subsets. These subsets are then scaled in real-time, reacting to the change in volatility. A scaling mechanism occurs when the volatility either increases or decreases, causing the algorithm to recalculate the levels using the identified subsets. Since each subset has the same character as the whole, it is by definition a fractal. From a mathematical standpoint, such subsets have no limits on scale. They can be infinitesimal, or infinitely large.
Such a fractal nature provides the benefit of this algorithm being able to adjust to virtually any asset and any chart timeframe. Furthermore, through the monitoring of several temporal periods it is able to correlate alignments of the subsets, which is denominated as a percentage on the chart. Such confluences give more importance to the detected level.
---
Remember, the world of trading comes with significant risks and unpredictability. While the Alpha-Numerologia Indicator is a highly sophisticated tool, it should be used in combination with other analytical techniques and a sound risk management strategy. Always conduct your own research before making trading decisions. Due to the extended research and work placed into it, the inner workings behind Alpha-Numerologia are proprietary, and shall not be discussed or disclosed in any way by Alien Crew. The source code is not for sale either.

AUTOMATIC GRID BOT STRATEGY [ilovealgotrading]
OVERVIEW:
This Grid trading strategy can help you maximize your profit in a ranging sideways market with no clear direction.
INDICATOR:
We can get some money by taking advantage of the movement of the price between the range we have determined.
Short positions are opened while the price is rising, long positions are opened while the price is falling.
Therefore, there is no need to predict the trend direction.
What is different in this indicator:
I want to say thank you to © thequantscience. His GRID SPOT TRADING ALGORITHM - GRID BOT TRADING strategy helped me when I was writing my indicator.
I want to explain what I have improved:
1- Grid strategy is a type of strategy that can be traded in very short time frames and users can trade this strategy algorithmically by connecting this strategy to their own accounts with the help of API systems. For this reason, I have developed a software that can give us signals by dynamically changing the long and short messages when users are trading.
2- We can change the start and end dates of our grid bot as we want. It is necessary to use this setting when setting up automatic bots, so that previously opened transactions are not taken into account.
3 - Lot or quantity size should not be excessively small when users are taking automatic trades because exchanges have limitations, to avoid this problem, I have prevented this error by automatically rounding up to the nearest quantity size inside the software.
4 - Users can avoid excessive losses by using stop loss on this grid bot if they wish.
5 - When our price is over the range high or below the range low, our open positions are closed, if the stop button is active. We can also change which close price time frame we take as a basis from the settings.
6 -Users can set how many dollars they can enter per transaction while performing their transactions automatically.
IMPLEMENTATION DETAILS – SETTINGS:
This script allows the user to choose the highs and lows leves of our range. Our bot trades in the specified range.
1. This strategy allows us to set start and end backtest dates.
2. We can change range high and range low leves of our bot
3. IF people want to trade algorithmically with the help of this bot, there are 6 different input systems that will receive the Json codes as an alarm
4. IF the price closes above the upper line or below the lower line, all transactions will be closed. We can determine in which time frame our transactions will be stopped if the price closes outside these levels.We can adjust how our bot works by activating or turning off the Stop Loss button.
5. In this strategy, you can determine your dollar cost for per position.
6. The user can also divide the interval we have determined into 10 parts or 20 equal parts.
7. The grid is divided and colored at the interval we set. At the same time, if we don't want we can turn off colored channels.
Notes:
If you're going to connect this bot to an automatic Long and Short direction,
Don’t forget! you need to Webhook URL,
Don’t miss paste this code to your message window {{strategy.order.alert_message}}
ALSO:
Set your range below the support zones and above the resistance zones.
Don't be afraid to take a wide range, it doesn't matter if you make a little money, the important thing is that you don't lose money.
If you have any ideas what to add to my work to add more sources or make calculations cooler, suggest in DM .

Mean Reverse Grid Algorithm - The Quant ScienceMean Reverse Grid Algorithm - The Quant Science™ is a dynamic grid algorithm that follows the trend and run a mean reverting strategy on average percentage yield variation.
DESCRIPTION
Trades on different price levels of the grid, following the trend. The grid consists of 10 levels, 5 higher and 5 lower. The grids together create a channel, this channel represents the total percentage change where the algorithm works. The channel also represents the average change yields of the asset, identified during analysis with the "Yield Trend Indicator".
The algorithm can be set long or short.
1. Long algorithm: opens long positions with 20% of the capital every time the price crossunder a lower grid, for a maximum total of 5 simultaneous trades. Trades are closed each time the price crossover a higher grid.
2. Short algorithm: opens short positions with 20% of the capital every time the price crossover a higher grid, for a maximum total of 5 simultaneous trades. Trades are closed each time the price crossunder a lower grid.
USER INTERFACE SETTING
The user configures the percentage value of each grid from the user interface.
AUTO TRADING COMPLIANT
With the user interface, the trader can easily set up this algorithm for automatic trading. Automating it is very simple, activate the alert functions and enter the links generated by your broker.
BACKTESTING INCLUDED
With the user interface, the trader can adjust the backtesting period of the strategy before putting it live. You can analyze large periods such as years or months or focus on short-term periods.
NO LIMIT TIMEFRAME
This algorithm can be used on all timeframes and is ideal for lower timeframes.
GENERAL FEATURES
Multi-strategy: the algorithm can apply either the long strategy or the short strategy.
Built-in alerts: the algorithm contains alerts that can be customized from the user interface.
Integrated grid: the grid indicator is included.
Backtesting included: automatic backtesting of the strategy is generated based on the values set.
Auto-trading compliant: functions for auto trading are included.
ABOUT BACKTESTING
Backtesting refers to the period 1 August 2022 - today, ticker: ETH/USDT, timeframe 1H.
Initial capital: $1000.00
Commission per trade: 0.03%

NVME Vanquisher X"Enter with precision, focus on the mission, dismiss the indecision, support NVME's vision" ~ That is what the Vanquisher X will provide.
One may ask, what is so unique about it compared to other algorithms?
We have our own calculation module and strategy that uses other indicators and maths to determine the next location of the trend and with our algorithm you can have full customisation of all the features we have. You can change the overall colour scheme of every single plot within the indicator, you can change the algorithms sensitivity and scalar to as many different numbers as possible, there are helpful drawings, trend confirming drawings, pullback drawings, pair mark-ups, custom dashboards and much more. Our settings panel is also simple and easy to use providing you with different appropriately named subsections for each feature and there are tooltips to let you know what each tab or input does. So, traders if that doesn't get you hooked then keeping reading!
Traders commonly struggle to decide whether or not to enter a trade, hold a trade, stop a trade or take profit and that is what makes us different. You stop when you see the opposite signal or a change in candle colour, you can follow our automatic TP and SL levels for trade goals and you enter when a signal meets your analysis.
NVME Vanquisher X is to be used as confluence with your analysis or trading style and should not in anyway shape or form be used as a indication to buy or sell just because the signal says so, it is there to give you a higher chance of having a high probability trade though past results is not indicative of future results and getting access doesn't mean you will become a millionaire in a day as it is not a get rich quick indicator so it won't guarantee 100% success.
What is your goal?
Our goal is to give you traders an edge in trading, whether it be for stocks, indices, cryptos, forex, commodities, futures and altcoins, all assets are supported and we want to make the best of every trader with NVME.
Recommended Timeframes:
15 Minutes, 1 Hour, 4 Hour with our settings of 2 or 3 sensitivity and 144 on the algo scalar.
Does it support all chart types?
Yes, all charts supported, however we recommend Heikin-Ashi as an optimal choice for trading but if you are already experienced with something else then you can use that :)
Screenshots:
Features:
/Trend Confirming Drawings:
-200 EMA (Added so that free users don't have to waste 1 indicator space)
-Trend Cloud (Colour switches from negative to positive depending on the trend and the cloud has a low fill opacity)
-Confirmation Highlight (Highlights the background with a positive or negative colour depending on the trend identified)
-Following Highlight (Unique highlighting to the background that shows either a positive or negative colour based on the trend however it doesn't identify ranging markets)
//Combinations//
-TC+EMA, EMA+Highlight, Cloud+Highlight, FH+EMA, FH+CLOUD, All v1 (EMA+CLOUD+CH), All v2 (EMA+CLOUD+FH)
/Helpful Drawings:
-Predictive Channel (Using candle maths, this will plot a price following linear regression channel that can be useful for breakout trading or using as support and resistance)
-Predictive S/R (Using candle maths and validation, this will plot support and resistance zones across the market to show you different areas where price could reject or reverse)
-Predictive Trend-Lines (Using candle maths and EMA, this will plot a trend-line in the direction of the trend and this can be useful for breakout trading or following the trend)
-Predictive Supply and Demand Highlight (Using other indicators, this will plot a highlight filled plot that will outline areas of supply and demand, which can be useful for support and resistance trading)
-Previous Order Blocks (Using candle maths, validation and confirmation latency, this will plot filled in squares of potential orders blocks from the past so they can be used for future reference in analysis)
-Predictive ZigZag (Using candle maths, this will plot a price following line that forms a zig zag pattern to show if the market is going in a higher high and higher low formation or lower low and lower high formation)
-Predictive Pivot-Points (Using candle maths and higher-timeframe data, this will plot pivot zones up to support 5 and resistance 5 with midpoints for every section there is)
/Pullback Drawings:
-EMA Pullback (Added so that free users don't have to waste 1 indicator space)
-Bollinger Heatbands (Using the Bollinger Bands indicator, we have created a price following support and resistance heat-map that shows you the whereabouts of the dynamic support and resistance that is indicator based)
-EMA+HB (This combines the ema and the heatbands)
-Fib Retracements (This feature will automatically plot a fibonacci retracement based off predictive market data and our own optimal settings so that you don't need to change them)
/Pair Mark-Ups:
-Weekly Info (This will show you the previous lows and high of the weekly candle and using an ATR, we have added potential reversal zones in those areas and we have a midpoint too)
-Daily Info (Same as the weekly info but for the daily timeframe)
-4 Hr Info (Same as the weekly info but for the 4 hourly timeframe)
/Colour Schemes:
-Default (Strong green, dark purple, strong red)
-Blue and Orange
-Strawberry and Lime
-Apple and Mango
-Orange Passionfruit
-Rhubarb and Custard
-Black and White
-Forest Greens
-Galaxy
-No Colour Scheme (removes the preset colours so they are the same as your TradingView bar settings)
-Show ATR TP and SL levels (This will plot 4 lines, 3 lines are the take profit levels, and the 4th line is the stop loss line, since it is atr based it may fluctuate the distance between each line indicating possible liquidity)
/Dashboard Settings
-High (Will place the dashboard's Y position to follow the high of the price)
-Middle (Will place the dashboard's Y position to the difference of the lowest low and highest high)
-Forced Middle (Will place the dashboard's Y position to the difference of the lowest low further back and highest high further back)
-Low (Will place the dashboard's Y position to follow the low of the price)
-No Dashboard (Deletes the dashboard from the charts)
-Dashboard's X position (Input field, this will change the X value, the higher it is the further away it is from price and the lower it is the closer the dashboard is towards price)
/Dashboard W/R Goals:
-Adaptive (Randomly chooses a strategy follow, can be highly inaccurate, and when price hits tp 1 it will add a win and if it hits sl it will count as a loss)
-5 Pips to 5 Pips (This will change the calculator to only add values for this set condition and this won't be strategy based but instead signal based)
-5 Pips to 10 Pips (1:2 Risk Reward)
-10 Pips to 20 Pips (1:2 Risk Reward, Higher Stop and TP)
-10 Pips to 30 Pips (1:3 Risk Reward, Higher Stop and TP)
-20 Pips to 40 Pips (1:2 Risk Reward, Higher Stop and TP)
/Dashboard Add-ons:
-MTF Trends (This will add more text onto the dashboard and this will show you the trends of the higher timeframes)
-EMA (This will show you the EMA trends on the dashboard)
-VWMA (This will show you the VWMA trends on the dashboard)
-HMA (This will show you the HMA trends on the dashboard)
-Text Colour (This is a colour input and this allows you to change the colour of the dashboard to anything you like)
/Customisable Alerts:
-Buy Alerts (This will allow buy alerts to be sent through any TradingView notifications)
-Sell Alerts (This will allow sell alerts to be sent through any TradingView notifications)
-Range to Uptrend (May be buggy, this will send an alert if the colour goes from undecided to an uptrend colour (positive colour))
-Range to Downtrend (May be buggy, this will send an alert if the colour goes from undecided to a downtrend colour (negative colour))
-Previous Bullish Order Block (This will send an alert if a previous bullish order block has been printed to help with your analysis)
-Previous Bearish Order Block (This will send an alert if a previous bearish order block has been printed to help with your analysis)

Tradespot Quant - Strategy & AlertsTradespot - Quant is an extensive trading algorithm, signal generator and technicals screener packed into one beautifully designed, functional indicator. The script is very customisable to not limit the trader using it but does have some very respectable default settings for BTCUSD on the 4H and 15M charts that we run in an automated fashion here a Tradespot round the clock on Binance Futures.
What does Tradespot Quant do?
Trade following signals generated via our bespoke algorithm
Full customisation to allow a deeper use of the indicator across different assets
Full risk management with take profit and stop loss levels (configurable) built in
Presets for BTCUSD & ETHUSD on the 4H/15M timeframes avaliable instantly for your use.
Innovative trade panel that illustrates key information such as what trade the algorithm is looking for next
More features being added all the time, we have great ideas and our only limitation is how fast we can program it!
Cornix compatible alerts - with the easiest of configurations you can automate this execution of this strategy.
Do you do a free trial?
Yes! Get in touch for a complimentary 48 hour free trial to the indicator, no strings attached.
Who are you?
Tradespot has been creating scripts for years on TradingView that we use to leverage our social trading and signal group offerings. We currently have over $200K in assets trading with our strategies across over 300 users.
You can learn more about us on our website. Please reach out to me or see the link on our profile.
BTC and ETH Long strategy - version 1I will start with a small introduction about myself. I'm now trading cryto currencies manually for almost 2 years. I decided to start after watching a documentary on the TV showing people who made big money during the Bitcoin pump which happened at the end of 2017.
The next day, I asked myself "Why should I not give it a try and learn how to trade".
This was in February 2018 and the price of Bitcoin was around 11500USD.
I didn't know how to trade. In fact, I didn't know the trading industry at all.
So, my first step into trading was to open an account with a broken. Then I directly bought 200$ worst of BTC . At that time, I saw the graph and thought "This can only go back in the upward direction!" :)
I didn't know anything about Stop loss, Take profit and Risk management.
Today, almost 2 years after, I think that I know how to trade and can also confirm that I still hold this bag of 200$ of bitcoin from 2018 :)
I did spend the 2 last years to learn technical analysis , risk management and leverage trading.
Today (14/05/2020), I know what I'm doing and I'm happy to see that the 2 last years have been positive in terms of gains. Of course, I did not make crazy money with my saving but at least I made more than if I would have kept it in my bank account.
Even if I like trading, I have a full time job which requires my full energy and lots of focus, so, the biggest problem I had is that I didn't have enough time to look at the charts.
Also, I realized that sometimes, neither technical analysis , nor fundamentals worked with crypto currency (at least for short time trading). So, as I have a developer background I decided to try to have a look at algo trading.
The goal for me was neither to make complex algos nor to beat the market but just to automate my trading with simple bot catching the big waves.
I then started to take a look at TV pine script and played with it.
I did my first LONG script in February 2020 to Long the BTC Market. It has some limitations but works well enough for me for the time being. Even if the real trades will bring me half of what the back testing shows, this will still be a lot more than what I was used to win during the last 2 years with my manual trading.
So, here we are! Below you will find some details about my first LONG script. I'm happy to share it with you.
Feel free to play with it, give your comments and bring improvements to it.
But please note that it only works fine with the candle size and crypto pair that I have mentioned below. If you use other settings this algo might loose money!
- Crypto pairs : XBTUSD and ETHXBT
- Candle size: 2 Hours
- Indicator used: Volatility , MACD (12, 26, 7), SMA (100), SMA (200), EMA (20)
- Default StopLoss: -1.5%
- Entry in position if: Volatility < 2%
AND MACD moving up
AND AME (20) moving up
AND SMA (100) moving up
AND SMA (200) moving up
AND EMA (20) > SAM (100)
AND SMA (100) > SMA (200)
- Exit the postion if: Stoploss is reached
OR EMA (20) crossUnder SMA (100)
Here is a summary of the results for this script:
XBTUSD : 01/01/2019 --> 14/05/2020 = +107%
ETHXBT : 01/01/2019 --> 14/05/2020 = +39%
ETHUSD : 01/01/2019 --> 14/05/2020 = +112%
It is far away from being perfect. There are still plenty of things which can be done to improve it but I just wanted to share it :) .
Enjoy playing with it....

BCH Precognition - Mtrl_ScientistHello everyone,
Following up on my first bot, I've tuned my algorithm to work with Bitcoin Cash. In order to get rid of these nasty (and sometimes costly) indecision points, I've just enabled the 'Recalculated After Order Fill' option, which... well, recalculates the algorithm on the spot (instead of waiting for 1 additional bar) for situations where a signal is immediately followed by a conflicting signal, effectively cancelling it out. Obviously you have to rely on your own judgement if that happens in a real world scenario. However, in this simulated environment, this change resulted in a 0% risk, whereas the gain exceeded 800% with an initial capital of $100'000.
Again, in order for the results to be as accurate as possible, I've averaged the date from all major exchanges.
All of this is free to use for you, and you are welcome to share it.
If you like it, please give me a follow on Trading View & Twitter.
If you have any requests or suggestions/concerns, please let me know!
Note:
- This algorithm works best for Heikn Ashi candles, but I'm working on improving it for normal candles
- This is not financial advice (I'm in chemistry, not finance), so do your own research
Mtrl_Scientist
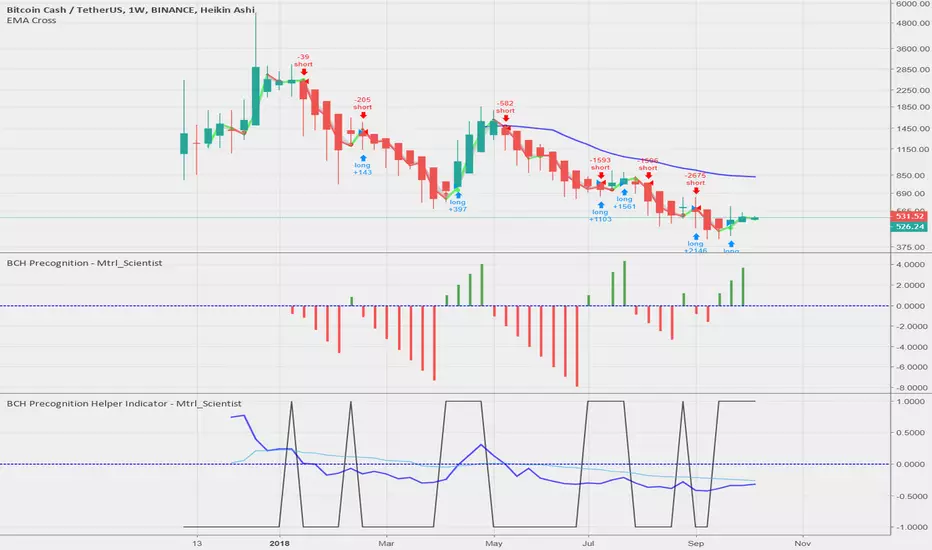
ZZ Traders ALGO📌 ZZ Traders ALGO – Smart Trading Companion for Every Timeframe
Introducing "ZZ Traders ALGO" – a precision-built, multi-timeframe algorithm designed for GOLD traders who value accuracy, efficiency, and real-time insights.
🔹 Universal Timeframe Compatibility:
Works seamlessly across all timeframes – from scalping the 1-minute chart to analyzing long-term trends on the daily and weekly levels.
🔹 Optimized for XAU/USD (Gold):
Specially tuned to capture the unique volatility and price behavior of gold. Get smarter entries and exits with confidence.
🔹 Algorithmic Insights:
Built on advanced price action and custom logic to detect potential reversals, trend strength, and key market zones.
🔹 Simple Yet Powerful:
Clean visuals, minimal noise – just the signals that matter. Designed for both beginner and experienced traders.
🔹 Ideal for Scalping, Intraday & Swing Trading:
Whether you're in and out quickly or holding positions, ZZ Traders ALGO adapts to your style.
📈 Developed by Professional Traders, for Traders – because precision matters.
📩 For inquiries or access, contact me on WhatsApp: +92 300 8339822
MÈGAS ALGO : MÈGAS Signals [INDICATOR]Overview
The MÈGAS Signals is a cutting-edge, multi-functional trading tool designed for advanced traders seeking to identify high-probability trade setups. This script combines price action analysis, machine learning techniques, and real-time signal generation across multiple timeframes to provide actionable insights. The indicator is optimized for both bullish and bearish market conditions and includes features like backtesting metrics, take-profit tools, and customizable alerts.
Key Features
1. Machine Learning and Statistical Clustering
The script implements the K-Means clustering algorithm , a widely used unsupervised machine learning technique, to segment historical price movements into distinct clusters based on magnitude and distribution characteristics. These clusters represent quantized levels of bullish and bearish momentum, enabling the system to adaptively model market behavior across varying volatility regimes.
By applying this statistical clustering approach to real-time price data, the algorithm dynamically identifies meaningful thresholds for key Smart Money Concepts (SMC) such as Break of Structure (BOS) and Change of Character (CHOCH) . This integration enhances classical SMC logic with a data-driven, self-adjusting mechanism that responds to evolving market conditions, effectively bridging traditional price action analysis with modern machine learning methodologies.
2.Multi-Timeframe Table:
A dynamic, real-time multi-timeframe table displayed on the chart that provides at-a-glance insight into:
-Current trend or signal status per timeframe
-Percentage price change relative to the previous bar
-Countdown to the next bar open , updated every second
This table empowers traders with cross-timeframe context , helping them identify confluence, reversals, or divergences across multiple horizons — from scalping (1m) to long-term trends (1D).
3.Dynamic Trailing Stops with Enhanced Visualization
The dynamic trailing stop mechanism adjusts based on volatility clusters, ensuring tighter risk
management during low-volatility periods and wider stops during high-volatility phases.
The feed speed feature enhances visualization by adjusting the transparency of candle
coloring relative to the trailing stop. This makes it easier to interpret trend strength and
momentum, allowing traders to stay ahead of price action.
4.Customizable Alerts for Seamless Execution
Sublimia Signals offers highly customizable alerts that can be tailored to specific timeframes
and trading preferences.
With the intra-bar calculation feature, alerts can be triggered on every tick rather than just
on bar close, empowering traders to act swiftly in fast-moving markets.
Personalized alert messages allow you to create clear and concise notifications for entry and
exit points, streamlining your trading workflow.
5.Comprehensive Backtesting Metrics
The built-in performance metrics table provides detailed backtesting results, including total
trades, win rates, cumulative profit/loss, profit factor, best profit, and worst loss for both
long and short positions.
These metrics enable traders to evaluate the effectiveness of their strategies and optimize
input parameters for better performance.
6.Non-Standard Candle Integration for Smoother Price Action Analysis
The optional Non-Standard Candle toggle allows users to switch between "Traditional", "Heikin-Ashi", "Volume-Weighted" and "Hybrid" candles.
This feature is particularly useful for identifying trends and filtering out market noise, while
backtesting remains based on normal candles to ensure accuracy.
7.Intra-Bar Calculation for Granular Insights
When enabled, the intra-bar calculation feature provides granular insights into price
movements within each bar, offering traders a deeper understanding of market dynamics.
This feature also modifies the algorithm's logic, triggering alerts on every tick rather than just
on bar close, making it ideal for scalpers and day traders who need ultra-responsive tools.
8.Take-Profit/Trailing-Profit Tools: Precision and Flexibility
This feature allows you to set multiple profit levels with customizable percentage
distances, giving you unparalleled control over your trades.
Selectable Type of exit mode : Take-Profit or Trailing-Profit.
Selectable Number of Profit Levels: Define as many profit targets as you need,
ensuring you can capture profits at different stages of price movement.
Percentage-Based Distance: Set each profit level based on a percentage distance from
your entry point. This ensures precise positioning tailored to your risk-reward preferences.
Integrated Alerts: Never miss an opportunity! The tool includes built-in alerts that notify you
when each take-profit level is reached, keeping you informed in real-time.
9.Optimized Visualization
The script ensures optimized visualization of trend strength through smooth transitions in
candle transparency, making it easier to interpret market momentum.
The feed speed parameter calculates how quickly the candle coloring adjusts relative to the
trailing stop, enhancing clarity and decision-making.
How it work
Identify the Primary Trend Using Multi-Timeframe Analysis :
Focus on Higher Timeframes : Start by analyzing the 4h, 8h, or 24h timeframes to determine the primary trend. These higher timeframes provide a clearer picture of long-term momentum.
The built-in table provides real-time updates across all primarly timeframes. Look for confluence—when multiple timeframes align in the same direction.
Confirm Entry Points Using Lower Timeframes :
Fine-Tune Entries with Shorter Timeframes : Once you’ve identified the primary trend, use lower timeframes (e.g., 1m, 5m, or 15m ) to confirm entry points.
Set Take-Profit Levels Based on Percentage Distances :
Customizable Take-Profit Tools : Use the take-profit feature to set multiple levels based on percentage distances from your entry point.
Use Customizable Alerts for Real-Time Updates :
Enable alerts for specific timeframes (e.g., 4h, 8h, 15m) to stay informed about changes in the primary trend or short-term opportunities.
For fast-moving markets, enable the intra-bar calculation feature to receive alerts on every tick, ensuring you don’t miss critical entries or exits.
Backtesting for Strategy Optimization :
Performance Metrics : Use the backtesting metrics table to evaluate how well your trend-following strategy performs over time. Analyze win rates, profit factor, and best/worst trades to refine your approach.
Adjust Inputs : Fine-tune settings like slippage and commission(%) to optimize the indicator for your prefer pair.
Please Note:
This indicator is provided for informational and educational purposes only. It is not financial advice, and it should not be considered a recommendation to buy, sell, or trade any financial instrument. Trading involves significant risks, including the potential loss of your entire investment. Always conduct your own research and consult with a licensed financial advisor before making any trading decisions.
The results and images provided are based on algorithms and historical/paid real-time market data but do not guarantee future results or accuracy. Use this tool at your own risk, and understand that past performance is not indicative of future outcomes.
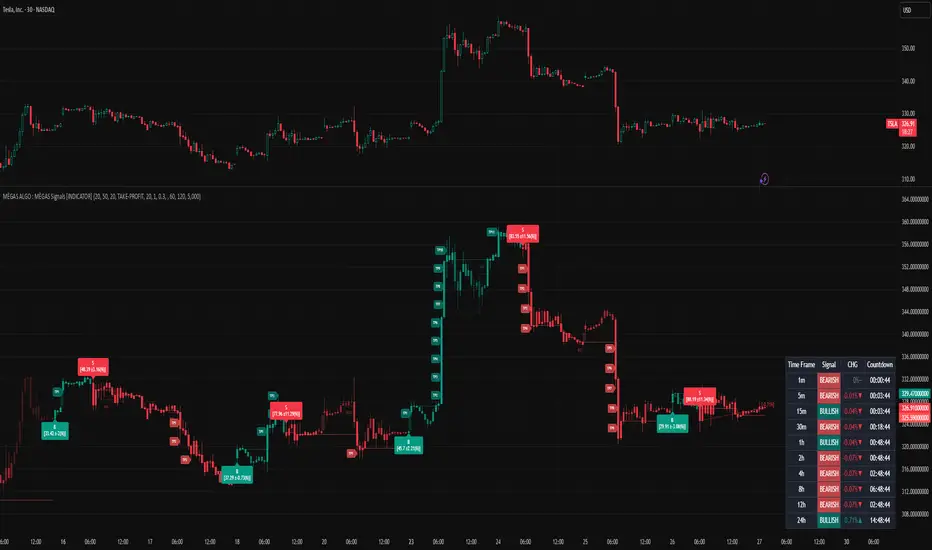
Internal BOS X FVG Algorithms - 1 Visi TraderInternal BOS X FVG Algorithms,
This strategy is based on 2 momentum combinations:
• Internal Break of Structure was formed together with Fair Value Gap (FVG)
Formula of Internal BOS X FVG Algorithms:
1. Break (Internal BOS) X Bullish FVG = Zone for BUY Setup
2. Break (Internal BOS) X Bearish FVG = Zone for SELL Setup
// ----------- Add-ons Setting ----------- //
Setting for Internal BOS X FVG Algorithms:
---------
#1: Internal Break of Structure Settings,
• Internal Swing:
The number of left and right Swing Intervals that are checked when searching for Swing Points. More Values = Less Swing Points plotted to be potential Internal BOS and Less Values = More Swing Points plotted to be potential Internal BOS.
• Internal BOS Color:
You can change the color of dotted line and text for Internal BOS ("Break") according to your favorites layout.
#2: Fair Value Gap Settings,
• FVG Min. Range (In Pips):
Input minimum range of Fair Value Gap in Pips, more value = less zone results.
• FVG Max. Range (In Pips):
Input maximum range of Fair Value Gap in Pips, less value = less zone results.
• Extended Right - FVG:
You can change the value of extended fair value gap zone according to your best preferences.
#3: FVG Color Settings,
• Bullish FVG:
Change color FVG for Bullish Fair Value Gap Zone.
• Bearish FVG:
Change color FVG for Bearish Fair Value Gap Zone.
#4: Mode FVG,
• FVG Variations:
- Global FVG = All Variations of Fair Value Gap Category
- Specific FVG = Variation based on last of 2 FVG's Candles in same color
#5: Trading Session,
• Session Hours:
You can adjust the trading hour according to the best session and volatility of pair assets that you want to trades.
---------
How to Entry (Instructions):
1. Buy Positions = Internal BOS ("Break") form together with Bullish FVG, wait for pullback on FVG Zone and then you can open positions. Set Stop Loss (SL) below FVG Zone and set Take Profit (TP) in minimum 1:2 RR - if price hit 1:1 RR you can set Breakeven for managing the trading risk.
2. Sell Positions = Internal BOS ("Break") form together with Bearish FVG, wait for pullback on FVG Zone and then you can open positions. Set Stop Loss (SL) above FVG Zone and set Take Profit (TP) in minimum 1:2 RR - if price hit 1:1 RR you can set Breakeven for managing the trading risk.
*Notes:
The best pair asset for this strategy is on Gold (XAU/USD) at NY Sessions (19.00 - 22.00 GMT+7) - Timeframe M1 (1 Minute).
--------
Best Regards,
- 1 VISI TRADER
Trading for Prosperity!
--------
DISCLAIMER: No reselling or any other forms of use are authorized for our documents, script / strategy, and the information published with them. This informational planning script / strategy is strictly for individual use and educational purposes only. This is not financial or investment advice. Investments are always made at your own risk and are based on your personal judgement. I am not responsible for any losses you may incur. Please invest wisely.*

[Support and Resistance with Trend Lines] with Backtest (TSO) with Backtest (TSO)
===========================================================================
===========================================================================
This indicator serves as a comprehensive full-cycle trading system, providing alerts at each stage of the trade, from opening to closure. The algorithm uses most recent and historical S&R (Support and Resistance) levels with most recent and historical Trend Lines, generating signals for trades when Breaks/Bounces occur (Trade Open Signal triggers can be configured via very customizable indicator Input "Signal Trigger Matrix" settings). With signal for trade open, TP (Take Profit and SL (Stop Loss) levels are calculated as well and marked on the chart including alerts for each action of the trade. The indicator offers a variety of automated approaches for TP (Take-Profit) and SL (Stop-Loss) settings. These include static current/historical S&R (Support and Resistance) levels or S&R/Trend Lines dynamic breaks for TP (Take-Profit) and various SL (Stop-Loss) approaches, including ATR Trailing SL, opposite S&R (Support and Resistance) levels SL, opposite Trend Lines SL and more. This diverse set of tools ensure flexibility in tailoring TP (Take-Profit) and SL (Stop-Loss) parameters to different market conditions, contributing to a more adaptive and robust trading system. Additionally, a series of signal analysis tools, including market sentiment, candle bar analysis, divergence, and volume, enhance the precision of trading signals.
* Works with popular timeframes: 1M, 3M, 5M, 15M, 30M, 45M, 1H.
* Works well with Futures and Indices, can be used to trade Stocks, Crypto and FOREX.
* Includes LIVE alert/labels Breakouts and Bounces signal trigger feature, which can be used for scalping (NOTE: This approach cannot be backtested).
* Every action of the trade is calculated on a confirmed closed candle bar state (barstate.isconfirmed), so the indicator will never repaint.
==============================================================
Indicator examples:
---------------------------------------------------------------------------
Strategy Config: SRTL_MES_15M3Y_EODoff_ALL
Here is a nice example of MES (Micro E-Mini S&P 500 Index Futures) configuration, which uses S&R (Support and Resistance) breakouts as signal trigger with Elliot Wave confirmation and previous S&R historical levels for TP (Take-Profit).
---------------------------------------------------------------------------
An example of an intraday Tesla trade. Also the green arrows will be displayed IMMEDIATELY when Breakout/Reverse Bounce occurs (same an Alert will be triggered immediately).
===========================================================================
Trading open/close/TP/SL labels, plots and colors explanations:
---------------------------------------------------------------------------
>>> S&R (Support and Resistance) levels/lines: orange - support, blue - resistance (can be hidden).
>>> Trend Lines: yellow - support, green - resistance (can be hidden).
>>> Blue labels show resistance breakouts and bounces, light-blue - bullish, dark-blue - bearish
>>> Yellow labels show resistance breakouts and bounces, light-yellow - bullish, dark-yellow - bearish
>>> Green/Red arrows on top/bottom of candle bar will show LIVE breakouts (if turned on)
>>>>> LONG open: green "house" looking arrow below candle bar.
>>>>> SHORT open: red "house" looking arrow above candle bar.
>>>>> LONG/SHORT take-profit target: green/red circles (multi-profit > TP2/3/4/5 smaller circles).
>>>>> LONG/SHORT stop-loss target: green/red + crosses.
>>>>> LONG/SHORT take-profit hits: green/red diamonds.
>>>>> LONG/SHORT stop-loss hits: green/red X-crosses.
>>>>> LONG/SHORT EOD (End of Day | Intraday style) close (profitable trade): green/red squares.
>>>>> LONG/SHORT EOD (End of Day | Intraday style) close (loss trade): green/red PLUS(+)-crosses.
===========================================================================
STATS TABLE ///////////////////////////////////////////////////////////////
---------------------------------------------------------------------------
>>> Trading STATS table on the chart showing current trade direction, Last TP (Take-Profit) Taken, Current Trade PL (profit/loss in price difference from trade open to the very current state).
---------------------------------------------------------------------------
CUSTOM TRADING DATE RANGE /////////////////////////////////////////////////
---------------------------------------------------------------------------
>>>>> This feature can be used to manually set indicator trading range from and to a specific date and time. NOTE: This is not intended for a very long date range backtesting, utilize TradingView Strategy Tester for that.
* Use TradingView “Strategy Tester” to see Backtesting results
NOTE: If Strategy Tester does not show any results with Date Ranged fully unchecked, there may be an issue where a script opens a trade, but there is not enough TradingView power to set the Take-Profit and Stop-Loss and somehow an open trade gets stuck and never closes, so there are “no trades present”. In such case - manually check “Start”/“End” dates or use “Deep Backtesting” feature!
---------------------------------------------------------------------------
INTRADAY ACTIVE TRADING SESSION CONFIGURATION /////////////////////////////
---------------------------------------------------------------------------
>>> Regional Active Trading Session Hours Schedule: If selected - trades will only open during regional active trading session, if 'OFF', there will be no trading schedule and trades will open 24/7.
>>> EOD(End of Day) Close - On/Off: Close the trade if it's still open at the end of active trading session (on the very last candle bar). NOTE: If no region is selected at 'Regional Active Trading Session Schedule' - there will be no EOD(End of Day) Close and trades will run overnight until either SL(Stop-Loss) or TP(Take-Profit) is hit!
>>>>> EOD(End of Day) Close - 1 candle bar before last: This is specifically for stocks as while usually indices can be closed 15minutes after the market closes, for stocks - the last candle bar closes at the same time with the market active trading session, which if closed - trades can't be closed until next day/session! Enable this setting for the trade to close/alert 1 candle bar before the last one, so there is still time to close the trade at the Broker (NOTE: depending on the timeframe, 1 candle bar can be: 15sec, 30sec, 1min, 3min, 5min, 15min, 30min, 45min, 1h).
---------------------------------------------------------------------------
SIGNAL TRIGGER MATRIX ////////////////////////////////////////////////
---------------------------------------------------------------------------
>>> Trading Engine: This setting turns on TradingView Strategy trading engine for backtesting.
>>> Market Session Only: With this setting turned on, all signal trigger Breaks/Bounces will be hidden during Pre/Post market time.
>>> Plot S&R Levels/Lines: Plot S&R (Support and Resistance) on chart. Note: historical levels/lines will only be plotted if hit (Break/Bounce).
>>> Plot Trend Lines Levels/Lines: Plot Trend Lines levels/lines on chart. Note: historical levels/lines will only be plotted if hit (Break/Bounce).
>>> Use S&R Current Levels | Use S&R Historical Levels | Use Trend Lines Current Levels | Use Trend Lines Historical Levels |: Choose which levels should be used for Breaks/Bounces to be captured on. If all triggers are turned on/checked - whatever happens 1st wins the trigger.
>>> Breaks | Bounces: 'Breaks': Turn on Breaks through levels/lines signal trigger. | 'Bounces': Turn on Bounces off levels/lines signal trigger.
>>> Signal: Regular | Signal: S&R Combo | Signal: TL Combo | Signal: S&R + TL Combo | Signal: Repeat Action |: Trade open signal trigger execution approach MATRIX (If 1 or more turned on at the same time - whatever comes first will be the trade signal trigger). 'Regular': A single Break/Bounce must occur on a closed bar for signal trigger. 'S&R Combo': A combination of 2 Current + Historical S&R (Support and Resistance) Break/Bounce must happen in the same direction on same bar for signal trigger. 'TL Combo': A combination of 2 Current + Historical Trend Lines Break/Bounce must happen in the same direction on same bar for signal trigger. 'S&R + TL Combo': a combination of ANY S&R and Trend Line Break/Bounce must happen in the same direction on same bar for signal trigger. 'Repeat Action': Initial and then confirmation (2nd/3rd/etc. consecutive occurence) Break/Bounce must occur on same level/line for signal trigger.
>>> Historical - Look Back (# of days): How far back (in # of days) will historical S&R/Trend Lines will be used for Trade Open signals/TP/SL/etc.
>>> Historical - Look Back Invalidation (# of days): IF THERE IS TOO MUCH HISTORICAL LEVELS/LINES ON CHART - LOWER THIS SETTING + MAKE SURE IT'S SMALLER THAN 'Historical - Look Back (# of days)'. With big Look back period (5+ days) - it can become very messy with too many historical levels/lines. To clear oldest historical levels/lines - set Look Back Invalidation # of days to less than Historical Look Back # of days. (After X # of Look Back Invalidation days - older levels/lines will become invalidated and no longer used for opening trades/TP (Take-Profit)/SL (Stop-Loss), while newer levels/lines will still be discovered.
>>> S&R/Trend Lines - Support/Resistance combined into 1 entity: Every level or a line becomes simply a level or a line, regardless if it originally was a support or resistance. By default, depending on the level/line originally being support or resistance - the signal direction will be such as: Resistance is broken > LONG / bounced > SHORT; Support is broken > SHORT / bounced > LONG; with this setting on, either level or line can be both broken or bounced off in ANY direction, trade open direction will depend on current market sentiment only.
---------------------------------------------------------------------------
S&R CONFIGURATION ////////////////////////////////////////////////
---------------------------------------------------------------------------
>>> S&R Search - Left Bars (current): This setting is for calculating optimal S&R (Support and Resistance) levels (in combination with below - Right Bars).
>>> S&R Search - Right Bars (current): This setting is for calculating optimal S&R (Support and Resistance) levels (in combination with above - Left Bars).
>>> S&R Search - Custom Resolution (current): This is a custom timeframe setting specifically for S&R Search, it disregards current chart timeframe. This is great to use for scalping, for example: with main chart set to 1min and the custom timeframe set to 3min or 5min - there will be stronger support/resistance levels with more detailed price action.
>>> S&R Search - Left Bars (historical): This setting is for calculating optimal S&R (Support and Resistance) levels (in combination with below - Right Bars).
>>> S&R Search - Right Bars (historical): This setting is for calculating optimal S&R (Support and Resistance) levels (in combination with above - Left Bars).
>>> S&R Search - Custom Resolution (historical): This is a custom timeframe setting specifically for S&R Search, it disregards current chart timeframe. This is great to use for scalping, for example: with main chart set to 1min and the custom timeframe set to 3min or 5min - there will be stronger support/resistance levels with more detailed price action.
>>> S&R - Historical S&R Levels - Extend to the right: Extend all S&R lines to the right.
>>> S&R (Current/Historical) - Live Breakout/Bounce - ALERT/SHOW: NOTE: Alert wlil trigger immediately at price Breaking thru or Bouncing off level/line and an arrow above /below the bar will show the direction of breakout/bounce. If on that same live bar - price comes back causing the Breakout/Bounce become no longer valid - the arrow will disappear as the condition of the Break/Bounce will no longer be valid.
---------------------------------------------------------------------------
TREND LINES CONFIGURATION ////////////////////////////////////////////////
---------------------------------------------------------------------------
>>> Show: Trend Line development (where it 'did not exist' yet): It takes 2 pivots to develop a trend line, pivot is established at least 3 candle bars later from where the pivot is. With this setting turned on - it will plot dashed lines where trend lines originated connecting the 1st and 2nd pivot point up to where the trend line became established (where in reality you would now be able to draw a certain trend line). Established already generated trend line are plotted with a solid line.
>>> Trend Lines - Line Slope Confirmation: LONG breakout will only be shown if trend line is goind downslope \. SHORT breakout will only be shown if trend line is goind upslope /.
>>> Trend Lines - Search - Left Bars (current): This setting is for calculating optimal Trend Lines.
>>> Trend Lines - Search - Right Bars (current): This setting is for calculating optimal Trend Lines.
>>> Trend Lines - Custom Resolution (current): This is a custom timeframe setting specifically for S&R Search, it disregards current chart timeframe. This is great to use for scalping, for example: with main chart set to 1min and the custom timeframe set to 3min or 5min - there will be stronger support/resistance levels with more detailed price action.
>>> Trend Lines - Search - Left Bars (historical): This setting is for calculating optimal Trend Lines.
>>> Trend Lines - Search - Right Bars (historical): This setting is for calculating optimal Trend Lines.
>>> Trend Lines - Custom Resolution (historical): This is a custom timeframe setting specifically for S&R Search, it disregards current chart timeframe. This is great to use for scalping, for example: with main chart set to 1min and the custom timeframe set to 3min or 5min - there will be stronger support/resistance levels with more detailed price action.
>>> Trend Lines - Historical Trend Lines - Extend to the right: Extend all Trend Lines to the right.
>>> Trend Lines (Current/Historical) - Live Breakout/Bounce - ALERT/SHOW: NOTE: Alert will trigger immediately at price Breaking thru or Bouncing off level/line and an arrow above /below the bar will show the direction of breakout/bounce. If on that same live bar - price comes back causing the Breakout/Bounce become no longer valid - the arrow will disappear as the condition of the Break/Bounce will no longer be valid.
---------------------------------------------------------------------------
TAKE-PROFIT/STOP-LOSS CONFIGURATION ///////////////////////////////////////
---------------------------------------------------------------------------
>>> TP (Take-Profit) System: 'S&R Static Current/Historical': TP (Take-Profit) is calculated using current/historical S&R (Support & Resistance) levels at trade open and remains static. 'S&R/Trend Lines Dynamic Breaks': TP (Take-Profit) is fully dynamic and will be trigger at price above trade open price and with Breakout occurence (S&R or Trend Line current/historical breakout).
>>> TP (Take-Profit) # of targets: It is wise to divide the trade into several profit targets. With this setting - up to 5 TP (Take-Profit) targets can be approached. The trade will be equally divided up by the selected # of TP (Take-Profit) targets.
>>> SL (Stop-Loss) System: 'ATR-Trailing-SL': SL (Stop-Loss) is trail-following the ATR (Average True Range) line, NOTE: If at signal trigger, ATR will be against the trade direction - trade open signal will be skipped; 'S&R-Static-SL': SL (Stop-Loss) is set at trade open per optimal most recent S&R level and remains there until trade closes; 'TrendLines-Static-SL': SL (Stop-Loss) is set at trade open per optimal most recent trend line and remains there until trade closes; 'TrendLines-Dynamic-SL': SL (Stop-Loss) will be set per current opposite trend line and follow it until trade is open.; 'Oppos-Sig-Trd-in-Loss': SL (Stop-Loss) will trigger at opposite signal with trade currently at loss.
>>> SL (Stop-Loss) - On/Off: Without SL (Stop-Loss), unless EOD (End of Day) Close is turned on - there will be no SL (Stop-Loss) at all!
---------------------------------------------------------------------------
MARKET SENTIMENT CONFIRMATION ///////////////////////////////////////
---------------------------------------------------------------------------
>>> Market Sentiment: Signal is confirmed per Market Sentiment direction. If Market Sentiment is turned off - whatever signal comes 1st will be the trade open trigger.
---------------------------------------------------------------------------
SIGNAL ANALYSIS AND CLEANUP ///////////////////////////////////////////////
---------------------------------------------------------------------------
>>> Signal Cleanup - Bar Color: Include Bar Color (bullish/bearish) confirmation, LONG signal will only be opened if signal bar is green/bullish, SHORT if red/bearish.
>>> Signal Cleanup - Bar Directional Structure: Skip opposite bar structure types signals (For example: bearish green hammer).
>>> Signal Cleanup - Bar Doji Skip: Skip doji (indecisive) candles signals.
>>> Signal Cleanup - EWO (Elliott Wave Oscillator): Include EWO (Elliott Wave Oscillator), LONG will only be opened if EWO is bullish / SHORT if EWO is bearish.
>>> Signal Cleanup - VWAP (Volume-Weighted Average Price): Include VWAP (Volume-Weighted Average Price), LONG will only be opened if price is above VWAP / SHORT if price is below VWAP.
>>> Signal Cleanup - MA (Moving Average) Confirmation: Include MA (Moving Average), LONG will only be opened if MA is bullish / SHORT if MA is bearish.
>>> Signal Cleanup - ATR (Average True Range): Include ATR (Average True Range) confirmation, LONG will only be opened if ATR is bullish / SHORT if ATR is bearish.
>>> Signal Cleanup - Divergence(RSI + MACD): Include Divergence (RSI + MACD ) confirmation, LONG will only be opened if Divergence is bullish / SHORT if Divergence is bearish.
>>> Signal Cleanup - Volume % Strength: Include Volume strength/percentage confirmation, LONG/SHORT will only be opened with strong Volume matching the signal direction | By default, strong Volume percentage is set to 150% and weak to 50%.
>>> Signal Cleanup - Volume Above Average: Include Volume Above Moving Average (Volume closing bar closes above volume moving average) confirmation, LONG/SHORT will only be opened with Volume above average - Volume closed bar color must match the closed price color (bullish/bearish direction) + Volume bar must be closed above volume MA line).
---------------------------------------------------------------------------
===========================================================================
||||||||||||||||||||||||||||||||||| *** ||||||||||||||||||||||||||||||||||| *** |||||||||||||||||||||||||||||||||||
||||||||||||||||||||||||||||||||||| *** ||||||||||||||||||||||||||||||||||| *** |||||||||||||||||||||||||||||||||||
TP System - VERY IMPORTANT INFO!
-------------------------------------------------------------------------------------------------------------------
"TP PERCENTAGE" - amount by which current trade/position needs to be reduced/partially closed/sold.
-------------------------------------------------------------------------------------------------------------------
TP System: Dynamic
"TP PERCENTAGE" - will always be the same amount (trade/position size divided by the # of take-profit(TP) targets) and percentage to be closed will always be of the ORIGINAL trade/position.
-------------------------------------------------------------------------------------------------------------------
TP System: Static
"TP PERCENTAGE" - will always be the same amount IF take-profit(TP) targets are hit 1-by-1 (TP1 > TP2 > TP3 > TP4 > TP5), otherwise it will vary and unless it is a 1st take-profit(TP1), the REMAINING trade/position size will always be smaller than original and therefore the percentage to be closed will always be of the REMAINING trade/position and NOT the original one!
-------------------------------------------------------------------------------------------------------------------
"TP PERCENTAGE" CheatSheet (these are the only percentages you may see)
-----------------------------------------------------------------------
TP PERCENTAGE---Close/Sell Amount-------------Example (trade size: 50 stocks)
20%-------------trade size * 0.2--------------50 * 0.2 = 10 stocks
25%-------------trade size * 0.25-------------50 * 0.25 = 12.5(~13) stocks
34%-------------trade size * 0.34-------------50 * 0.34 = 17 stocks
40%-------------trade size * 0.4--------------50 * 0.4 = 20 stocks
50%-------------trade size * 0.5--------------50 * 0.5 = 25 stocks
60%-------------trade size * 0.6--------------50 * 0.6 = 30 stocks
66%-------------trade size * 0.66-------------50 * 0.66 = 33 stocks
75%-------------trade size * 0.75-------------50 * 0.75 = 37.5(~38) stocks
80%-------------trade size * 0.8--------------50 * 0.8 = 40 stocks
100%------------trade size--------------------50 = 50 stocks
-----------------------------------------------------------------------
If for any reason a portion of the current/remaining trade closed at such occurrence was slightly wrong, it is not an issue. Such occurrences are rare and with slight difference in partial TP closed is not significant to overall performance of our algorithms.
||||||||||||||||||||||||||||||||||| *** ||||||||||||||||||||||||||||||||||| *** |||||||||||||||||||||||||||||||||||
||||||||||||||||||||||||||||||||||| *** ||||||||||||||||||||||||||||||||||| *** |||||||||||||||||||||||||||||||||||
===========================================================================
Alert Settings (you don’t have to touch this section unless you will be using TradingView alerts through a Webhook to use with trading bot)
---------------------------------------------------------------------------
Here is how a LONG OPEN alert looks like.
NOTE: Each label , , etc. is customizable, you can change the text of it within indicator Input settings.
ALERT >>>>>>>>>>>>>>>>>>>>>>>>>>>>>>>>>>>>>>>>>>>>>>>
COIN: BTCUSD
TIMEFRAME: 15M
LONG: OPEN
ENTRY: 20000
TP1: 20500
TP2: 21000
TP3: 21500
TP4: 22500
TP5: 23500
SL: 19000
Leverage: 0
---------------------------------------------------------------------------
Here is how a TP1 alert will look with 5 TPs breakdown of the trade.
NOTE1: Next to TP1 taken it will show at which price it was triggered.
NOTE2: Next to "TP Percentage" it shows how much of the CURRENT/ACTIVE/REMAINING trade needs to be closed.
NOTE2: If TP2/3/4/5 comes before TP1 - the alert will tell you exactly how many percent of the trade needs to be closed!
ALERT >>>>>>>>>>>>>>>>>>>>>>>>>>>>>>>>>>>>>>>>>>>>>>>
COIN: BTCUSD
TIMEFRAME: 15M
LONG: TP1
TP1: 20500
TP Percentage: 20%
---------------------------------------------------------------------------
Here is how an alert will look for LONG - STOP-LOSS.
ALERT >>>>>>>>>>>>>>>>>>>>>>>>>>>>>>>>>>>>>>>>>>>>>>>
COIN: BTCUSD
TIMEFRAME: 15M
ENTRY: 20000
LONG: SL
SL: 19000
---------------------------------------------------------------------------
Here is how an alert will look for LONG - EOD (End of Day) In Profit close.
ALERT >>>>>>>>>>>>>>>>>>>>>>>>>>>>>>>>>>>>>>>>>>>>>>>
COIN: BTCUSD
TIMEFRAME: 15M
LONG: EOD-Close (profit)
ENTRY: 20000
EOD-Close: 21900
===========================================================================
Adding Alerts in TradngView
---------------------------------------------------------------------------
-Add indicator to chart and make sure the correct strategy is configured (check Backtesting results)
-Right-click anywhere on the TradingView chart
-Click on Add alert
-Condition: Select this indicator by it’s name
-Immediately below, change it to "alert() function calls only", as other wise there will be 2 alerts for every alert!
-Expiration: Open-ended (that may require higher tier TradingView account, otherwise the alert will need to be occasionally re-triggered)
-Alert name: Whatever you desire
-Hit “Create”
-Note: If you change ANY Settings within the indicator – you must DELETE the current alert and create a new one per steps above, otherwise it will continue triggering alerts per old Settings!
===========================================================================
Good Luck! (NOTE: Trading is very risky, past performance is not necessarily indicative of future results, so please trade responsibly!)
---------------------------------------------------------------------------
NOTE: There seems to be a strange glitch when strategy is running live, it will show "double-take" take-profits labels on the chart. This is not affecting the script logic and backtesting results, if you simply change the timeframe real quick to something else then back - it will no longer show the duplicate orders... this must be some sort of a glitch as every alert was thoroughly tested to make sure everything is working!

SFX Signals & Overlays [YinYangAlgorithms]SFX Signals & Overlays aims to help traders Identify Buy & Sell locations, Reversals, Volatility Zones, Support & Resistance and Overbought & Oversold Zones. All of these may work in harmony with each other by helping to identify when to enter and exit a trade; as well as helping to determine the risk / reward the trade may ensue.
SFX Signals & Overlays’s Buy & Sell signals are momentum based, meaning the Initial ‘Buy’ & ‘Sell’ signal may not be exactly where you want to get in/out. What may occur is the initial signal appears, a few more continuation signals appear afterwards (always in a chain); and once the momentum has ended a ‘Reversal’ signal appears. The reversal is there to help signify that the ‘opportune’ time to buy/sell may have passed and the price may now correct in the opposite direction. This Indicator aims to Buy Low and Sell High; and therefore the Buy signal momentum may occur as the price is either about to fall, currently falling or has started to consolidate. When the Buy signal momentum has ended, this means the momentum is at an impasse, but is favoring Buy momentum and a reversal (correction) may occur.
Buying & Selling at reversal signals may be profitable, however it may be less risky to DCA into your long / short positions during the Buy/Sell momentum signals instead. Let's get into the Tutorial so you can better understand how our SFX Signals & Overlays indicator works.
Tutorial:
Our example above showcases how our SFX Signals & Overlays Indicator looks on the default settings ‘Medium’ for each of our Algorithm Settings:
Trend Sensitivity
Signal Sensitivity
Zone Sensitivity
All of our Algorithm Settings feature 3 different speeds:
Fast
Medium
Slow
These speeds may be applied to each Algorithm Setting individually and affect how quickly they adapt to the current market's momentum. This allows you to tailor this Indicator to fit your trading style by adjusting it to meet your needs accordingly. If you are someone who likes to swing trade on the 1-5 minute timeframe, you may find better confluence with all settings on ‘Fast’. Medium term holders and traders may find better results with all settings on ‘Medium’. Likewise, long term investors may find best results with all settings on ‘Slow’. However, this shouldn’t stop you from finding your own best result by adjusting them individually to meet your own unique trading style.
SFX Signals & Overlays helps you identify shifts in momentum by displaying Momentum Signals. Momentum Signals are shown by either a Green or Red Triangle. Momentum Signals can continue for quite some time until the momentum has ended. We rank the first Momentum Signal from 1/5 to 5/5 for their strength and may help determine the chances of the momentum shift occurring. Once the Momentum Signals have ended we display a Reversal Signal. This Reversal Signal helps signify that the Momentum has ended. When the Momentum ends it means that a reversal may have started. This reversal may mean the price will continue in the direction the signal mentioned; or it may mean the price will consolidate. If the price consolidates then the signal is void as when the consolidation ends the price could go in either direction. If you notice consolidation occurring after a Reversal Signal; wait for more confirmations as it is now too risky.
Our Indicator displays different evaluations for each INITIAL Buy and Sell signal. These evaluations rank the current start of the signal from 1-5; 1 being the lowest and least reliable, 5 being the highest and most reliable. These rankings aren’t indefinite and are simply an evaluation at the time of the initial signal. We may potentially provide evaluations at the reversal later on if requested enough. When a Buy or Sell signal occurs this defines where momentum is occurring in this direction. This momentum is indicated by momentum signals shown through red / green triangles. These triangles indicate that this momentum is present. When these momentum signals end is when the Reversal Signal appears indicating that since this momentum has ended, there may be a decent chance of a reversal occurring. There also adherently may be the potential of consolidation occurring; but generally it means there is either a reversal, or consolidation + then a reversal or a continuation; however it may be apparent that the momentum has ended.
ES:
NQ:
BTC:
If you refer to the 3 examples above, we show how the ES, NQ and BTC look within a 5 minute scalping example. Essentially you’d make your decision on the Buy / Sell signal, the momentum signals, the Reversal Signals, the Trend Colors as well as other oscillators and Due Diligence.
Remember, there’s no such thing as a perfect entry / exit, the more you understand about trading and do your own Due Diligence the better. These Buy and Sell as well as Reversal signals attempt to locate and rank momentum shifts to help you identify where the momentum may be ending and reversing in the opposite direction.
Our zones defined by the Outer (red) and Inner (green) are representations of not only Support and Resistance locations, but likewise Overbought and Oversold locations. These zones help in multiple ways. The hard lines that define each zone's start / end are very useful locations of support / resistance which may indicate where the price will bounce off of. Likewise, when the price is within these zones it represents the price being Overbought or Oversold. Then the price is for instance within the Red Resistance Zone, what generally may happen is the price will correct quickly to get back to the ‘Black Empty Zone’ between the Red and Green zones; OR it may consolidate sideways until it has entered the ‘Black Empty Zone’. This is how the price may redeem itself back to being valued correctly. These zones help you identify and understand, in concatenation with our signals when and how much the price may move.
Our Settings are minimalistic so you don’t need to worry and get overwhelmed about changing values and trying to fiddle to find which values works the best for what. Our Algorithms will take care of all of that for you. Simply select the speeds for your Trend, Signals and Zones and you’re good to start trading! You can likewise customize what information is visible to you and the colors to better customize your experience.
Fast:
Medium:
Slow:
The 3 examples above display what the same portion of the chart looks like when Trend, Signal and Zone Sensitivity is changed from Fast, Medium and Slow.
As you can see, they all look quite different in the results they produce. By default all settings are set to Medium, however they can all be individually changed to suit your trading style and needs.
Our Indicator offers many different alert options which may help you stay informed with how the market is moving and any momentum changes that may occur.
Settings:
1. Algorithm Settings
Trend Sensitivity (Fast, Medium, Slow): Trend Sensitivity refers to how quickly the Trend Bar Colors change. Fast: will change colors very quickly if it senses momentum is changing. Medium: will change almost as quickly as Fast, however, rather than swapping from Bullish to Bearish momentum right away it has an intermediate 'Neutral - Slightly Bullish (Yellow)' and 'Neutral - Slightly Bearish (Orange)'. This way you can better visualize when the momentum is dying in the trend and starting back up by having these trend 'Neutral/Consolidation' areas. Slow: will attempt to only change Trend Bar Colors when the momentum has surely shifted. This may result in a bit of lagging behind.
Signal Sensitivity (Fast, Medium, Slow): Signal Sensitivity refers to how quickly the Buy & Sell Momentum Signals & Reversal Signals appear. These signals are meant to appear when it thinks the price may reverse, but the speeds refer to how much of a reversal they think may happen. Fast: will attempt to locate any and all momentum swings. Medium: will attempt to only locate momentum swings which may drive the price up considerably. Slow: will attempt to locate only the most extreme momentum swings. This may result in some potentially good ones missed however; but the ones it finds may have a higher probability of occuring.
Zone Sensitivity (Fast, Medium, Slow): Zone Sensitivity refers to how quickly the Zones expand based on price movement. These zones may be useful for not only seeing Support & Resistance; but also identifying when it is Overbought & Oversold; as well as visualizing volatility between the Black (Empty area) and the zones. The lines that separate each zone are the Support and Resistance locations; the area within the zones are simply the spacing between these Support and Resistance locations. However, the further the price is to the outer zones does represent Overbought and Oversold. Fast: will expand very quickly. This causes the price to be within the Black (Empty area) more often. This may be useful for finding extremities in price movement which may have a better chance of correcting. Medium: moves fast but not anywhere close to as fast as 'Fast'. Medium will hold its values in an attempt to be as accurate as possible for identifying Support and Resistance locations. Slow: will expand very slowly. This may be useful for identifying Support & Resistance as well as Volatility targets on higher time frames since these zones move much slower.
2. Display Settings:
Show Trend Bar Colors: Trend Bar Color are a way of seeing how the Trend is holding up on a bar by bar basis. This may be useful for seeing momentum starting, ending or simply dying down before any signals actually appear.
Signal Text Display (Both, Buy & Sell, Reversals, None: Signals are a way of seeing potential changes in momentum and when they have actually occurred. Our signals also rank from 1/5 to 5/5 how strong of a chance this momentum change may occur (only at the time of the signal, not at the time of the reversal). These may be useful as potential Entry and Exit locations; as well as when you see the reversal, you know that this momentum change has either begun or a consolidation may be occurring. If a consolidation occurs, the signal is no longer valid as the price can now go either way and it is best to wait for more signals or other technical analysis to determine momentum and movement.
Zone Display (All, Outer + Middle, Inner + Middle, Outer, Middle, Inner, None): Zones are composed of 3 areas above and below. These areas attempt to project Support & Resistance locations as well as display when the Price is Overbought and Oversold. You can specify which zones you wish to view, however all are important.
3. Color Settings:
Buy Color: This is the color of all Buy Signals and Zones.
Sell Color: This is the color of all Sell Signals and Zones.
Buy Reversal Color: This is the color of all Buy Signal Reversals.
Sell Reversal Color: This is the color of all Sell Signal Reversals.
If you have any questions, comments, ideas or concerns please don't hesitate to contact us.
HAPPY TRADING!

[Opening Range Breakout] S&R Strategy with Backtest (TSO) S&R Strategy with Backtest (TSO)
===========================================================================
===========================================================================
This indicator serves as a comprehensive full-cycle trading system, providing alerts at each stage of the trade, from opening to closure. The algorithm initiates by calculating the Opening/Pre-Market Price Range, waiting for a breakout to generate signals, and establishing TP (Take Profit and SL (Stop Loss) levels. The Opening/Pre-Market range, known for its robust support and resistance levels, is a key element. To filter out false breakouts and capture valid ones, the indicator incorporates a Smart Breakout feature, requiring confirmation through an initial breakout, a confirmation bounce, and a subsequent confirmation breakout. The indicator offers a variety of automated approaches for TP (Take-Profit) and SL (Stop-Loss) settings. These include leveraging opening range levels, both the most recent and historical S&R (Support and Resistance) levels, and an ATR (Average True Range) trailing stop-loss. This diverse set of tools ensure flexibility in tailoring TP (Take-Profit) and SL (Stop-Loss) parameters to different market conditions, contributing to a more adaptive and robust trading system. Additionally, a series of signal analysis tools, including candle bar analysis, divergence, and volume, enhance the precision of trading signals.
* Works with popular timeframes: 1M, 3M, 5M, 15M, 30M, 45M, 1H.
* Works best with Indices, Stocks, and Commodities, since there is pre-market price movement, which is used to obtain support and resistance price range.
* Every action of the trade is calculated on a confirmed closed candle bar state (barstate.isconfirmed), so the indicator will never repaint.
==============================================================
Indicator visual examples with various instruments:
---------------------------------------------------------------------------
Strategy Config: ORB_AAPL(NASDAQ)_15M
Example of Signal Cleanup confirmations via SMA and ATR. Take-Profit is calculated per optimal S&R (resistance) most recent levels.
---------------------------------------------------------------------------
Strategy Config: ORB_AMD(NASDAQ)_5M
Example of optimal S&R (resistance) level from previous day for Take-Profit 1 target, which gets hit.
---------------------------------------------------------------------------
Strategy Config: ORB_META(NASDAQ)_5M
Example of dynamic SL (Stop-Loss), which reduces the risk by moving to the new support level, which is at the same time is below the current price. Also Signal Cleanup confirmations via SMA, ATR and VWAP
---------------------------------------------------------------------------
Strategy Config: ORB_MSFT(NASDAQ)_15M
Example of automated ATR Trail Stop-Loss activation at no optimal S&R (support) feature.
---------------------------------------------------------------------------
Strategy Config: ORB_NFLX(NASDAQ)_3M
Example of a skipped LONG trade due to no optimal S&R (support) for Stop-Loss (can be seen per chart that it would be a loss trade). On another side, a SHORT SMA Confirmed trade hits all 3 profit targets.
---------------------------------------------------------------------------
Strategy Config: ORB_NVDA(NASDAQ)_15M
Example of no optimal support for SHORT Take-Profit targets, with ATR Trail Stop-Loss.
---------------------------------------------------------------------------
Strategy Config: ORB_SPY(AMEX)_15M
Example of several signal confirmations at the same time (SMA, VWAP, EWO) and S&R-TP-Entry-SL SL (Stop-Loss) system, which at trade open sets SL (Stop-Loss) per optimal S&R (since this is a LONG trade - support) and then moves to Entry at first take-profit.
===========================================================================
Trading open/close/TP/SL labels, plots and colors explanations:
---------------------------------------------------------------------------
>>> Opening/Pre-Market range: White dashed lines show opening range/pre-market levels with dotted white line extend along the Trading Schedule (if Trading Schedule is turned off - it will extend until next day).
>>> Smart Breakout: 1) Initial Breakout: "init_Brekout" | 2) Confirmation Bounce: "conf_Bounce" | 3) Confirmation Breakout: "conf_Breakout" (additional lables on chart can be hidden with only Confirmation Breakout shown).
>>> Additional S&R (Support and Resistance) lines: yellow - support, blue - resistance (can be hidden).
>>>>> LONG open: green "house" looking arrow below candle bar.
>>>>> SHORT open: red "house" looking arrow above candle bar.
>>>>> LONG/SHORT take-profit target: green/red circles (multi-profit > TP2/3/4/5 smaller circles).
>>>>> LONG/SHORT stop-loss target: green/red + crosses.
>>>>> LONG/SHORT take-profit hits: green/red diamonds.
>>>>> LONG/SHORT stop-loss hits: green/red X-crosses.
>>>>> LONG/SHORT EOD (End of Day | Intraday style) close (profitable trade): green/red squares.
>>>>> LONG/SHORT EOD (End of Day | Intraday style) close (loss trade): green/red PLUS(+)-crosses.
===========================================================================
STATS TABLE ///////////////////////////////////////////////////////////////
---------------------------------------------------------------------------
>>> Trading STATS table on the chart showing current trade direction, Last TP (Take-Profit) Taken, Current Trade PL (profit/loss in price difference from trade open to the very current state).
---------------------------------------------------------------------------
CUSTOM TRADING DATE RANGE /////////////////////////////////////////////////
---------------------------------------------------------------------------
>>>>> This feature can be used to manually set indicator trading range from and to a specific date and time. NOTE: This is not intended for a very long date range backtesting, utilize TradingView Strategy Tester for that.
* Use TradingView “Strategy Tester” to see Backtesting results
NOTE: If Strategy Tester does not show any results with Date Ranged fully unchecked, there may be an issue where a script opens a trade, but there is not enough TradingView power to set the Take-Profit and Stop-Loss and somehow an open trade gets stuck and never closes, so there are “no trades present”. In such case - manually check “Start”/“End” dates or use “Deep Backtesting” feature!
---------------------------------------------------------------------------
INTRADAY/TRADING SCHEDULE | ET (EASTERN TIMEZONE) ////////////////////////
---------------------------------------------------------------------------
>>> Trading Schedule - On/Off: This is where an Intraday Session or any custom session can be turned on and then scheduled.
>>>>> Trading Schedule - Time: Trade open Signals/Alerts time zone Hours. | NOTE: US Market Active Hours: 09:30 - 16:00 ET / Power Hour: 15:00 - 16:00 ET)
>>> Trading Schedule - EOD(End of Day) Close - On/Off: Close trade if still open by certain hour (set below).
>>>>> Trading Schedule - EOD(End of Day) Close - Hour (ET): US trading session closes at 4PM ET > 16:00.
Here is when the trade will close with EOD(End of Day) Close/Trading Cut Off Hour set to 16, which is end of US trading session:
1/3/5min > will close at 15:55pm ET
15min > will close at 15:45pm ET
30min > will close at 15:30pm ET
45min > will close at 15:45pm ET
60min > will close at 16:00pm ET
Here is when the trade will close with EOD(End of Day) Close/Trading Cut Off Hour set to 15, which is 1 hour before the end of US trading session (right before power hour starts):
1/3/5min > will close at 14:55pm ET
15min > will close at 14:45pm ET
30min > will close at 14:30pm ET
45min > will close at 14:45pm ET
60min > will close at 15:00pm ET
---------------------------------------------------------------------------
TRADE SIGNAL CONFIGURATION ////////////////////////////////////////////////
---------------------------------------------------------------------------
>>> Opening Range - Time Period (ET): Opening/Pre-Market Range time, which by default is set to US Session Pre-Market Range, can be customized to any time range as there are different market hours around the world and this setting can be customized to any time. Pre-Market Time/Price Range Hours(ET) | Pre-Market EU/Asia Hours: 4:00-9:30 ET | Pre-Market US (NY) Hours: 7:00-9:30 ET | Post-Market US Hours: 16:00-19:00 ET | First US Market Hour: 9:30-10:30 ET | Power Hour: 15:00-16:00)
>>> Opening Range - Levels Structure: determines how the price range is calculated, based on the highest/lowest price zones or based on the candle body bar.
>>> Opening Range - Breakout System: "Simple": bar close price has to simply break the opening range level | "Smart": After initial breakout (which is basically 'Simple' Breakout), a price come back is expected to the opening range level, a bounce, then a confirmation breakout with price closing ahead of the initial breakout.
>>>>> Opening Range - Smart Breakout: # of bars until Initial Breakout becomes invalid
>>>>> Opening Range - Smart Breakout: Bounce Settings, "Cross-Return" - LONG: Price has to cross down the initial breakout S&R, but never close below it; SHORT: Price has to cross up the initial breakout S&R, but then close above it; ||| "Cross-Close-Return" - LONG: At least 1 candle has to close below initial breakout S&R; SHORT: At least 1 candle has to close above initial breakout S&R.
>>>>> Alerts - Opening Range - Smart Breakout: Confirmation Bounce Alert. Trigger an alert at confirmation bounce. This is for live trading (especially scalping) Smart Breakout approach - to get ready to open the trade in the correct direction.
---------------------------------------------------------------------------
TAKE-PROFIT/STOP-LOSS CONFIGURATION ///////////////////////////////////////
---------------------------------------------------------------------------
>>> TP (Take-Profit) and SL (Stop-Loss): S&R Search - Left Bars: This setting is for calculating optimal S&R (Support and Resistance) levels (in combination with below - Right Bars) for S&R (Support and Resistance) TP (Take-Profit) levels calculations. NOTE: if at any point - there will be no available S&R (Support & Resistance) found for SL (Stop-Loss, 'S&R-Dynamic-SL' or 'S&R-Static-SL' setting, since both settings search for optimal SL (Stop-Loss) at trade open) or TP (Take-Profit, at any setting, since at trade open, an optimal TP (Take-Profit) level is searched) > SL (Stop-Loss) will automatically switch to trailing ATR-Trailing-SL and the trade will continue to run until it either hits ATR-Trailing-SL (Stop-Loss) or closes at EOD (End of Day).
>>> TP (Take-Profit) and SL (Stop-Loss): S&R Search - Right Bars: This setting is for calculating optimal S&R (Support and Resistance) levels (in combination with above - Left Bars) for S&R (Support and Resistance) TP (Take-Profit) levels calculations. NOTE: if at any point - there will be no available S&R (Support & Resistance) found for SL (Stop-Loss, 'S&R-Dynamic-SL' or 'S&R-Static-SL' setting, since both settings search for optimal SL (Stop-Loss) at trade open) or TP (Take-Profit, at any setting, since at trade open, an optimal TP (Take-Profit) level is searched) > SL (Stop-Loss) will automatically switch to trailing ATR-Trailing-SL and the trade will continue to run until it either hits ATR-Trailing-SL (Stop-Loss) or closes at EOD (End of Day).
>>> TP (Take-Profit) and SL (Stop-Loss): S&R Search - Custom Resolution: This is a custom timeframe setting specifically for S&R Search, it disregards current chart timeframe. This is great to use for scalping, for example: with main chart set to 1min and the custom timeframe set to 3min or 5min - there will be stronger support/resistance levels with more detailed price action.
>>> TP (Take-Profit) and SL (Stop-Loss): # of Bars (5000 max) to search back for optimal Support and Resistance levels: This is how many candles will be searched backwards for previous S&Rs (Support and Resistance) to find the optimal levels for TP (Take-Profit) and SL (Stop-Loss). NOTE: If SL (Stop-Loss) System is set to 'ATR-Trailing-SL' - this setting is only relevant for searching TP (Take-Profit) levels.
>>> TP (Take-Profit) and SL (Stop-Loss): At Trade Open - No S&R (Support and Resistance) found behavior: 'Skip Trade': If at trade open there are no S&R (Support and Resistance) levels for TP1 (Take-Profit 1) or SL (Stop-Loss) - trade is skipped. 'Open/ATR-Trailing-SL': If at trade open there are no S&R (Support and Resistance) levels for TP1 (Take-Profit 1) or SL (Stop-Loss), the trade will still be open with SL (Stop-Loss) set to 'ATR-Trailing-SL'.
>>> TP (Take-Profit) System: Pre-Market-Range-TP: All TP (Take-Profit) targets are calculated at trade open using the distance between Support and Resistance per Opening Pre-market Range and then divided by TP (Take-Profit) Divider, which can be set below; S&R-Current-Optimal-TP1: TP1 (Take-Profit) level is set per currently available S&R (Support & Resistance), if none available - historical S&R (Support & Resistance) levels will be searched, remaining TP (Take-Profit) targets (if selected, up to 5 # of TPs) are searched through most recent closest historical S&R (Support & Resistance) levels; S&R-Historic-Optimal-TP1: TP1 (Take-Profit) level is set per historically most recent closest available S&R (Support & Resistance) to the Entry price, remaining TP (Take-Profit) targets (if selected, up to 5 # of TPs) are searched through historical S&R (Support & Resistance) levels as well.
>>> TP (Take-Profit, Pre-Market-Range-TP) Divider #: This is for 'Pre-Market-Range-TP' setting only, where TP (Take-Profit) level is the distance between top/bottom levels of the opening range. It can be reduced by the divider #. (1 - full distance; 2 - 1/2 distance; 3 - 1/3 distance; etc.
>>> TP (Take-Profit) # of targets: It is wise to divide the trade into several profit targets. With this setting - up to 5 TP (Take-Profit) targets can be approached. The trade will be equally divided up by the selected # of TP (Take-Profit) targets.
>>> TP (Take-Profit) target(s) Consumed: Signal Bar consuming Take-Profits - trade signal bar is big enough to 'consume'/close ahead of the first TP setting > the signal can either be skipped, or all Take-Profit targets pushed ahead by average bar size).
>>> TP (Take-Profit) Offset - On/Off: This is a feature where TP (Take-Profit) target will be considered taken even if the price never crosses the target(s), but comes close enough (based on the offset amount). Set the offset amount below.
>>>>> TP (Take-Profit) Offset - Amount: Some Examples: (for SPY 0.1 would be $0.10 offset - if TP1 is $400 and price hits $399.90 > TP1 considered taken/signal shown/alert) | NOTE: For EURUSD, it is very different and if wrong will show TP1 immediately at trade open, typical good offset for EURUSD is: 0.0005 | Similar for BTCUSD, for example: 10 - $10 offset, if TP is $15,000 > $14,990.
>>> SL (Stop-Loss) System: 'Pre-Market-Range-SL': SL (Stop-Loss) is set to the opposite market range level from trade direction; 'S&R-Static-SL': SL (Stop-Loss) is set at trade open per optimal most recent S&R level and remains there until trade closes; 'S&R-Dynamic-SL': SL (Stop-Loss) is set at a trade open per optimal S&R (Support and Resistance) level from the most recent AND historical S&Rs (Support and Resistance), with every bar closed it will check if there are new S&Rs (Support and Resistance) levels, if these levels appear closer to the current price then current level - it will move SL (Stop-Loss) to that level, therefore reducing the risk; 'ATR-Trailing-SL': SL (Stop-Loss) is trail-following the ATR (Average True Range) line, NOTE: If at signal trigger, ATR will be against the trade direction - trade open signal will be skipped; 'S&R-TP-Entry-SL': SL (Stop-Loss) initially is set per S&R, then moves to Entry price at the very first TP (Take-Profit) hit and remains there until trade closes; 'S&R-TP-Trail-SL': SL (Stop-Loss) initially is set per S&R, then moves to Entry at TP1 (Take-Profit 1) hit, then keeps trailing per previously taken profit targets (TP2 taken, SL moves to TP1 | TP3 taken, SL moves to TP2 | TP4 taken, SL moves to TP3). NOTE: 'ATR-Trailing-SL' will not switch automatically if 'S&R-Dynamic-SL', S&R-TP-Entry-SL', 'S&R-TP-Trail-SL' system is selected, as already the most optimal SL (Stop-Loss) level is calculated - it will switch automatically only with 'S&R-Static-SL' system.
>>> SL (Stop-Loss) - On/Off: Without SL (Stop-Loss), unless EOD (End of Day) Close is turned on - there will be no SL (Stop-Loss) at all!
---------------------------------------------------------------------------
SIGNAL ANALYSIS AND CLEANUP ///////////////////////////////////////////////
---------------------------------------------------------------------------
>>> Signal Cleanup - Bar Color: Include Bar Color (bullish/bearish) confirmation, LONG signal will only be opened if signal bar is green/bullish, SHORT if red/bearish.
>>> Signal Cleanup - Bar Directional Structure: Skip opposite bar structure types signals (For example: bearish green hammer).
>>> Signal Cleanup - Bar Doji Skip: Skip doji (indecisive) candles signals.
>>> Signal Cleanup - EWO (Elliott Wave Oscillator): Include EWO (Elliott Wave Oscillator), LONG will only be opened if EWO is bullish / SHORT if EWO is bearish.
>>> Signal Cleanup - VWAP (Volume-Weighted Average Price): Include VWAP (Volume-Weighted Average Price), LONG will only be opened if price is above VWAP / SHORT if price is below VWAP.
>>> Signal Cleanup - MA (Moving Average) Confirmation: Include MA (Moving Average), LONG will only be opened if MA is bullish / SHORT if MA is bearish.
>>> Signal Cleanup - ATR (Average True Range): Include ATR (Average True Range) confirmation, LONG will only be opened if ATR is bullish / SHORT if ATR is bearish.
>>> Signal Cleanup - Divergence(RSI + MACD): Include Divergence (RSI + MACD ) confirmation, LONG will only be opened if Divergence is bullish / SHORT if Divergence is bearish.
>>> Signal Cleanup - Volume % Strength: Include Volume strength/percentage confirmation, LONG/SHORT will only be opened with strong Volume matching the signal direction | By default, strong Volume percentage is set to 150% and weak to 50%.
>>> Signal Cleanup - Volume Above Average: Include Volume Above Moving Average (Volume closing bar closes above volume moving average) confirmation, LONG/SHORT will only be opened with Volume above average - Volume closed bar color must match the closed price color (bullish/bearish direction) + Volume bar must be closed above volume MA line).
---------------------------------------------------------------------------
===========================================================================
||||||||||||||||||||||||||||||||||| *** ||||||||||||||||||||||||||||||||||| *** |||||||||||||||||||||||||||||||||||
||||||||||||||||||||||||||||||||||| *** ||||||||||||||||||||||||||||||||||| *** |||||||||||||||||||||||||||||||||||
TP System - VERY IMPORTANT INFO!
-------------------------------------------------------------------------------------------------------------------
"TP PERCENTAGE" - amount by which current trade/position needs to be reduced/partially closed/sold.
-------------------------------------------------------------------------------------------------------------------
TP System: Dynamic
"TP PERCENTAGE" - will always be the same amount (trade/position size divided by the # of take-profit(TP) targets) and percentage to be closed will always be of the ORIGINAL trade/position.
-------------------------------------------------------------------------------------------------------------------
TP System: Static
"TP PERCENTAGE" - will always be the same amount IF take-profit(TP) targets are hit 1-by-1 (TP1 > TP2 > TP3 > TP4 > TP5), otherwise it will vary and unless it is a 1st take-profit(TP1), the REMAINING trade/position size will always be smaller than original and therefore the percentage to be closed will always be of the REMAINING trade/position and NOT the original one!
-------------------------------------------------------------------------------------------------------------------
"TP PERCENTAGE" CheatSheet (these are the only percentages you may see)
-----------------------------------------------------------------------
TP PERCENTAGE---Close/Sell Amount-------------Example (trade size: 50 stocks)
20%-------------trade size * 0.2--------------50 * 0.2 = 10 stocks
25%-------------trade size * 0.25-------------50 * 0.25 = 12.5(~13) stocks
34%-------------trade size * 0.34-------------50 * 0.34 = 17 stocks
40%-------------trade size * 0.4--------------50 * 0.4 = 20 stocks
50%-------------trade size * 0.5--------------50 * 0.5 = 25 stocks
60%-------------trade size * 0.6--------------50 * 0.6 = 30 stocks
66%-------------trade size * 0.66-------------50 * 0.66 = 33 stocks
75%-------------trade size * 0.75-------------50 * 0.75 = 37.5(~38) stocks
80%-------------trade size * 0.8--------------50 * 0.8 = 40 stocks
100%------------trade size--------------------50 = 50 stocks
-----------------------------------------------------------------------
If for any reason a portion of the current/remaining trade closed at such occurrence was slightly wrong, it is not an issue. Such occurrences are rare and with slight difference in partial TP closed is not significant to overall performance of our algorithms.
||||||||||||||||||||||||||||||||||| *** ||||||||||||||||||||||||||||||||||| *** |||||||||||||||||||||||||||||||||||
||||||||||||||||||||||||||||||||||| *** ||||||||||||||||||||||||||||||||||| *** |||||||||||||||||||||||||||||||||||
===========================================================================
Alert Settings (you don’t have to touch this section unless you will be using TradingView alerts through a Webhook to use with trading bot)
---------------------------------------------------------------------------
Here is how a LONG OPEN alert looks like.
NOTE: Each label , , etc. is customizable, you can change the text of it within indicator Input settings.
ALERT >>>>>>>>>>>>>>>>>>>>>>>>>>>>>>>>>>>>>>>>>>>>>>>
COIN: BTCUSD
TIMEFRAME: 15M
LONG: OPEN
ENTRY: 20000
TP1: 20500
TP2: 21000
TP3: 21500
TP4: 22500
TP5: 23500
SL: 19000
Leverage: 0
---------------------------------------------------------------------------
Here is how a TP1 alert will look with 5 TPs breakdown of the trade.
NOTE1: Next to TP1 taken it will show at which price it was triggered.
NOTE2: Next to "TP Percentage" it shows how much of the CURRENT/ACTIVE/REMAINING trade needs to be closed.
NOTE2: If TP2/3/4/5 comes before TP1 - the alert will tell you exactly how many percent of the trade needs to be closed!
ALERT >>>>>>>>>>>>>>>>>>>>>>>>>>>>>>>>>>>>>>>>>>>>>>>
COIN: BTCUSD
TIMEFRAME: 15M
LONG: TP1
TP1: 20500
TP Percentage: 20%
---------------------------------------------------------------------------
Here is how an alert will look for LONG - STOP-LOSS.
ALERT >>>>>>>>>>>>>>>>>>>>>>>>>>>>>>>>>>>>>>>>>>>>>>>
COIN: BTCUSD
TIMEFRAME: 15M
ENTRY: 20000
LONG: SL
SL: 19000
---------------------------------------------------------------------------
Here is how an alert will look for LONG - EOD (End of Day) In Profit close.
ALERT >>>>>>>>>>>>>>>>>>>>>>>>>>>>>>>>>>>>>>>>>>>>>>>
COIN: BTCUSD
TIMEFRAME: 15M
LONG: EOD-Close (profit)
ENTRY: 20000
EOD-Close: 21900
===========================================================================
Adding Alerts in TradngView
---------------------------------------------------------------------------
-Add indicator to chart and make sure the correct strategy is configured (check Backtesting results)
-Right-click anywhere on the TradingView chart
-Click on Add alert
-Condition: Select this indicator by it’s name
-Immediately below, change it to "alert() function calls only", as other wise there will be 2 alerts for every alert!
-Expiration: Open-ended (that may require higher tier TradingView account, otherwise the alert will need to be occasionally re-triggered)
-Alert name: Whatever you desire
-Hit “Create”
-Note: If you change ANY Settings within the indicator – you must DELETE the current alert and create a new one per steps above, otherwise it will continue triggering alerts per old Settings!
===========================================================================
If you have any questions or issues with the indicator, please message me directly via TradingView.
---------------------------------------------------------------------------
Good Luck! (NOTE: Trading is very risky, past performance is not necessarily indicative of future results, so please trade responsibly!)
---------------------------------------------------------------------------
NOTE: There seems to be a strange glitch when strategy is running live, it will show "double-take" take-profits labels on the chart. This is not affecting the script logic and backtesting results, if you simply change the timeframe real quick to something else then back - it will no longer show the duplicate orders... this must be some sort of a glitch as every alert was thoroughly tested to make sure everything is working!
