FUNCTION: Goertzel algorithm -- DFT of a specific frequency binThis function implements the Goertzel algorithm (for integer N).
The Goertzel algorithm is a technique in digital signal processing (DSP) for efficient evaluation of the individual terms of the discrete Fourier transform (DFT).
In short, it measure the power of a specific frequency like one bin of a DFT, over a rolling window (N) of samples.
Here you see an input signal that changes frequency and amplitude (from 7 bars to 17). I am running the indicator 3 times to show it measuring both frequencies and one in between (13). You can see it very accurately measures the signals present and their power, but is noisy in the transition. Changing the block len will cause it to be more responsive but noisier.
Here is a picture of the same signal, but with white noise added.
If you have a cycle you think is present you could use this to test it, but the function is designed for integration in to more complicated scripts. I think power is best interrupted on a log scale.
Given a period (in bars or samples) and a block_len (N in Goertzel terminology) the function returns the Real (InPhase) and Quadrature (Imaginary) components of your signal as well as calculating the power and the instantaneous angle (in radians).
I hope this proves useful to the DSP folks here.
Cari dalam skrip untuk "algo"

Fianchetto v1Hello, I created this script last year I decided I would release it to the public. This script uses Moving Averages to attack or defend price action given the current conditions of the market. This strategy is ONLY for currencies I would NOT recommend using on any other markets. This strategy is wrong about 55% of the time so use at your own risk. This strategy has 2 main focuses, 1. Catching trends and riding trends 2. Defending Profits from a Trend, as a trend starts to form you want to make sure you can get the most juice out of the trend while also ensuring profit taking throughout the trend. This algorithm uses moving averages in a more creative way than just trading crossover's, we use a small MA to use it's direction of travel as a traffic light while using a bigger MA as a filter for our trade bias (bear or bull). Our Traffic light or small MA is what ensures we are defending profits as when the traffic light switches colors we close our trade even if our filter is still the same bias. This however does not mean we are done trading the current trend wave, We wait for our traffic light to switch back to the same bias as our filter to re-enter the trade. I will be updating this system as time goes on, if you have any questions or problems please pm me, QuantsGambit

Patient Trendfollower (7)(alpha) Backtesting AlgorithmThis is an alpha version of backtesting algorithm for my Patient Trendfollower (7) strategy. It can help you adapt the indicator to other charts than EURUSD. Please bear in mind that price action, volume profiles and supzistences are a catalyst for successful trading, not an indicator. You can get significantly better results if you use these things in your trading and use Trendfollower only as a secondary tool.
Patient Trendfollower Indicator
Thanks belongs to @everget and Satik FX, their contributions are highlighted on an indicator page.

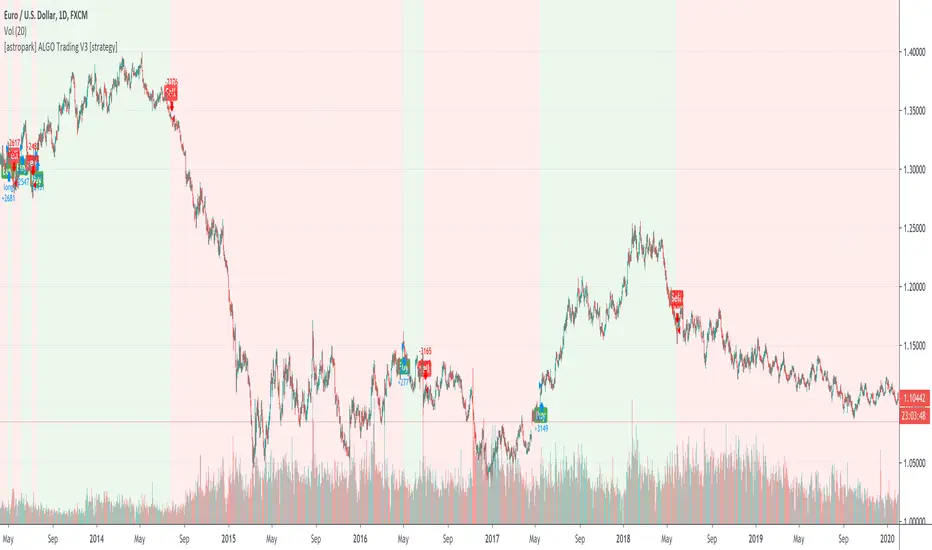
[astropark] ALGO Trading V3 [strategy]Dear Followers,
today another awesome Swing and Scalping Trading Strategy indicator, runnable on a bot , which works great on many timeframes (from 1h and above is suggested), just write me in order to help you find correct settings).
It must be said that this strategy works even better on 1m Renko chart!
If you are a scalper or you are a swing trader, you will love suggested entries for fast and long-lasting profit.
Keep in mind that a proper trailing stop strategy and risk management and money management strategies are very important (DM me if you need any clarification on these points).
This is not an evolution of "ALGO Trading V1" or "ALGO Trading V2" , but a twin sister of them.
For your reference, here it is the "ALGO Trading V1" indicator
and here the "ALGO Trading V2"
This strategy has the following options:
enable/disable signals on chart
enable/disable bars and background coloring based on trend
enable/disable a "filter noise" option , which try to reduce overtrading (you can easily check it on backtesting)
enable/disable a Take Profit / Stop Loss option (you can easily check it on backtesting too)
enable/disable a secret SmartOption which may improve profit on your chart (again, check it on you chart if it helps or not)
This strategy only trigger 1 buy or 1 sell. If you enable Take Profit / Stop Loss option, consider that many TP can be triggered before trend reversal, so take partial profit on every TP an eventually buy/sell back lower/higher to maximize your profit.
In order to get notified when a signal is triggered, you need to use the "alarms" version of this indicator (just search for astropark's "ALGO Trading V3" indicator and choose the one with "alarms" suffix).
Strategy results are calculated on the time window from 1995 to now, so on more than 15 years, using 1000$ as initial capital and working at 1x leverage (so no leverage at all! If you like to use leverage, be sure to use a safe option, like 3x or 5x at most in order to have liquidation price very far).
This is not the "Holy Grail", so use a proper risk management strategy.
This script will let you backtest how the indicator will perform on any chart and timeframe you may like to test and/or trade. Of course results will be very different depending on the chart and timeframe you will open. I tested a lot of charts and always you can find a combination that keep this strategy in profit on swing trading style (and this means that if you can have a daily look at the chart you can always manage to maximize your profit on each trade!)
This is a premium indicator , so send me a private message in order to get access to this script.
[astropark] ALGO Trading V2 [alarms]Dear Followers,
today another awesome Swing and Scalping Trading Strategy indicator, runnable on a bot , which works great on many timeframes (ones between 1h and 1D are suggested, but just write me in order to help you find correct settings).
It must be said that this strategy works even better on 1m Renko chart!
If you are a scalper or you are a swing trader, you will love suggested entries for fast and long-lasting profit.
Keep in mind that a proper trailing stop strategy and risk management and money management strategies are very important (DM me if you need any clarification on these points).
This is not an evolution of "ALGO Trading V1" or "ALGO Trading V3" , but a twin sister of them. Search them on TradingView to know them better.
Here you can find ALGO Trading V1
This strategy has the following options:
enable/disable signals on chart
enable/disable bars and background coloring based on trend
enable/disable a "filter noise" option , which try to reduce overtrading (you can easily check it on backtesting)
enable/disable a Take Profit / Stop Loss option (you can easily check it on backtesting too)
enable/disable a secret SmartOption which may improve profit on your chart (again, check it on you chart if it helps or not)
This strategy only trigger 1 buy or 1 sell. If you enable Take Profit / Stop Loss option, consider that many TP can be triggered before trend reversal, so take partial profit on every TP an eventually buy/sell back lower/higher to maximize your profit.
This script will let you set all notifications you may need in order to be alerted on each triggered signals.
The one for backtesting purpose can be found by searching for the astropark's "ALGO Trading V2" and then choosing the indicator with "strategy" suffix in the name, or you can find here below
Strategy results are calculated on the time window from January 2018 to now, so on more than 2 years, using 1000$ as initial capital and working at 1x leverage (so no leverage at all! If you like to use leverage, be sure to use a safe option, like 3x or 5x at most in order to have liquidation price very far).
This is not the "Holy Grail", so use a proper risk management strategy.
This is a premium indicator , so send me a private message in order to get access to this script.

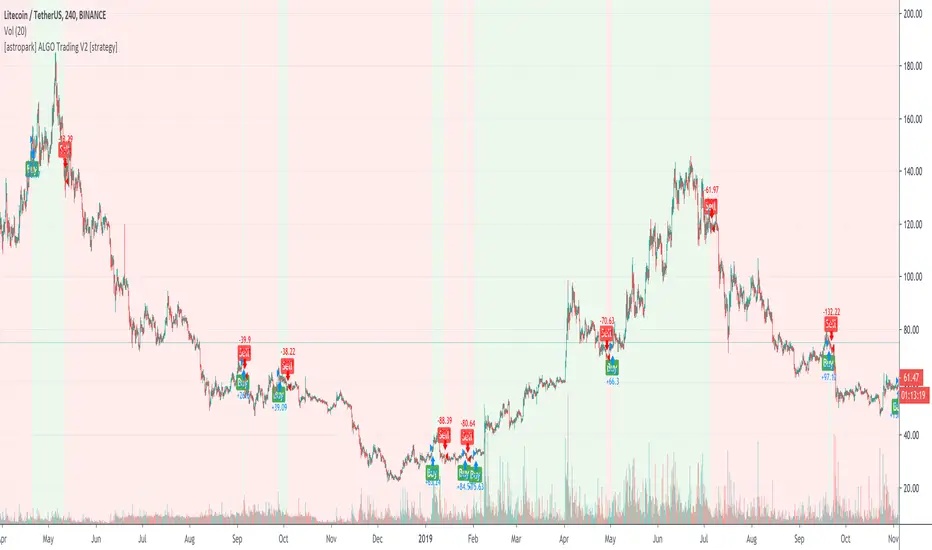
[astropark] ALGO Trading V2 [strategy]Dear Followers,
today another awesome Swing and Scalping Trading Strategy indicator, runnable on a bot , which works great on many timeframes (ones between 1h and 1D are suggested, but just write me in order to help you find correct settings).
It must be said that this strategy works even better on 1m Renko chart!
If you are a scalper or you are a swing trader, you will love suggested entries for fast and long-lasting profit.
Keep in mind that a proper trailing stop strategy and risk management and money management strategies are very important (DM me if you need any clarification on these points).
This is not an evolution of "ALGO Trading V1" or "ALGO Trading V3" , but a twin sister of them. Search them on TradingView to know them better.
Here you can find ALGO Trading V1
This strategy has the following options:
enable/disable signals on chart
enable/disable bars and background coloring based on trend
enable/disable a "filter noise" option , which try to reduce overtrading (you can easily check it on backtesting)
enable/disable a Take Profit / Stop Loss option (you can easily check it on backtesting too)
enable/disable a secret SmartOption which may improve profit on your chart (again, check it on you chart if it helps or not)
This strategy only trigger 1 buy or 1 sell. If you enable Take Profit / Stop Loss option, consider that many TP can be triggered before trend reversal, so take partial profit on every TP an eventually buy/sell back lower/higher to maximize your profit.
In order to get notified when a signal is triggered, you need to use the "alarms" version of this indicator (just search for astropark's "ALGO Trading V2" indicator and choose the one with "alarms" suffix).
Strategy results are calculated on the time window from January 2019 to now, so on more than 1 year, using 1000$ as initial capital and working at 1x leverage (so no leverage at all! If you like to use leverage, be sure to use a safe option, like 3x or 5x at most in order to have liquidation price very far).
This is not the "Holy Grail", so use a proper risk management strategy.
This script will let you backtest how the indicator will perform on any chart and timeframe you may like to test and/or trade. Of course results will be very different depending on the chart and timeframe you will open. I tested a lot of charts and always you can find a combination that keep this strategy in profit on swing trading style (and this means that if you can have a daily look at the chart you can always manage to maximize your profit on each trade!)
This is a premium indicator , so send me a private message in order to get access to this script.
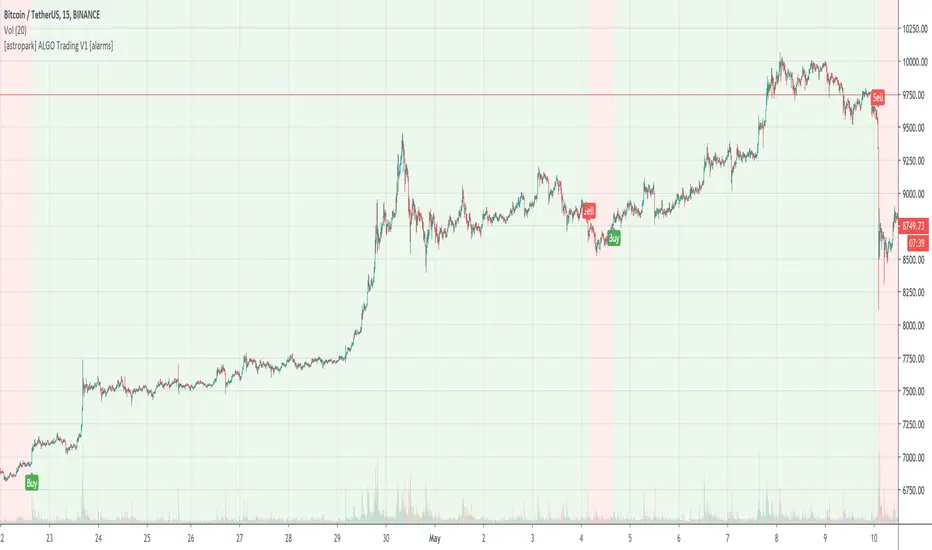
[astropark] ALGO Trading V1 [alarms]Dear Followers,
today another awesome Swing and Scalping Trading Strategy indicator, runnable on a bot , which works great on Low Timeframes (1h is suggested) but also on even lower ones (till 15m) and on higher ones (no further than 1D), just write me in order to help you find correct settings).
It must be said that this strategy works even better on 1m Renko chart!
If you are a scalper or you are a swing trader, you will love suggested entries for fast and long-lasting profit.
Keep in mind that a proper trailing stop strategy and risk management and money management strategies are very important (DM me if you need any clarification on these points).
This is not an evolution of "ALGO Trading V2" or "ALGO Trading V3" , but a twin sister of them. Search them on TradingView to know them better.
This strategy has the following options:
enable/disable signals on chart
enable/disable bars and background coloring based on trend
enable/disable a "filter noise" option , which try to reduce overtrading (you can easily check it on backtesting)
enable/disable a Take Profit / Stop Loss option (you can easily check it on backtesting too)
enable/disable a secret SmartOption which may improve profit on your chart (again, check it on you chart if it helps or not)
This strategy only trigger 1 buy or 1 sell. If you enable Take Profit / Stop Loss option, consider that many TP can be triggered before trend reversal, so take partial profit on every TP an eventually buy/sell back lower/higher to maximize your profit.
This script will let you set all notifications you may need in order to be alerted on each triggered signals.
The one for backtesting purpose can be found by searching for the astropark's "ALGO Trading V1" and then choosing the indicator with "strategy" suffix in the name, or you can find here below
Strategy results are calculated on the time window from January 2019 to now, so on more than 1 year, using 1000$ as initial capital and working at 1x leverage (so no leverage at all! If you like to use leverage, be sure to use a safe option, like 3x or 5x at most in order to have liquidation price very far).
This is not the "Holy Grail", so use a proper risk management strategy.
This is a premium indicator , so send me a private message in order to get access to this script.
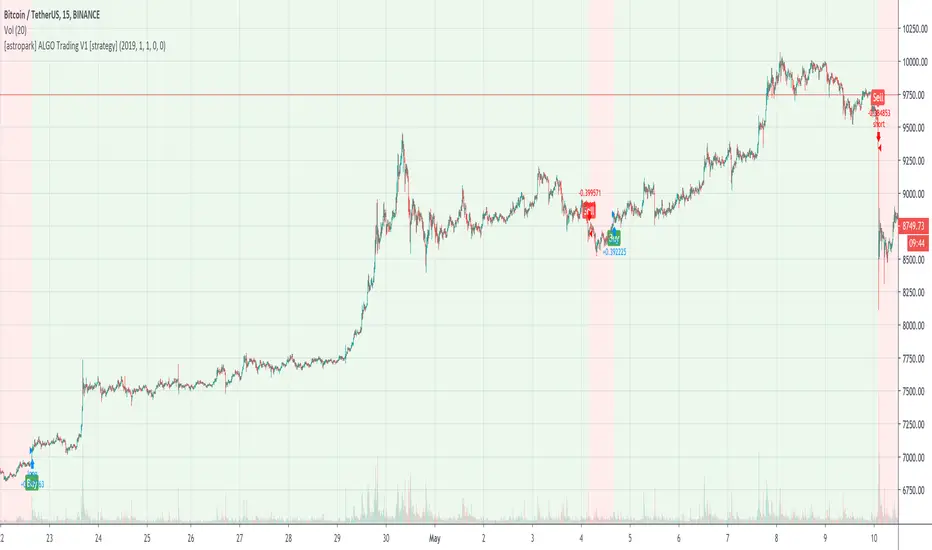
[astropark] ALGO Trading V1 [strategy]Dear Followers,
today another awesome Swing and Scalping Trading Strategy indicator, runnable on a bot , which works great on Low Timeframes (1h is suggested) but also on even lower ones (till 15m) and on higher ones (no further than 1D), just write me in order to help you find correct settings).
It must be said that this strategy works even better on 1m Renko chart!
If you are a scalper or you are a swing trader, you will love suggested entries for fast and long-lasting profit.
Keep in mind that a proper trailing stop strategy and risk management and money management strategies are very important (DM me if you need any clarification on these points).
This is not an evolution of "ALGO Trading V2" or "ALGO Trading V3" , but a twin sister of them. Search them on TradingView to know them better.
This strategy has the following options:
enable/disable signals on chart
enable/disable bars and background coloring based on trend
enable/disable a "filter noise" option, which try to reduce overtrading (you can easily check it on backtesting)
enable/disable a Take Profit / Stop Loss option (you can easily check it on backtesting too)
enable/disable a secret SmartOption which may improve profit on your chart (again, check it on you chart if it helps or not)
This strategy only trigger 1 buy or 1 sell. If you enable Take Profit / Stop Loss option, consider that many TP can be triggered before trend reversal, so take partial profit on every TP an eventually buy/sell back lower/higher to maximize your profit.
In order to get notified when a signal is triggered, you need to use the "alarms" version of this indicator (just search for astropark's "ALGO Trading V1" indicator and choose the one with "alarms" suffix).
Strategy results are calculated on the time window from January 2019 to now, so on more than 1 year, using 1000$ as initial capital and working at 1x leverage (so no leverage at all! If you like to use leverage, be sure to use a safe option, like 3x or 5x at most in order to have liquidation price very far).
This is not the "Holy Grail", so use a proper risk management strategy.
This script will let you backtest how the indicator will perform on any chart and timeframe you may like to test and/or trade. Of course results will be very different depending on the chart and timeframe you will open. I tested a lot of charts and always you can find a combination that keep this strategy in profit on swing trading style (and this means that if you can have a daily look at the chart you can always manage to maximize your profit on each trade!)
This is a premium indicator , so send me a private message in order to get access to this script.
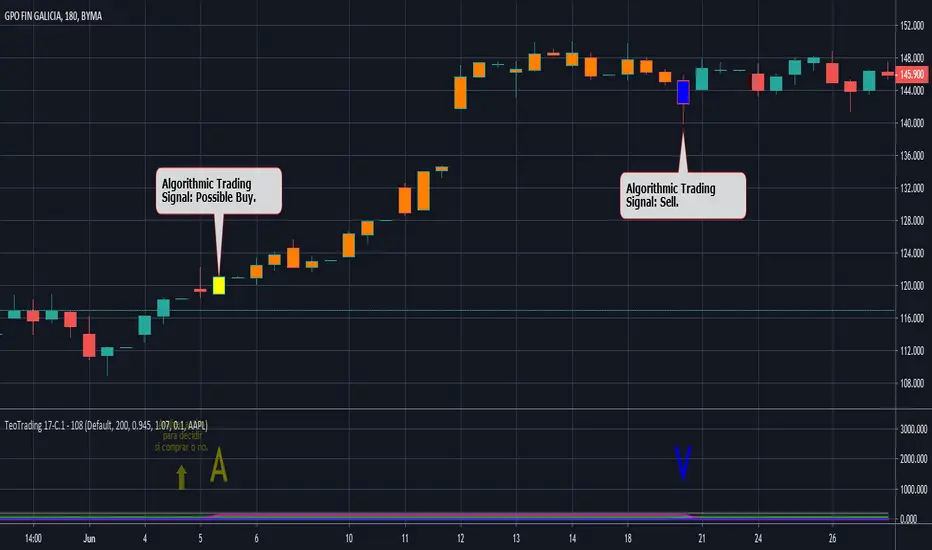
TeoTrading 17-C.1 - 108. Algorithmic Trading Long Signals.This indicator mark patterns that were successful in the past, based on Algorithmic Trading and backtesting.
This Script is for Private Use.
It was designed for Long Signals.
Was developed and tested with Argentinians and Nasdaq stocks.
Includes Real Time Stastistics.
No purchase recommendations are given. The user must do their own analysis to decide whether to buy.
"A" signal is to make the Analysis. Here the user will see a Yellow Candle.
"V" signal is to Sell. Here the user will see:
- A Green Candle: Sell with Gain using a fixed Stop Gain.
- A Blue Candle: Sell with Gain using a dynamic (variable) Stop Gain.
- A Fuchsia Candle: Sell with lost.
The Orange Candle indicates that a trade is open.
The user can filter by differents types of moving averages using input parameters.
Includes Alerts.
TeoTrading 17 - 106. Long Signals based on Algorithmic TradingThis indicator mark patterns that were successful in the past, based on Algorithmic Trading and backtesting.
This Script is for Private Use.
It was designed for Long Signals. Was developed and tested with o group of stocks:
- Argentine Stocks of different sectors: Bank, Energy and Industry.
- Nasdaq technology stocks.
- Petroleum.
Includes Real Time Stastistics.
No purchase recommendations are given. The user must do their own analysis to decide whether to buy.
"A" signal is to make the Analysis. Here the user will see a Yellow Candle.
"V" signal is to Sell. Here the user will see:
- A Green Candle: Sell with Gain using a fixed Stop Gain.
- A Blue Candle: Sell with Gain using a dynamic (variable) Stop Gain.
- A Fuchsia Candle: Sell with lost.
The Orange Candle indicates that a trade is open.
Includes Alerts.
Enabled users will obtain a complete manual.

Alerts on OnePunch Algo StudyIn this study you will be able to get alerts based on the OnePunch Algo Strategy Version 1 and 2.
How To Use:
Open Alerts and Pick Alerts on OnePunch Algo Study option.
For buy alerts, pick Buy Signal option
For sell alerts, pick Sell Signal option
Simple as that. This script will provide buying and selling alerts to your email and mobile app notifications.

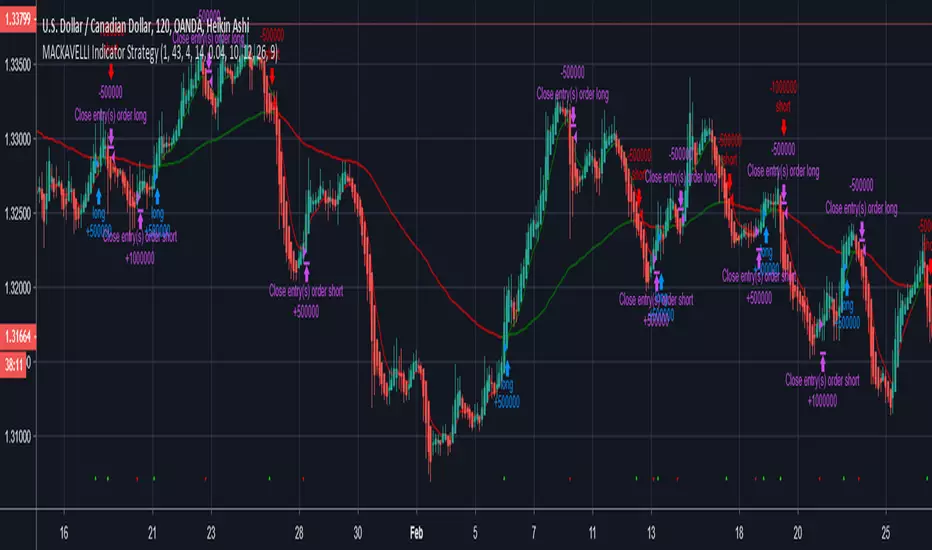
MACKAVELLI Algorithmic StrategyI had a hard time finding a strategy that would work in different time-frames and multiple different currency pairs. This is what I ended up with after countless hours of research and testing. I designed this strategy for auto-algorithmic trading and it uses three different indicators for Long/Short positions and a 4th indicator for exiting positions.
1) A green-light indicator that tells you whether or not you can go long/short.
2) A confirmation indicator that executes the long/short positions.
3) A chop indicator that measures the distance between the two MA's. When they're too close a trade will not be executed, as this usually indicates a chop zone.
4) A third MA is used as an exit indicator.
5) Finally, a loop function is designed to prevent repeat signals. Once a signal is produced on bar close it cannot happen again until that trade is closed or a new position is opened.
Be advised, you need to adjust the settings for each currency pair and time-frame. Once you do that, back-test it and count the last 100 trades to determine accurately your wins/losses. Long entries are the top of the previous bar, shorts are the bottom of the previous bar. This is a more accurate way of counting wins/losses. Tradingview back-test's are not accurate because of where they estimate your long/short entries are, it's very misleading.
Right now I have it setup for 2hr USDCAD with a back-test of 58% win rate on the last 100 trades.
The chop indicator is set to 0.04, I suggest starting there. 0.03 is the lowest I would go. You can go all the way up to 0.1 and higher if needed. You'll start missing big trades though.
The EMA for green-light signal is set to 10, a lower number will give you more entries but less accurate results, bigger number will give less entries with more accuracy but with missed opportunities. 10 is a good starting point.
This strategy is also designed so you can use tight stop losses to prevent large losses. This is because the strategy typically catches trends on the way up/down, minimizing risk for reversal.
I use Heikin Ashi candles for a smoother chart to work with. I have not tested this strategy with normal candles.
DEMO this strategy before using it live and make sure you back-test and tune it before you start. This is written in PINE V3 SO IT WILL NOT REPAINT.
Vix spread Betting/CFD strategy. Highest profit factor ever?Recently I have noticed that many CFD and spread betting providers (I wont mention which ones but they are easy to find with a quick google search) are letting users "trade" the CBOE Volatility Index ( VIX ). I thought this was unusual as the VIX is not a purchasable asset; it is a measure of implied volatility (both long and short) on the S&P500 calculated through a formula using the price of S&P options. As far as I know the VIX has never been directly tradeable until now, VIX related products like ETFs which attempt to follow the VIX has been available for nearly two decades however they suffer greatly from slippage which makes them difficult to trade.
I am astonished that we are now, for the first time, able to bet on the result of a formula. I think that CFD and spread betting providers have made a mistake, they were probably just looking to add more tradable products and didn't think through fully that the VIX is not like any of their other products, and is much easier to profit from when using a quantitative strategy.
This strategy works live on 4H and daily charts and achieves absolutely ridiculous results. I set it to start with $100 initial capital, and over the course of 465 trades it made $73154339495899.86 profit due to compounding profits. This is a profit factor of 695603.753. I don't expect to earn this much profit myself as I am sure that CFD and spread betting providers will eventually realize that it was a mistake to let traders have positions betting on the outcome of a formula, and eventually stop allowing VIX trades to be placed. I am currently trading using this algorithm, and will maybe let others use this script eventually after I've had my fun. So follow me :)

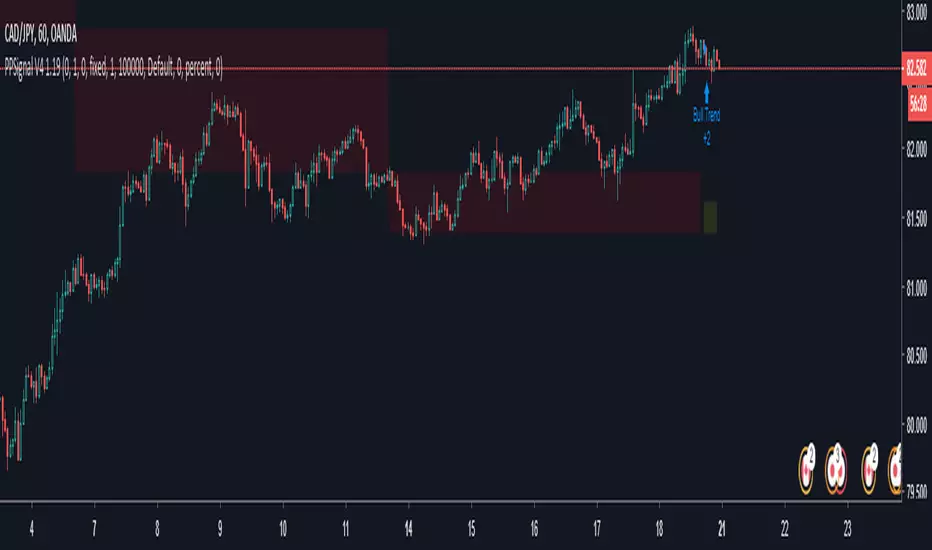
PPSignal System Algorithm Introduction
System Algorithm based on historical price probabilities and volumes. We recommend use financial stock, bond, crypts, indices, futures and Forex market (GBPUSD, EURUSD, USDJPY, USDCAD, AUDUSD, USOIL, XAUUSD, SOYUSD, DXY, SPY, SP1!, bitcoin) with defined trends above 50 or 100 and 200 simple moving averages idem if you want trade downtrend financial assets.
Use projections and retracements Fibonacci, MACD and RSI or Stoch oscillator and figures charters Head and shoulder, triangles and double bottom, double top, etc.
This system will notify you of the probability of success. The profit will be defined for yourself and according to your investor profile.
There are stocks and other assets with high returns but the system does not know exactly. Check in the Strategy tester section and then net profit.
We have other tools that support to PPsignal system, we will publish them shortly.
Define system parameters
As it is a system that is based on past data we recommend using the most historical data weekly (W) but you an use day historical data or 3 o 2 hs.
Candle color: you can choose if you want a trend color for candles or not, in the chart propieties menu detach the border option.
PPsignal it's a very simple system with which you will have a great support when it is a good time for enter in the marker and out.
we await your comments.
Eng. Oscar Alejandro Peruchena
Quants Mathematical and Market Analyst
Automatic Monthly Pivots with built-in Fibonacci LevelsClassic Floor Trader Pivots (algorithm decision points) with color segmented Fibonacci levels plotted in real-time Enjoy! Multi-variable Time Frame Pivots with Custom fib levels is in works.

FTA 2Hello there,
What you see here is V2 of FTA .
First of all some keypoints to it:
-It uses Gunbot
-Many Microtrades on a bullish market
-Even make Profit on Sideway & wavy downtrends
-Double up to infinity
-Controlled downtrend averaging
-Visualizer available allowing visible emulation of the Script & Gunbot trading together.
-More Features & Optimization still to come!
It has the same core as V1 but a few big changes/additions.
As I don't want to force these changes on to everyone I made an additional version.
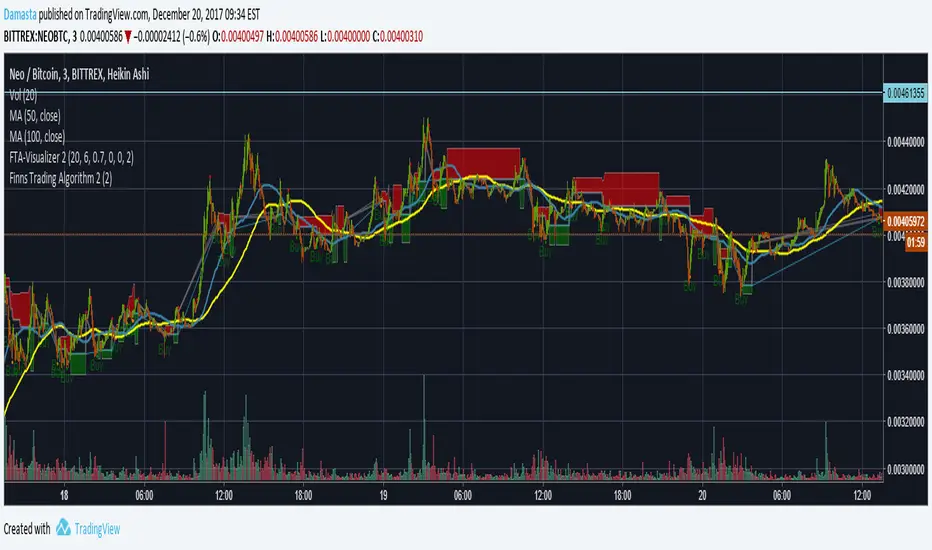
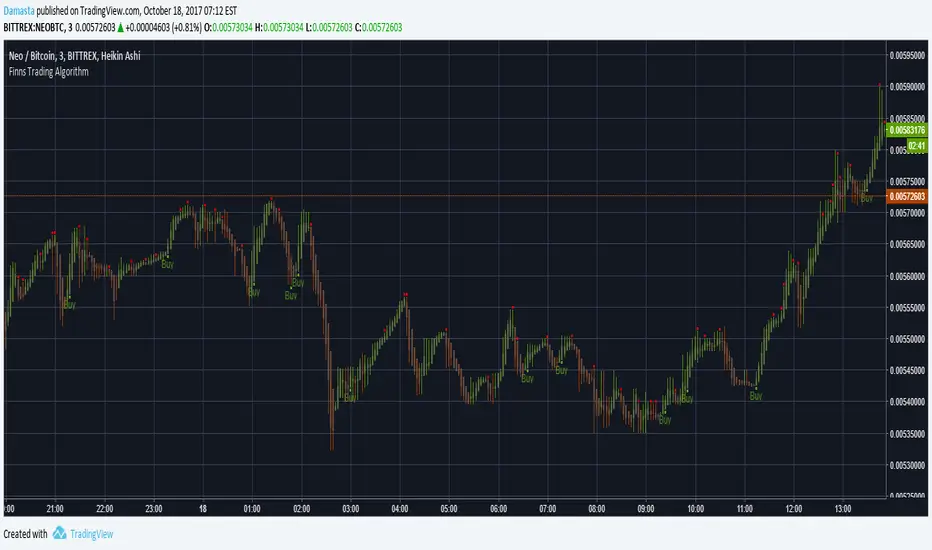
Finns Trading Algorithm AlertsHello there,
I have developed a Microprofit Script for Tradingview and would like to introduce you to it.
First of all some keypoints to it:
-It uses Gunbot
-Many Microtrades on a bullish market
-Even make Profit on Sideway & wavy downtrends
-Double up to infinity
-Controlled downtrend averaging
-Visualizer available allowing visible emulation of the Script & Gunbot trading together.
-More Features & Optimization still to come!
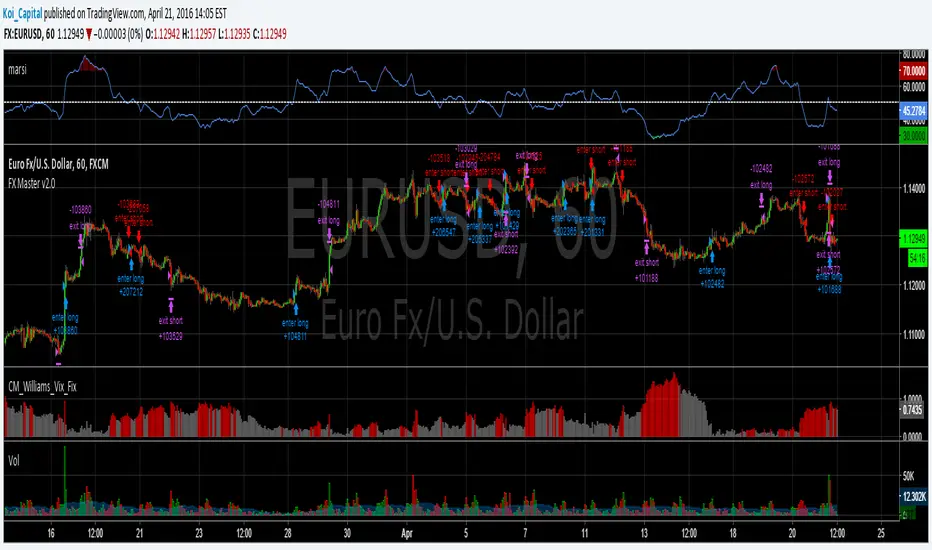
Forex Master v2.0 (EUR/USD)This is version 2 of my Forex Master algorithm originally posted here:
BACKTEST CONDITIONS:
Initial equity = $100,000 (no leverage)
Order size = 100% of equity
Pyramiding = disabled
TRADING RULES:
Long entry = EMA5(RSI20) cross> 50
Profit limit = 50 pips
Stop loss = 50 pips
Short entry = EMA5(RSI20) cross< 50
Profit limit = 50 pips
Stop loss = 50 pips
Long entry = Short exit
Short entry = long exit
DISCLAIMER: None of my ideas and posts are investment advice. Past performance is not an indication of future results. This strategy was constructed with the benefit of hindsight and its future performance cannot be guaranteed.
JAM ALGO Signals
"Remove the filters to view signals, then customize the parameters to your preference and enjoy using the indicator!" ✅
JAM ALGO Signals
Description:
🚀 Advanced Trading Signals with Risk Management & Alerts
This indicator is a complete all-in-one tool for traders seeking precise entries and exits with built-in risk management and real-time statistics. It combines RSI and EMA-based analysis, projected Take Profit (TP) and Stop Loss (SL) levels, customizable filters, and premium alerts directly on your TradingView chart.
✨ Key Features:
Entry Signals 🔹
Buy & Sell signals based on price action and RSI conditions.
Trend confirmation via EMA (200 and optional 50-period filters).
Visual signals: Labels, Arrows, Triangles, or Text.
Risk Management (RR) ⚖️
Define Stop Loss (SL) and multiple Take Profit levels (TP1, TP2, TP3) based on risk ratio (R).
Configurable projection bars to visualize target levels.
Colored zones for TP & SL, with optional borders for clarity.
Premium Alerts 🔔
Alerts for BUY / SELL signals, TP1 / TP2 / TP3, and SL hits.
Instant notifications when levels are reached.
Advanced Filters 🛡️
EMA50 Trend Filter: confirms short-term trend.
RSI Direction Filter: ensures momentum alignment.
Volatility Filter (ATR14 > Range): ensures enough market movement.
Candle Size Filter: avoids entries on too small candles.
SL Overlap Filter: prevents trades overlapping existing SL levels.
Real-Time Statistics 📊
Total trades, wins (TP1), and losses (SL).
Winrate (%), cumulative profit, and average RR ratio.
Optimizes strategy tracking directly on the chart.
Customizable Visuals 🎨
TP & SL line colors and styles (solid, dashed, dotted).
Fully adjustable signal labels (color, size, type).
Configurable stats table with background & text colors.
🔥 Advantages:
Complete tool for day trading and swing trading.
Clear visualization of critical risk/reward levels.
Automatic alerts for fast reaction without constant monitoring.
Integrated statistics for performance evaluation and strategy improvement.
Recommended for:
Traders using price action, intraday strategies, scalping, or swing trading, who want advanced risk management with visual signals and performance analytics on TradingView.

Smart Money Liquidity Structure AlgoSmart Money Liquidity Structure Algo is a rule-based trading strategy designed to analyze market structure, liquidity zones, and volatility conditions.
The script combines structure breakout logic, volatility filtering, order-block style price gaps, and Supertrend direction to generate systematic long and short signals.
This strategy is intended for educational and research purposes, helping traders study how liquidity, structure, and trend alignment can be combined into a single framework.
All signals are generated objectively using predefined conditions without repainting after bar close.
The strategy includes built-in risk management logic using ATR-based stop-loss and trailing exit mechanisms.
⚙️ Core Logic Overview
Market structure based on pivot-derived support and resistance
Volatility normalization filter to avoid low-activity periods
Price gap detection inspired by order-block concepts
Supertrend-based directional confirmation
Time-based holding logic before exits are allowed
✨ Features
Rule-based long and short entries
Liquidity & structure breakout detection
Volatility-filtered signal generation
Optional Supertrend trend filter
ATR-based stop-loss and trailing exits
Non-repainting logic after candle close
🧪 How to Use
Apply on liquid markets such as crypto, indices, or forex
Works best on intraday to higher timeframes
Adjust volatility filter and ATR multiplier based on the instrument
Always forward-test and paper-trade before live use
⚠️ Disclaimer
This script is not financial advice.
Trading involves risk, and past performance does not guarantee future results.
Use this strategy for analysis, testing, and educational purposes only.

AI ALGO SETUP by A+AI ALGO SETUP by A+.
This Setup helps the Intraday Trader have an Edge in the Market

Anup Algo + For Full Version Contact on Whatsapp +918123456805Best indicator For Algo Trading Auto Buys & Sells, Auto Tp & Sl Works for All pairs forex commodities crypto
Contact on Whatsapp +918123456805 for full version

NAS Ultimate Algo v2.5NAS Ultimate Algo v2.5 has following features:
1. Dynamic Trailing SL Label
2. Auto-Hide on TP Hit
3. Dynamic Take-Profit Targets (ATR-based)
4. Label Colour Customization
