Global BB Resonance [by TESTEDED]📈 Global BB Resonance Hunter
1. Design Philosophy: Dimensional Reduction
In modern trading, "Information Overload" is the enemy. Traders often clutter their charts with 15+ Bollinger Band lines across 1H, 4H, Daily, and Weekly timeframes, resulting in a "spaghetti chart" that is impossible to read quickly.
The core logic of this indicator is "Dimensional Reduction." Instead of drawing every single line, this script runs a background algorithm to detect "Confluence" (Resonance).
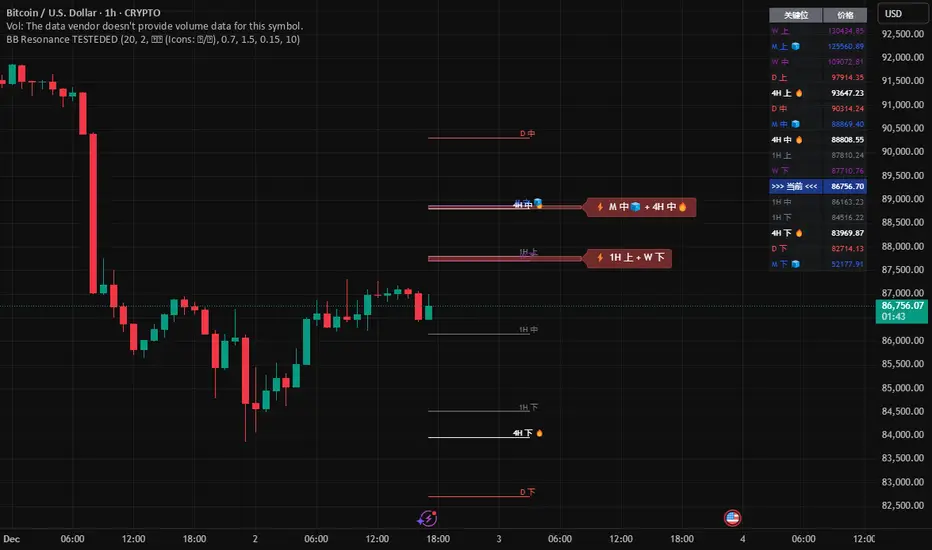
The Thesis: A single Bollinger line (e.g., 1H Upper) is easily broken. However, when multiple dimensions overlap (e.g., 1H Upper + Daily Mid + Weekly Low) at the exact same price level, a "Market Consensus" is formed. These are the critical "Walls" of the market.
The Solution: We sort all data by Price, not Time. If lines cluster together within a specific threshold (e.g., 0.15%), the script draws a single Resonance Box instead of multiple confusing lines.
2. Key Features
🛡️ Multi-Timeframe Monitoring: Simultaneously monitors 1H, 4H, Daily, Weekly, and Monthly Bollinger Bands in the background, regardless of your chart's current timeframe.
⚡ Smart Resonance Detection: Automatically groups overlapping levels into "Resonance Boxes."
⚡ (2-Line Confluence): Watch closely.
⚡⚡ (3-Line Confluence): Strong Support/Resistance.
⚡⚡⚡ (4+ Lines): "Iron Wall" Resonance.
📊 Volatility State Perception: Detects if the bands are Squeezing (accumulating energy) or Expanding (trending).
Style Options: Choose between Icons (🧊/🔥) or Geek Symbols (>.< / <^>).
🧘 Focus Mode (Sniper View): A unique feature that hides all individual lines, leaving only the Resonance Boxes and the Dashboard. This keeps your chart clean and distraction-free.
🔔 Smart Alerts: Get notified immediately when Price touches a Resonance Box or when a Squeeze occurs.
3. Visual Guide
A. The Symbols (State Indicators)
You can switch styles in the settings.
B. The Resonance Boxes
Red Box: Resistance Zone (Above Price).
Green Box: Support Zone (Below Price).
Label: E.g., ⚡⚡ 1H Up + D Mid. This tells you exactly which levels are overlapping.
4. Usage Strategy
The "Reversal" Setup: Look for a Green Resonance Box below price with High Confluence (⚡⚡). Ensure the state is NOT Expanding (<^> or 🔥).
The "Breakout" Setup: Look for the Squeeze Symbol (>.< or 🧊) on the dashboard. If price approaches a Resonance Box while Squeezing, expect a breakout.
The "Sniper" Method: Turn on Focus Mode. Set Alerts. Only look at the chart when price hits a "Wall."
How to use: youtu.be
📈 布林带多维共振捕猎者
1. 设计哲学:降维打击
在现代交易中,“信息过载”是最大的敌人。交易者经常在图表上叠加 1H、4H、日线、周线等 15 条以上的布林带线条,导致图表像“盘丝洞”一样难以阅读。
本指标的核心逻辑是“降维打击”与“数据可视化”。 我们不再画出每一条线,而是在后台运行算法来捕捉**“共振”(Confluence)**。
核心理念:单一周期的布林线(如 1H 上轨)很容易被刺破。但是,当多个维度的力量(如 1H 上轨 + 日线中轨 + 周线下轨)在同一个价格水平重叠时,就形成了**“市场合力”**。这些位置才是市场真正的“铜墙铁壁”。
解决方案:系统按价格而非时间对数据进行排序。如果多条线在特定阈值(如 0.15%)内聚集,脚本会画出一个**“共振框”**,而不是无数条混乱的线。
2. 核心功能
🛡️ 全维幽灵监控:无论当前图表周期如何,脚本都会在后台实时监控 1H, 4H, 日线, 周线, 月线 的数据。
⚡ 智能共振雷达:自动检测并合并重叠的关键位。
⚡ (2线共振):值得关注。
⚡⚡ (3线共振):强力支撑/阻力。
⚡⚡⚡ (4线以上):核弹级/铁壁共振。
📊 波动率状态感知:自动识别布林带是处于 挤压蓄势 还是 扩张爆发 阶段。
风格切换:支持 图标模式 (🧊/🔥) 或 极客符号模式 (>.< / <^>)。
🧘 专注模式 (Focus Mode):一键隐藏所有单线,只保留共振框和仪表盘。让您的图表瞬间清空,像狙击手一样只关注目标。
🔔 智能警报:当价格触及共振框,或出现极度压缩信号时,立即发送警报。
3. 视觉指南
A. 状态符号说明
您可以在设置中切换显示风格。
B. 共振框说明
红色方框:上方阻力区 (Resistance)。
绿色方框:下方支撑区 (Support)。
标签示例:⚡⚡ 1H Up + D Mid —— 明确告知您是哪几条线发生了共振。
4. 实战策略
“反转”交易:寻找价格下方的绿色共振框,且具有高星级 (⚡⚡)。前提是当前状态不是扩张状态 (<^> 或 🔥)。
“突破”交易:在仪表盘上看到 挤压符号 (>.< 或 🧊)。如果价格在挤压状态下逼近共振框,不要逆势阻挡,大概率会发生强力突破。
“狙击”模式:开启 专注模式。设置好警报。不要盯着 K 线波动,直到价格撞上“墙壁”触发警报时再介入。
使用说明: youtu.be
Cari dalam skrip untuk "bollingerband"
Bollinger Bands HTF Hardcoded (Len 20 / Dev 2) [CHE]Bollinger Bands HTF Hardcoded (Len 20 / Dev 2) — Higher-timeframe BB emulation with bucket-based length scaling and on-chart diagnostics
Summary
This indicator emulates higher-timeframe Bollinger Bands directly on the current chart by scaling a fixed base length (20) via a timeframe-to-bucket multiplier map. It avoids cross-timeframe requests and instead applies the “HTF feel” by using a longer effective lookback on lower timeframes. Bands use the classic deviation of 2 and the original color scheme (Basis blue, Upper red, Lower green, blue fill). An on-chart table reports the resolved bucket, multiplier, and effective length.
Pine version: v6
Overlay: true
Primary outputs: Basis (SMA), Upper/Lower bands, background fill, optional info table
Motivation: Why this design?
Cross-timeframe Bollinger Bands typically rely on `request.security`, which can introduce complexity, mixed-bar alignment issues, and potential repaint paths depending on how users consume signals intrabar. This design offers a deterministic alternative: a single-series calculation on the chart timeframe, with a hardcoded “HTF emulation” achieved by scaling the BB length according to coarse higher-timeframe buckets. The result is a smoother, slower band structure on low timeframes without external timeframe calls.
What’s different vs. standard approaches?
Baseline: Standard Bollinger Bands with a fixed user length on the current timeframe, or true HTF bands via `request.security`.
Architecture differences:
Fixed base parameters: Length = 20, Deviation = 2.
Bucket mapping derived from the chart timeframe (or manually overridden).
No `request.security`; all computations occur on the current series.
Effective length is “20 × multiplier”, where multiplier approximates aggregation into the chosen bucket.
Diagnostics table for transparency (bucket, multiplier, resolved length, bandwidth).
Practical effect: On lower timeframes, the effective length becomes much larger, behaving like a higher-timeframe Bollinger structure (smoother basis and wider stability), while remaining purely local to the chart series.
How it works (technical)
The script first resolves a target bucket (“Auto” or a manual selection such as 60/240/1D/…/12M). It then computes a multiplier that approximates how many current bars fit into that bucket (e.g., 1m→60m uses mult≈60, 5m→60m uses mult≈12). The effective Bollinger length becomes:
`bb_len = 20 mult` (clamped to at least 1)
Using the effective length, it calculates:
`basis = ta.sma(src, bb_len)`
`dev = 2 ta.stdev(src, bb_len)`
`upper = basis + dev`
`lower = basis - dev`
A “bandwidth” diagnostic is also computed as `(upper-lower) / basis` (guarded against division by zero) and shown in the table as a percentage. A persistent table object is created/deleted based on the visibility toggle and updated only on the last bar for performance.
Parameter Guide
Source — Input series for the bands — Default: Close
Use close for classic behavior; smoother sources reduce responsiveness.
Bucket — HTF bucket selection — Default: Auto
Auto derives a bucket from the chart timeframe; manual selection forces the intended target bucket.
Offset — Plot offset — Default: 0
Shifts plots forward/back for visual alignment, displayed in the data window.
Table X / Table Y — Table anchor — Default: Right / Top
Places the diagnostics table in one of nine anchor points.
Table Size — Table text size — Default: Normal
Use small on dense charts, large for presentations.
Dark Mode — Table theme — Default: Enabled
Switches table palette for readability against chart background.
Show Table — Toggle diagnostics table — Default: Enabled
Disable for a cleaner chart.
Reading & Interpretation
Basis (blue): The moving average centerline of the bands (SMA of effective length).
Upper (red) / Lower (green): ±2 standard deviations around the basis using the same effective length.
Fill (blue tint): Visual band zone to quickly see compression/expansion.
Interpretation staples:
Price riding the upper band suggests strong bullish pressure; riding the lower band suggests strong bearish pressure.
Band expansion indicates rising volatility; contraction indicates volatility compression.
Mean reversion setups often key off the basis and re-entries from outside bands, while breakout/trend setups often key off sustained band rides.
Diagnostics table:
HTF Tag: Human-readable label showing the current timeframe → bucket mapping.
Bucket: The resolved target bucket (Auto result or manual selection).
Multiplier: The integer factor applied to the base length.
Len/Dev: Shows base length (20) and the effective length result plus deviation (2).
Bandwidth: Normalized width of the band (percent), useful for spotting squeezes.
Practical Workflows & Combinations
HTF context on LTF charts: Use this as “slow structure” bands on 1m–15m charts without requesting HTF data.
Squeeze detection: Watch bandwidth shrink to historically low levels, then look for break/hold outside bands.
Trend filtering: Favor long bias when price stays above the basis and repeatedly respects it; favor short bias when below.
Confluence: Combine with market structure (swing highs/lows), volume tools, or a trend filter (e.g., a longer MA) for confirmation.
Behavior, Constraints & Performance
Repaint/confirmation: No cross-timeframe requests. Values can still evolve intrabar and settle on close, as with any indicator computed on live bars.
History requirements: Very large effective lengths need sufficient historical bars; expect a warm-up period after loading or switching symbols/timeframes.
Known limits: Because the method approximates HTF behavior by scaling lookback, it is not identical to true HTF Bollinger Bands computed on aggregated candles. In particular, volatility and mean can differ slightly versus a real HTF series.
Sensible Defaults & Quick Tuning
Default workflow:
Bucket: Auto
Source: Close
Table: On (until you trust the mapping), then optionally off
If bands feel too slow on your timeframe: choose a smaller bucket (e.g., 60 instead of 240).
If bands feel too reactive/noisy: choose a larger bucket (e.g., 1D or 3D).
If chart looks cluttered: hide the table; keep only the bands and fill.
What this indicator is—and isn’t
This is a Bollinger Band visualization layer that emulates higher-timeframe “slowness” via deterministic length scaling. It is not a complete trading system and does not include entries, exits, sizing, or risk management. Use it as context alongside your execution rules and protective stops.
Disclaimer
The content provided, including all code and materials, is strictly for educational and informational purposes only. It is not intended as, and should not be interpreted as, financial advice, a recommendation to buy or sell any financial instrument, or an offer of any financial product or service. All strategies, tools, and examples discussed are provided for illustrative purposes to demonstrate coding techniques and the functionality of Pine Script within a trading context.
Any results from strategies or tools provided are hypothetical, and past performance is not indicative of future results. Trading and investing involve high risk, including the potential loss of principal, and may not be suitable for all individuals. Before making any trading decisions, please consult with a qualified financial professional to understand the risks involved.
By using this script, you acknowledge and agree that any trading decisions are made solely at your discretion and risk.
Do not use this indicator on Heikin-Ashi, Renko, Kagi, Point-and-Figure, or Range charts, as these chart types can produce unrealistic results for signal markers and alerts.
Best regards and happy trading
Chervolino.

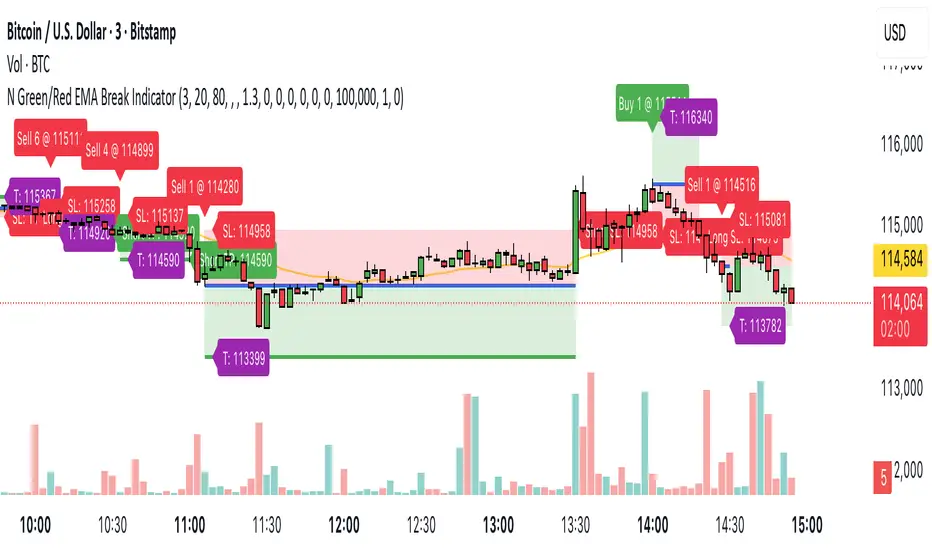
N Green/Red EMA Break IndicatorThis indicator identifies breakout opportunities that occur after N consecutive candles close above or below the EMA,
and then plots full trade zones — including entry, stop loss (SL), and 1:1 target (TGT) with optional alerts and position sizing.
Bollinger Bands Difference Score
Bollinger Bands Difference Score (TradingView – Pine Script v6)
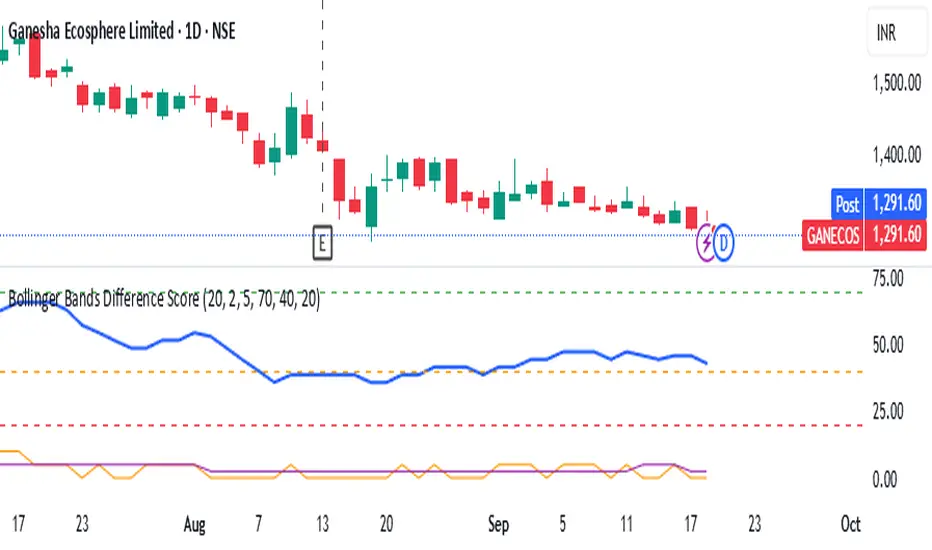
The **Bollinger Bands Difference Score** is a volatility-based scoring system designed to help traders quickly assess whether a stock is in a **strong trend, neutral zone, or weak setup**. It transforms the raw **Bollinger Band Width (BB-Diff)** into a **normalized score (0–100)** and classifies conditions with intuitive thresholds.
---
### 🔹 What is Bollinger Bands Difference (BB-Diff)?
* **Bollinger Bands** are built from a moving average with upper and lower bands set by standard deviations.
* The **difference (or width)** between the bands reflects market volatility.
* A **high difference** = wide bands = strong volatility (breakout/trend).
* A **low difference** = narrow bands = low volatility (consolidation).
This indicator standardizes BB-Diff into a score and smooths it for cleaner signals.
---
### 🔹 Key Features
1. **BB-Diff Scoring System**
* Converts Bollinger Band width into a **0–100 normalized score**.
* Higher score → higher volatility/trend strength.
* Lower score → consolidation or weaker momentum.
2. **Signal Levels**
* **Strong Zone (≥ 70):** Indicates strong trend strength or expansion in volatility.
* **Neutral Zone (40–70):** Sideways or undecided price action.
* **Weak Zone (≤ 20):** Suggests very low volatility, potential upcoming squeeze.
3. **Score Smoothing**
* Applies a moving average to reduce noise.
* Helps avoid false signals during choppy markets.
4. **Visual Enhancements**
* Plots the score as a line (0–100 scale).
* Adds horizontal reference lines for **Strong**, **Neutral**, and **Weak** levels.
* Background colors automatically highlight **bullish strength (green)** or **weakness (red)**.
---
### 🔹 How to Use
* **Trend Confirmation:**
Look for scores **above 70** → suggests trend continuation or volatility breakout.
* **Consolidation Watch:**
Scores in the **20 or below** zone may precede volatility squeezes → breakout setups.
* **Neutral Zone:**
Scores between **40–70** suggest sideways price action; avoid aggressive trades.
* **Combine with Price Action:**
Use with support/resistance, candlestick patterns, or momentum indicators for confirmation.
---
### 🔹 Best Practices
* Great as a **volatility filter** before entries.
* Use in combination with **RSI, MACD, or OBV** for directional bias.
* Works well for **breakout trading** (when score rises from low levels).
* Monitor on multiple timeframes for alignment.
---
✅ **In summary:** The **Bollinger Bands Difference Score** is a simple yet powerful tool that quantifies volatility strength into an actionable score, making it easier to spot strong trends, consolidation phases, and potential breakout opportunities.
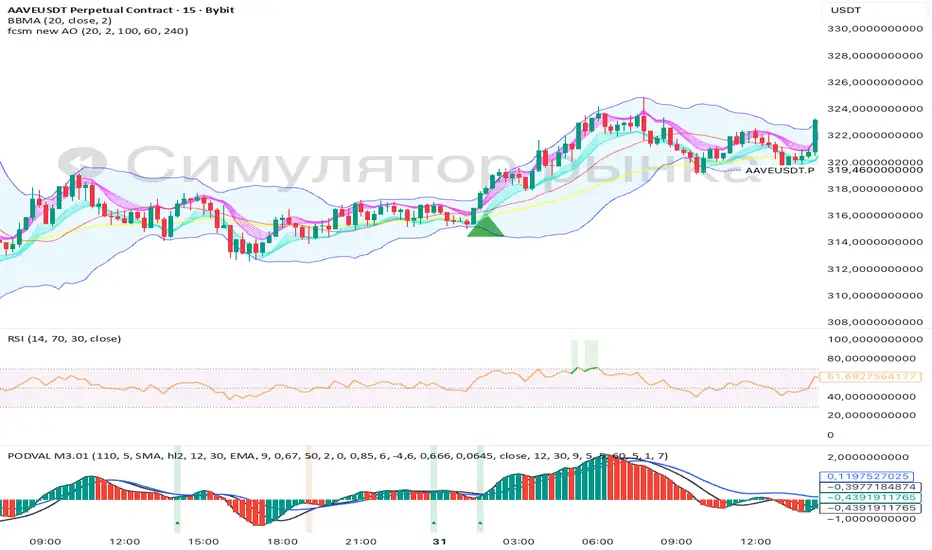
fcsm new AOA clean, rules-based signal tool that combines Bollinger Bands breakouts with a multi-timeframe Awesome Oscillator (AO) filter.
Designed for entries on a lower timeframe (e.g., M15) while confirming trend bias from higher timeframes
Calm before the StormCalm before the Storm - Bollinger Bands Volatility Indicator
What It Does
This indicator identifies and highlights periods of extremely low market volatility by analyzing Bollinger Bands distance. It uses percentile-based analysis to find the "quietest" market periods and highlights them with a gradient background, operating on the premise that low volatility periods often precede significant price movements.
How It Works
Volatility Measurement: Calculates the distance between Bollinger Bands upper and lower boundaries
Percentile Analysis: Analyzes the lowest X% of volatility periods over a configurable lookback period (default: lowest 40% over 200 bars)
Visual Highlighting: Uses gradient opacity to show volatility levels - the lower the volatility, the more opaque the background highlighting
Adaptive Threshold: Automatically calculates what constitutes "low volatility" based on recent market conditions
Who Should Use It
Primary Users:
Breakout Traders: Looking for consolidation periods that may precede significant moves
Options Traders: Seeking low implied volatility periods before volatility expansion
Swing Traders: Identifying accumulation/distribution phases before trend continuation or reversal
Range Traders: Spotting tight trading ranges for mean reversion strategies
Trading Styles:
Volatility-based strategies
Breakout and momentum trading
Options strategies (volatility plays)
Market timing approaches
When to Use It
Market Conditions:
Consolidation Phases: When price is moving sideways with decreasing volatility
Pre-Announcement Periods: Before earnings, economic data, or major events
Market Transitions: During shifts between trending and ranging markets
Low Volume Periods: When institutional participation is reduced
Strategic Applications:
Entry Timing: Wait for volatility compression before positioning for breakouts
Risk Management: Reduce position sizes during highlighted periods (anticipating volatility expansion)
Options Strategy: Sell premium during low volatility, buy during expansion
Multi-Timeframe Analysis: Combine with higher timeframe trends for confluence
Key Benefits
Objective Volatility Measurement: Removes subjectivity from identifying "quiet" markets
Adaptive Analysis: Automatically adjusts to current market conditions
Visual Clarity: Easy-to-interpret gradient highlighting
Customizable Sensitivity: Adjustable percentile thresholds for different trading styles
Best Used In Combination With:
Trend analysis tools
Support/resistance levels
Volume indicators
Momentum oscillators
This indicator is particularly valuable for traders who understand that periods of low volatility are often followed by periods of high volatility, allowing them to position ahead of potential significant price movements.
[DIP] Inverse BB HighlightThis indicator allows you to highlight the area outside of the Bollinger Bands in order to draw more attention to it. This is especially useful for those who only trade when we are outside of the bands.
Keep in mind this indicator only works on bars, not on candles.

H BollingerBollinger Bands are a widely used technical analysis indicator that helps spot relative price highs and lows. The tool comprises three lines: a central band representing the 20-period simple moving average (SMA), and upper and lower bands usually placed two standard deviations above and below the SMA. These bands adjust with market volatility, offering insights into price fluctuations and trading conditions.
How this indicator works
Bollinger Bands helps traders assess price volatility and potential price reversals. They consist of three bands: the middle band, the upper band, and the lower band. Here's how Bollinger Bands work:
Middle band: This is typically a simple moving average (SMA) of the asset's price over a specified period. The most common period used is 20 days.
Upper band: This is calculated by adding a specified number of standard deviations to the middle band. The standard deviation measures the asset's price volatility. Commonly, two standard deviations are added to the middle band.
Lower band: Similar to the upper band, it is calculated by subtracting a specified number of standard deviations from the middle band.
What do Bollinger Bands tell you?
Bollinger bands primarily indicate the level of market volatility and trading opportunities. Narrow bands indicate low market volatility, while wide bands suggest high market volatility. Bollinger bands indicators can be used by traders to assess potential buy or sell signals. For instance, a sell signal may be interpreted or generated if the asset’s price moves closer or crosses the upper band, as it may indicate that the asset is overbought. Alternatively, a buy signal may be interpreted or generated if the price moves closer to the lower band, as it may signify that the asset is oversold.
However, traders should be cautious when using Bollinger Bands as standalone indicators when making trading decisions. Experienced traders refrain from confirming signals based on one indicator. Instead, they generally combine various technical indicators and fundamental analysis methods to make informed trading decisions. Basing trading decisions on only one indicator can result in misinterpretation of signals and heavy losses.
Bollinger Bands assist in identifying whether prices are relatively high or low. They are applied as a pair—upper and lower bands—alongside a moving average. However, these bands are not designed to be used in isolation. Instead, they should be used to validate signals generated by other technical indicators.
Calculation of Bollinger Band

Bollinger Bands Levels | VTS Pro📊 Bollinger Bands Levels | VTS Pro
by Alireza Mossaheb
This advanced Bollinger Bands indicator takes your technical analysis to the next level by providing dynamic price bands along with customizable horizontal levels and labels. Whether you're a trend trader or a mean reversion strategist, this tool adapts to your workflow.
🔧 Key Features:
Three Modes: Choose between Strong (20, 2), Weak (10, 1.5), or Custom settings for full control.
Multi-Timeframe Support: Plot Bollinger Bands from any higher or lower timeframe.
Multiple MA Types: Select from SMA, EMA, RMA (SMMA), WMA, and VWMA for the basis line.
Visual Enhancements:
Optional background fill between bands
Stylized horizontal lines with labels (Top/Mid/Low)
Customizable line style, width, and color
Smart Labeling: Automatically names levels based on timeframe and mode.
Improved Plot Logic: Line width bug fixed for smoother rendering across presets.
🧠 Ideal For:
Spotting volatility squeezes or expansions
Confirming support/resistance with upper/lower bands
Creating confluence zones using higher timeframe Bollinger levels

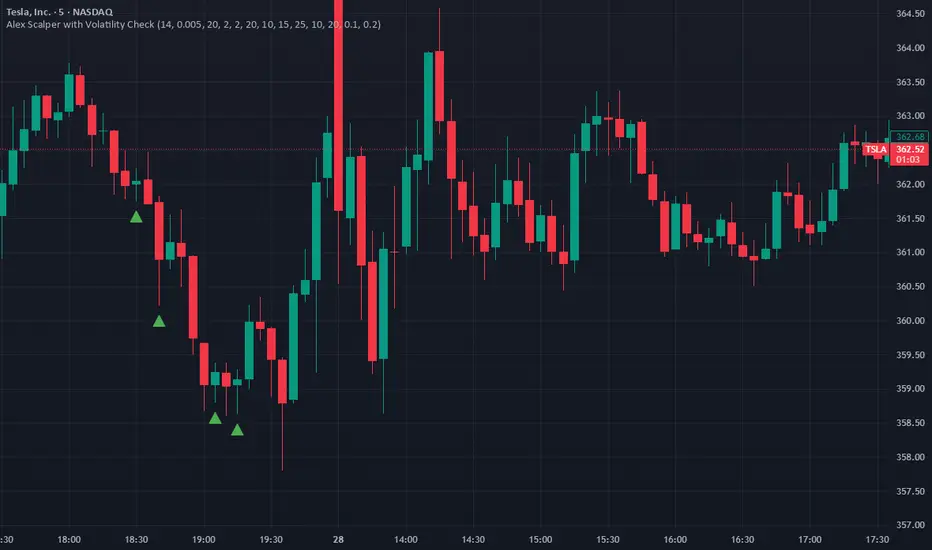
Alex Scalper with Volatility CheckAlex Scalper with Volatility Check - Script Description
This Pine Script indicator is a comprehensive scalping strategy designed for short-term trading with built-in risk management and volatility filtering.
Key Features:
📊 Core Strategy:
Uses VWAP (Volume Weighted Average Price) as the primary trend filter
Employs Stochastic oscillator for entry timing (oversold/overbought conditions)
Generates buy signals when price is above VWAP with stochastic momentum
Generates sell signals when price is below VWAP with stochastic reversal
🛡️ Risk Management:
Volatility Protection: Automatically pauses trading during high volatility periods using ATR and Bollinger Band width analysis
Multi-Target System: Three take-profit levels (10, 15, 25 points) for progressive profit-taking
Fixed Stop Loss: 20-point stop loss protection
Position Sizing: Dynamic lot size adjustment based on win/loss performance
⏰ Trading Hours:
Restricted to US market hours (9:30-11:30 AM and 2:00-4:00 PM EST)
Prevents trading during low-liquidity periods
🔔 Alert System:
Real-time buy/sell alerts with complete trade information
Includes entry price, stop loss, take profit levels, and position size
Ready for automated trading integration
📈 Visual Elements:
Green triangles for buy signals below price bars
Red triangles for sell signals above price bars
Orange volatility warning labels during high-risk periods
This script is ideal for traders seeking a systematic approach to scalping with built-in protection against volatile market conditions.
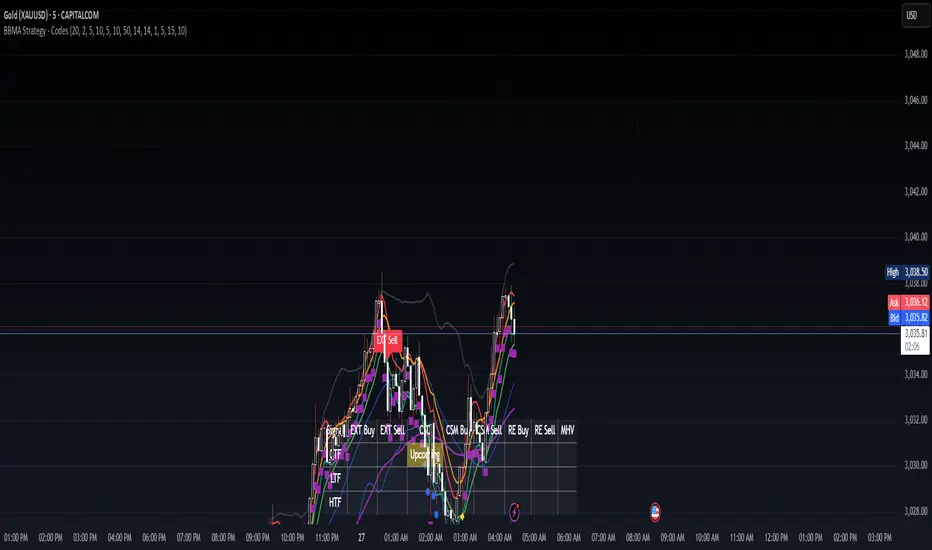
BBMA Strategy - EXT CSD CSM MHV RE CodesBINANCE:BTCUSD
Below is a detailed guide for using and interpreting the "BBMA Strategy - Enhanced EXT CSD CSM with Subplot" indicator. This guide is designed to be added to the description of the indicator when publishing it on TradingView. It provides clear instructions for users on how to apply the indicator, interpret its signals, and understand its features, including the multi-timeframe analysis and subplot table.
BBMA Strategy - Enhanced EXT CSD CSM with Subplot: User Guide
Overview
The "BBMA Strategy - Enhanced EXT CSD CSM with Subplot" is a comprehensive trading indicator built on the Bollinger Bands Moving Average (BBMA) framework. It combines multiple technical analysis tools—Bollinger Bands, Moving Averages (MAHI and MALO), EMA, ATR, volume analysis, RSI, MACD, market structure, and candlestick patterns—to identify high-probability trading setups. The indicator supports five key BBMA setups: EXT (Extreme), CSD (Consolidation), CSM (Continuation Setup Movement), RE (Re-Entry), and MHV (Market High Volatility).
This enhanced version includes:
Multi-Timeframe (MTF) Analysis: Confirms signals across a Lower Timeframe (LTF) and Higher Timeframe (HTF) for stronger trade validation.
Subplot Table: Displays signal status ("Active" or "Upcoming") and MTF confirmations in a clear table format.
Market Structure and Volume Filters: Incorporates Break of Structure (BOS), RSI divergence, and volume conditions to filter out low-probability trades.
Customizable Settings: Adjust Bollinger Bands, MA periods, timeframes, and more to suit your trading style.
This indicator is suitable for traders of all levels and can be used across various markets (e.g., forex, crypto, stocks) and timeframes (1M to 1D).
How to Use the Indicator
1. Add the Indicator to Your Chart
Open TradingView and load the chart of your chosen asset (e.g., BTCUSD, EURUSD, XAUUSD).
Go to the Pine Editor, paste the indicator code, and click "Add to Chart."
The indicator will overlay on your chart, displaying Bollinger Bands, Moving Averages, EMA, and signal labels. A subplot table will appear at the bottom of the chart.
2. Configure the Settings
The indicator provides customizable inputs to tailor it to your trading preferences. Access the settings by clicking the gear icon next to the indicator name on your chart:
Bollinger Bands Settings:
BB Period: Default is 20. Adjust the lookback period for Bollinger Bands.
BB Deviations: Default is 2. Adjust the standard deviation for the bands.
MAHI Settings (Moving Averages on High):
MAHI 5 Period: Default is 5. Period for the shorter MA on highs.
MAHI 10 Period: Default is 10. Period for the longer MA on highs.
MALO Settings (Moving Averages on Low):
MALO 5 Period: Default is 5. Period for the shorter MA on lows.
MALO 10 Period: Default is 10. Period for the longer MA on lows.
EMA Settings:
EMA Period: Default is 50. Adjust the period for the Exponential Moving Average.
ATR Settings:
ATR Period: Default is 14. Period for the Average True Range.
ATR SMA Period: Default is 14. Period for the ATR smoothing.
Timeframe Settings:
Minor HTF: Default is 1h. Select the minor higher timeframe for trend confirmation.
Major HTF: Default is 4h. Select the major higher timeframe for trend confirmation.
Lower TF for Confirmation: Default is 5m. Select the lower timeframe for signal confirmation.
Market Structure Settings:
Market Structure Lookback: Default is 10. Adjust the lookback period for swing highs/lows in market structure analysis.
3. Select Your Chart Timeframe
The indicator works on any timeframe from 1 minute (1M) to 1 day (1D).
For best results, align your chart timeframe (Current Timeframe, CTF) with the LTF and HTF settings:
Example: If CTF is 15m, set LTF to 5m and HTF to 1h or 4h.
This ensures proper multi-timeframe alignment for signal confirmation.
Indicator Components
Main Chart Elements
Bollinger Bands (BB): Plotted as three lines (upper, middle, lower) to identify volatility and potential reversal zones.
Upper Band: Blue line.
Middle Band: Black line (basis).
Lower Band: Blue line.
MAHI (Moving Averages on High): Two weighted moving averages on highs to detect trend direction.
MAHI 5: Green line.
MAHI 10: Lime line.
MALO (Moving Averages on Low): Two weighted moving averages on lows to confirm trend direction.
MALO 5: Red line.
MALO 10: Orange line.
EMA (50-period): Purple line to identify the overall trend.
Signal Labels: Appear on the chart when a setup is confirmed:
EXT Buy: Green upward arrow (reversal buy at BB lower band).
EXT Sell: Red downward arrow (reversal sell at BB upper band).
CSM Buy: Teal upward arrow (continuation buy above BB middle).
CSM Sell: Maroon downward arrow (continuation sell below BB middle).
RE Buy: Aqua upward arrow (re-entry buy between BB lower and middle).
RE Sell: Fuchsia downward arrow (re-entry sell between BB upper and middle).
MHV: Orange label (high volatility breakout after consolidation).
CSD: Yellow diamond (consolidation signal).
Subplot Table
Located at the bottom of the chart, the table summarizes signal status across three timeframes:
CTF (Current Timeframe): Shows "Active" (signal confirmed) or "Upcoming" (signal forming) for each setup.
LTF (Lower Timeframe): Displays a checkmark (✔) if the signal is confirmed on the LTF.
HTF (Higher Timeframe): Displays a checkmark (✔) if the signal is confirmed on the HTF.
Columns represent the five BBMA setups: EXT Buy, EXT Sell, CSD, CSM Buy, CSM Sell, RE Buy, RE Sell, and MHV.
Interpreting the Signals
1. EXT (Extreme) Setup
EXT Buy (Green Arrow):
Condition: Price touches or breaks below the BB lower band, closes above it, with high ATR volatility, strong volume, and additional confirmations (e.g., hammer candle, RSI oversold, MACD bullish, MAHI/MALO crossover, or bullish divergence).
Interpretation: A potential reversal buy signal. Look for confirmation in the subplot table (LTF and HTF rows).
Action: Consider a long position if LTF and HTF confirm (✔ in both rows). Use the BB middle or upper band as a target.
EXT Sell (Red Arrow):
Condition: Price touches or breaks above the BB upper band, closes below it, with high ATR volatility, strong volume, and additional confirmations (e.g., shooting star candle, RSI overbought, MACD bearish, MAHI/MALO crossunder, or bearish divergence).
Interpretation: A potential reversal sell signal.
Action: Consider a short position if LTF and HTF confirm. Use the BB middle or lower band as a target.
2. CSD (Consolidation) Setup
CSD (Yellow Diamond):
Condition: BB width is narrow (below its SMA), low ATR volatility, small candles, and no MAHI/MALO crossovers.
Interpretation: The market is consolidating, often preceding a breakout (e.g., MHV).
Action: Avoid trading during CSD unless preparing for an MHV breakout. Monitor the subplot for "Upcoming" MHV signals.
3. CSM (Continuation Setup Movement)
CSM Buy (Teal Arrow):
Condition: Price is above the BB middle, MAHI crossover, MALO crossover or MACD bullish, price above EMA 50, with additional confirmations (e.g., bullish engulfing or MACD bullish).
Interpretation: A continuation buy signal in an uptrend.
Action: Enter a long position if LTF and HTF confirm. Target the BB upper band or recent swing highs.
CSM Sell (Maroon Arrow):
Condition: Price is below the BB middle, MAHI crossunder, MALO crossunder or MACD bearish, price below EMA 50, with additional confirmations (e.g., bearish engulfing or MACD bearish).
Interpretation: A continuation sell signal in a downtrend.
Action: Enter a short position if LTF and HTF confirm. Target the BB lower band or recent swing lows.
4. RE (Re-Entry) Setup
RE Buy (Aqua Arrow):
Condition: Price is between the BB lower and middle bands, MAHI crossover, MALO crossover or MACD bullish, price above EMA 50, with additional confirmations (e.g., bullish engulfing or MACD bullish).
Interpretation: A re-entry buy signal after a pullback in an uptrend.
Action: Enter a long position if LTF and HTF confirm. Target the BB middle or upper band.
RE Sell (Fuchsia Arrow):
Condition: Price is between the BB upper and middle bands, MAHI crossunder, MALO crossunder or MACD bearish, price below EMA 50, with additional confirmations (e.g., bearish engulfing or MACD bearish).
Interpretation: A re-entry sell signal after a pullback in a downtrend.
Action: Enter a short position if LTF and HTF confirm. Target the BB middle or lower band.
5. MHV (Market High Volatility) Setup
MHV (Orange Label):
Condition: Follows a CSD signal, with expanding BB width, high ATR volatility, strong volume, and MAHI/MALO crossover or crossunder.
Interpretation: A breakout signal after consolidation, indicating high volatility and potential for a strong move.
Action: Trade in the direction of the breakout (e.g., buy if MAHI crossover, sell if MAHI crossunder). Confirm with LTF and HTF. Target significant levels like recent swing highs/lows.
6. Multi-Timeframe Confirmation
LTF Confirmation: A checkmark (✔) in the LTF row indicates the signal is also present on the lower timeframe (e.g., 5m). This adds confidence to the trade.
HTF Confirmation: A checkmark (✔) in the HTF row indicates alignment with the higher timeframe trend (e.g., 4h). This confirms the signal's strength.
Strongest Signals: Look for signals with both LTF and HTF confirmations (✔ in both rows). These have the highest probability of success.
7. Upcoming Signals
The CTF row in the subplot table may show "Upcoming" for a setup (e.g., EXT Buy: Upcoming). This indicates the setup is forming but not yet confirmed.
Action: Monitor these setups closely. They may turn "Active" on the next candle if conditions are met.
Trading Tips
Trend Alignment: Use the EMA 50 and market structure (is_uptrend) to ensure trades align with the overall trend. For example, prioritize CSM Buy signals in an uptrend.
Risk Management:
Set stop-losses below recent swing lows (for buys) or above recent swing highs (for sells).
Use the BB middle or opposite band as a target for most setups.
Avoid Overtrading: Focus on signals with LTF and HTF confirmations to filter out noise.
Timeframe Selection:
Scalping: Use 1m or 5m CTF with 1m LTF and 15m HTF.
Day Trading: Use 15m or 1h CTF with 5m LTF and 4h HTF.
Swing Trading: Use 4h or 1D CTF with 1h LTF and 1D HTF.
Backtesting: Test the indicator on historical data for your chosen asset and timeframe to understand its performance.
Alerts
The indicator includes built-in alerts for each setup:
EXT Buy/Sell: Triggers when an EXT signal is confirmed.
CSD: Triggers during consolidation.
CSM Buy/Sell: Triggers for continuation signals.
RE Buy/Sell: Triggers for re-entry signals.
MHV: Triggers for high volatility breakouts. To set up alerts:
Right-click on the chart and select "Add Alert."
Choose the condition (e.g., "BBMA EXT Buy").
Set your preferred notification method (e.g., email, SMS).
Limitations
Lagging Indicators: The indicator uses moving averages and other lagging tools, which may delay signals in fast-moving markets.
False Signals: Like all indicators, it can produce false signals, especially in choppy markets. Use LTF/HTF confirmations to filter trades.
Timeframe Dependency: Ensure your CTF, LTF, and HTF are properly aligned to avoid conflicting signals.
DT Bollinger BandsIndicator Overview
Purpose: The script calculates and plots Bollinger Bands, a technical analysis tool that shows price volatility by plotting:
A central moving average (basis line).
Upper and lower bands representing price deviation from the moving average.
Additional bands for a higher deviation threshold (3 standard deviations).
Customization: Users can customize:
The length of the moving average.
The type of moving average (e.g., SMA, EMA).
The price source (e.g., close price).
Standard deviation multipliers for the bands.
Fixed Time Frame: The script can use a fixed time frame (e.g., daily) for calculations, regardless of the chart's time frame.
Key Features
Moving Average Selection:
The user can select the type of moving average for the basis line:
Simple Moving Average (SMA)
Exponential Moving Average (EMA)
Smoothed Moving Average (SMMA/RMA)
Weighted Moving Average (WMA)
Volume Weighted Moving Average (VWMA)
Standard Deviation Multipliers:
Two multipliers are used:
Standard (default = 2.0): For the original Bollinger Bands.
Larger (default = 3.0): For additional bands.
Bands Calculation:
Basis Line: The selected moving average.
Upper Band: Basis + Standard Deviation.
Lower Band: Basis - Standard Deviation.
Additional Bands: Representing ±3 Standard Deviations.
Plots:
Plots the basis, upper, and lower bands.
Fills the area between the bands for visual clarity.
Plots and fills additional bands for ±3 Standard Deviations with lighter colors.
Alerts:
Generates an alert when the price enters the range between the 2nd and 3rd standard deviation bands.
The alert can be used to notify when price volatility increases significantly.
Background Highlighting:
Colors the chart background based on alert conditions:
Green if the price is above the basis line.
Red if the price is below the basis line.
Offset:
Adds an optional horizontal offset to the plots for fine-tuning their alignment.
How It Works
Input Parameters:
The user specifies settings such as moving average type, length, multipliers, and fixed time frame.
Calculations:
The script computes the basis (moving average) and standard deviations on the fixed time frame.
Bands are calculated using the basis and multipliers.
Plotting:
The basis line and upper/lower bands are plotted with distinct colors.
Additional 3 StdDev bands are plotted with lighter colors.
Alerts:
An alert condition is created when the price moves between the 2nd and 3rd standard deviation bands.
Visual Enhancements:
Chart background changes color dynamically based on the price’s position relative to the basis line and alert conditions.
Usage
This script is useful for traders who:
Want a detailed visualization of price volatility.
Use Bollinger Bands to identify breakout or mean-reversion trading opportunities.
Need alerts when the price enters specific volatility thresholds.

Adaptive bollinger bands cloud v1 trend & trade signalsadaptive bollinger bands cloud:
the script extends the concept of bollinger bands by creating a "cloud" between the upper and lower bands. this cloud visually represents market conditions, with its color dynamically adjusting based on trend strength and volatility.
the gradient fill between the bands changes according to the deviation of the price from its basis, offering a visual cue for trend momentum.
trend detection logic:
a trend variable determines whether the price is in a bullish, bearish, or neutral state. if the price is above the upper band and the basis, the trend is marked bullish. if it's below the lower band and the basis, the trend is bearish. otherwise, it's neutral.
this trend logic is further enhanced with visual markers like arrows to indicate potential trend reversals.
extended take-profit bands:
additional upper and lower bands are calculated using a higher multiplier. these extended bands help identify potential take-profit levels, signaling when the price may have reached an overextended state.
gradient calculation:
the script computes a gradient based on the deviation of the price from its basis and normalizes it over a lookback period. this normalized gradient is smoothed to reflect volatility intensity and used to color the cloud dynamically.
signal generation:
buy and sell signals are generated based on crossovers of the trend variable. for instance, when the trend shifts from negative to positive, it signals a bullish opportunity. conversely, a shift from positive to negative indicates bearish conditions.
take-profit markers ("x") are plotted when the price crosses the extended bands, suggesting potential exit points.
trade entry tracking:
the script includes a table to display real-time entry signals and prices for long (buy) or short (sell) trades. this feature helps traders keep track of signals without needing to reference the chart visually.
customizable inputs:
users can adjust the bb period, multiplier, and colors to suit their trading preferences. this flexibility allows for tuning the indicator based on different market conditions or asset classes.
overall, the indicator blends traditional bollinger bands with innovative visualization, trend identification, and trading signals to enhance decision-making.
how to use this indicator
trend detection:
watch for arrows indicating trend shifts:
an upward arrow (green) signals a bullish trend; consider buying or entering a long position.
a downward arrow (red) signals a bearish trend; consider selling or entering a short position.
use the gradient-colored cloud to assess trend strength:
bright and strong colors indicate significant momentum.
fading colors suggest weakening trends or consolidation.
entry signals:
refer to the table in the top-right corner of the chart for real-time buy or sell entry signals.
when a "buy" signal is displayed with the price, it suggests a potential entry point for a long trade.
when a "sell" signal is displayed, consider shorting or exiting long positions.
take-profit signals:
look for the "x" markers near the extended bands (upper1 and lower1):
an "x" above the price suggests taking profit on long positions.
an "x" below the price suggests taking profit on short positions.
background gradient analysis:
observe the dynamic background color:
a strong purple gradient indicates significant price movement or volatility.
a lighter gradient suggests reduced momentum, signaling caution or a potential reversal.
alerts for automation:
set alerts using the predefined conditions:
bullish trend start, bearish trend start, and take-profit levels can be used to automate notifications for trade actions.
why to use this indicator
enhanced decision-making:
the adaptive cloud and gradient provide visual insights into trend strength and volatility, allowing traders to assess market conditions at a glance.
precise signals:
the indicator uses crossover logic and extended bollinger bands to generate clear buy, sell, and take-profit signals, reducing guesswork.
trend confirmation:
combining the bollinger bands with the trend variable ensures that traders only act on confirmed market trends rather than noise.
dynamic volatility assessment:
the normalized gradient calculation highlights periods of high or low volatility, helping traders adjust their strategies accordingly.
customizable settings:
adjustable parameters (period, multiplier, colors) allow the indicator to fit various markets, timeframes, and trading styles.
all-in-one tool:
integrates trend detection, entry signals, and take-profit levels into a single indicator, minimizing the need for multiple tools.
this indicator is especially useful for traders seeking a balance between simplicity and precision, whether scalping, day trading, or swing trading. it not only identifies trends but also highlights actionable entry and exit points, making it a versatile addition to any trading strategy.

BBPCT For Loop | viResearchBBPCT For Loop | viResearch
Conceptual Foundation and Innovation
The "BBPCT For Loop" script is designed to combine Bollinger Bands with a percentage calculation to identify market trends and mean reversion opportunities. Bollinger Bands Percentage (BBPCT) evaluates where the current price stands between the upper and lower bands of Bollinger Bands, providing a more dynamic view of price extremes. This script incorporates a loop-based scoring mechanism that further refines the analysis, giving traders a clearer indication of potential trend shifts or reversion zones.
By incorporating both the BBPCT and a for-loop system, this indicator enhances the ability to spot overbought or oversold conditions, helping traders make more informed decisions based on market momentum.
Technical Composition and Calculation
The "BBPCT For Loop" script uses Bollinger Bands to establish dynamic upper and lower boundaries around price, calculated using standard deviation. Here’s how the core components are structured:
Bollinger Bands Percentage (BBPCT): BBPCT calculates the position of the price relative to the upper and lower Bollinger Bands. This creates a percentage range from 0% to 100%, with values near 0% indicating proximity to the lower band (potentially oversold) and values near 100% signaling closeness to the upper band (potentially overbought).
For-Loop Scoring System: The script employs a loop that iterates over a range of values. For each value, it evaluates whether the BBPCT is above or below a threshold, adjusting the score accordingly. This scoring mechanism helps detect when price action is shifting toward a bullish or bearish trend.
Mean Reversion Zones: The script defines specific "green" and "red" zones based on the BBPCT value. These zones visually highlight potential mean reversion areas where price may reverse direction.
Features and User Inputs
This script offers a variety of customizable inputs that allow traders to fine-tune it for different market conditions:
BBPCT Length: Controls the lookback period for calculating the Bollinger Bands. Adjusting this period affects how reactive the indicator is to price changes.
Standard Deviation Multiplier: This input adjusts the width of the Bollinger Bands, influencing the sensitivity of the BBPCT calculation.
Thresholds: The script includes user-defined thresholds for detecting uptrends and downtrends based on the BBPCT score. Traders can adjust these thresholds to make the indicator more or less sensitive to market shifts.
Bar Coloring: The script optionally colors bars based on detected trends, providing a visual cue for potential bullish or bearish conditions.
Alerts: Alerts are triggered when the BBPCT crosses above or below the user-defined thresholds, notifying traders of potential long or short opportunities.
Practical Applications
The "BBPCT For Loop" script is ideal for traders who employ mean reversion or trend-following strategies. Its application can be particularly effective in:
Spotting Overbought and Oversold Conditions: The BBPCT provides a dynamic measure of where the price is within the Bollinger Bands, helping to detect when the market is approaching an extreme, signaling potential reversion opportunities.
Confirming Trend Shifts: The for-loop scoring mechanism offers a more detailed analysis of whether the market is entering an uptrend or downtrend, helping traders to time their entries or exits more effectively.
Mean Reversion Trading: The inclusion of green and red zones helps highlight areas where the price may be more likely to revert to the mean, providing valuable insight for mean reversion traders.
Advantages and Strategic Value
This script enhances the traditional Bollinger Bands indicator by introducing a loop-based scoring system and mean reversion zones. These additions make the indicator more versatile and adaptable to various trading styles. By dynamically adjusting to market conditions, the BBPCT For Loop helps reduce the risk of false signals and improves the accuracy of identifying overbought or oversold conditions.
Summary and Usage Tips
The "BBPCT For Loop" script is a powerful tool that combines the flexibility of Bollinger Bands with a robust scoring system. Traders can use it to identify overbought or oversold conditions, confirm trend shifts, and improve the timing of trades. Adjust the Bollinger Bands length and standard deviation multiplier based on the asset you're trading to get the best results.
Remember to test the script across different market conditions and timeframes to understand how it performs. Backtests are essential for gauging its effectiveness, but keep in mind that past performance does not guarantee future results.

Bollinger Bands Fast Trend Indicator [DCD]Description:
The Bollinger Bands Fast Trend Detector indicator is an advanced tool designed to provide traders with more precise trend detection and clearer entry and exit signals. This script builds upon the traditional Bollinger Bands indicator by adding customizable standard deviations and incorporating multiple moving averages to enhance the accuracy of the signals.
Main Features:
1. **Customizable Bollinger Bands**:
- Each Bollinger Band has its own standard deviation setting, allowing for more granular control and better trend detection.
- The short Bollinger Band is set to a 10-period SMA for faster trend recognition.
2. **Multiple Moving Averages**:
- The indicator includes several types of moving averages (SMA, EMA, LSMA, HMA, WMA) applied to the Bollinger Trend value, giving traders flexibility to choose the best fit for their strategy.
3. **Crossover and Crossdown Detection**:
- The script identifies crossover and crossdown points between the Bollinger Trend value and the selected moving average, marking potential buy and sell signals with green and red circles, respectively.
4. **Color-Coded Histogram**:
- The histogram bars are color-coded to indicate the strength and direction of the trend, making it easy to visualize market conditions at a glance.
Instructions:
1. **Adding the Script to Your Chart**:
- Open your TradingView chart and add the Bollinger Bands Fast Trend Detector indicator.
2. **Adjusting Parameters**:
- Customize the Bollinger Bands and moving average settings according to your trading preferences:
- `Short BB Length` (default: 10): Adjusts the length of the short Bollinger Band.
- `Long BB Length` (default: 50): Adjusts the length of the long Bollinger Band.
- `StdDev` (for both bands): Sets the standard deviation multiplier.
- `Moving Average Type`: Choose between SMA, EMA, LSMA, HMA, and WMA.
- `Moving Average Length` (default: 14): Sets the length of the moving average.
3. **Interpreting the Output**:
- Observe the BBTrend and moving average plots on your chart.
- Look for green circles indicating crossover points (potential buy signals) and red circles indicating crossdown points (potential sell signals).
- Use the color-coded histogram bars to assess the strength and direction of the trend.
Configurable Parameters:
- `shortLengthInput` (default: 10): Length of the short Bollinger Band.
- `longLengthInput` (default: 50): Length of the long Bollinger Band.
- `shortDevMultInput` (default: 1.0): Standard deviation multiplier for the short Bollinger Band.
- `longDevMultInput` (default: 2.0): Standard deviation multiplier for the long Bollinger Band.
- `maTypeInput` (default: SMA): Type of moving average (options: SMA, EMA, LSMA, HMA, WMA).
- `maLengthInput` (default: 14): Length of the moving average.
Code Explanation:
The script calculates two sets of Bollinger Bands with distinct lengths and standard deviations. The difference between the lower bands and upper bands is normalized by the short middle band to compute the BBTrend value. A selected moving average is then applied to this BBTrend value. The script plots the BBTrend, the moving average, and uses color-coded histogram bars to represent trend strength and direction. It also identifies and marks crossover and crossdown points to provide potential trading signals.
Disclaimer:
This script is for educational purposes only and should not be considered financial advice. Always perform your own analysis before making any trading decisions.
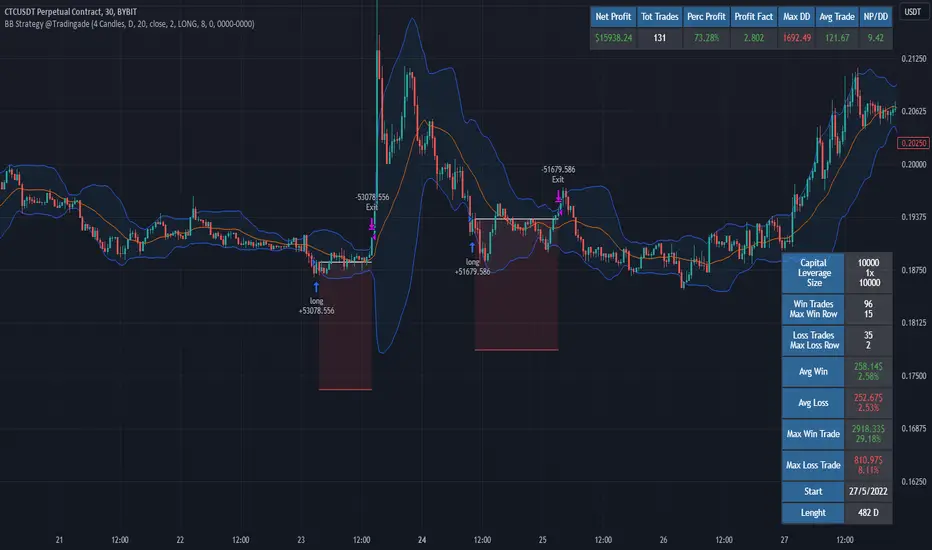
Filtered Bollinger Bands By @TradingadeThis is a reversal strategy based on Bollinger Bands combined with a Trend filter.
The most important part of this strategy is the Trend filter. When applied, it will increase the likelihood of confirming an exhausted movement (it will help find the maximum "elastic bent"), and may reduce chances of getting bad entries condition.
The logic of this code is:
Enter Long : price goes outside lower band, then close cross above lower band
Stop Loss : Percentage %
Take profit : Percentage %
Exit Cond : when high crosses above upper band. It could be both in profit or in loss.
Filter: Yesterday low was the lowest in previous X days
Enter Short : price goes outside lower band, then close cross above lower band
Stop Loss : Percentage %
Take profit : Percentage %
Exit Cond : when low crosses below lower band. It could be both in profit or in loss.
Filter: Yesterday high was the highest in previous X days
FILTER Notes:
You could switch both timeframe and N. of candles in input section. Even tough generally daily data are more reliable, you could find interesting to change it to 1H tf, so filter would be:
"1H high/low was the lowest/highest in previous X hours"
EXIT Notes:
Please note that "% exits" will always override "Exit Cond".
Set % exits to 0 if you want to exit only by "Exit Cond".
Settings used to get the results below :
Initial Capital = 10000
Order Size = 10000 USDT
Commission = 0.06 %
TREND FILTER
Trend filter = True
Trend intensity = 4 Candles , TF 1 day
BB FILTER
Lenght = 20
Source = Close
StdDev = 2
STRATEGY SETTINGS
Position Side = LONG
Stop Loss % = 8
Take Profit % = 0
Exit Cond = True
find bulish patternsIn this script:
We continue to calculate the bullish engulfing condition for monthly candlesticks (engulfingConditionM) as before.
We then create two variables (engulfingConditionY and lastYear) to calculate the yearly engulfing condition.
We use an if statement to check if the year has changed compared to the previous bar. If it has, we update the engulfingConditionY variable; otherwise, we keep the previous year's value.
Finally, we plot the monthly and yearly signals on the chart.
This code allows you to work with monthly data and calculate yearly signals based on the monthly data available in TradingView. Please note that this is an approximation and not true yearly resolution data, but it's a common workaround used in TradingView Pine Script.

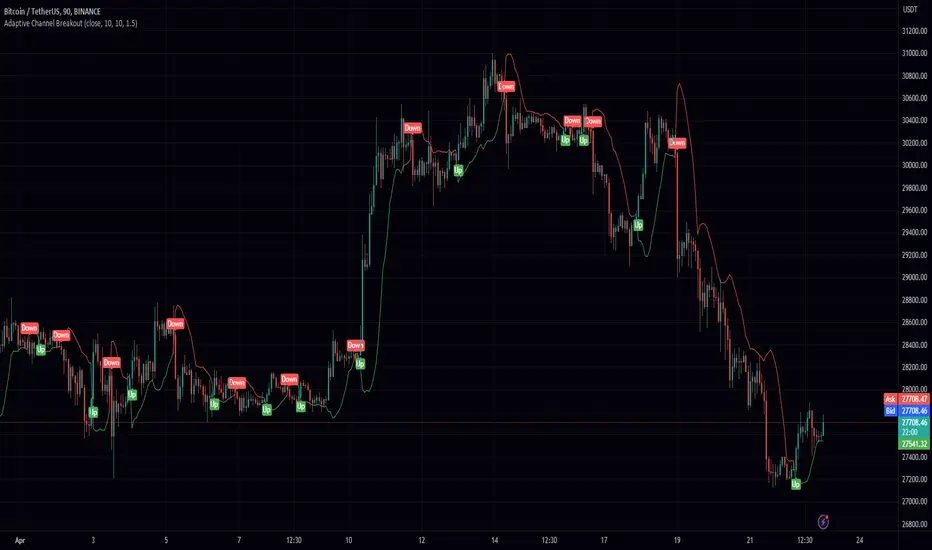
Adaptive Channel BreakoutIntroducing the "Adaptive Channel Breakout" indicator, an advanced charting tool that employs the acb function from the PeacefulIndicators library. This powerful indicator helps traders detect potential breakouts and trends by displaying an adaptive channel on the chart.
Key features of the Adaptive Channel Breakout indicator include:
Customizable input parameters: Adjust the moving average length, volatility length, and multiplier to suit your trading preferences and strategy.
Utilizes the acb function from the PeacefulIndicators library, which calculates the adaptive channel using a simple moving average (SMA) and standard deviation to measure volatility. The function also tracks the trend direction based on price crossovers and crossunders.
Clear visual representation: The adaptive channel is displayed as a linebr plot, with the color indicating the current trend direction (green for uptrends and red for downtrends).
Trend signals: The indicator includes up and down arrow labels that signify potential trend reversals, providing traders with valuable entry and exit points.
Overlay functionality: Designed to be displayed directly on the price chart for easy analysis and correlation with price action.
To use the Adaptive Channel Breakout indicator, simply add the script to your chart and customize the input parameters as needed.
Average Deviation Bands (ADB)The Average Deviation Bands indicator is a technical analysis tool that plots multiple bands around the average price of an asset. These bands are calculated using the standard deviation of the asset's price over a specified time period, as well as the average price of the asset over the same period. However, it's important to note that the standard deviation is only calculated for the specified time period leading up to the current point in the data set. The indicator then takes the average of all of these standard deviation values to plot the bands. The number and width of the bands can be customized by the user. The bands can be used to identify potential trend changes and to assess the volatility of the asset. The indicator is often used in combination with other technical analysis tools to provide a more complete picture of market conditions.

Bolinger Band AnalysisBollinger Band Analysis
Objective - Use for entry action filter
Description - Bollinger Band Analysis Indicator is the introduction of value between basis moving average with standard deviation value
Applications - The principle of Bollinger Band Analysis Indicator is to use it as an order action filter when the value of the Bollinger Band under moving average by itself.
Recommendation - Bollinger Band Analysis should be used in conjunction with indicators used to filter trend. for example supertrend, parabolic sar

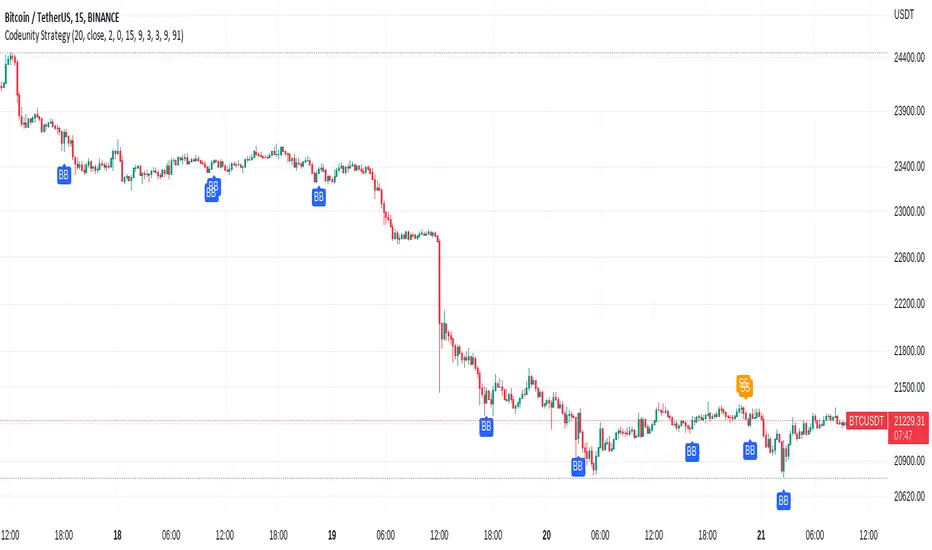
Code Unity 1.0Bitcoin 15 minutes strategy.
Bitcoin 15 minutes strategy.
Bitcoin 15 minutes strategy.
Bitcoin 15 minutes strategy.
Bitcoin 15 minutes strategy.
Gab EMA + rsi + bbscrypt I made for a friend
you are welcome bro ;)
simple strategy
BB Default
RSI 3
200 ema
200 EMA gives the trend direction.
if RSI is over bought and candle touch BB upper band then there will be buy entry. (Price must be above 200 ema)
If RSI is over sold and price touch bb lower band then there will be sell entry. (Price must be below the 200 ema)
SL will be 1 ATR of the entry candle. Tp will 2:1.
***Missing TP and SL values
Bollinger but BetterA better Bollinger Band with an average of 20 EMAs as pivot price, which makes its standard deviation way more sensitive compared to traditional Bollinger Band.
-- My Tips --
Long flat convergence suggests a big potential price movement.
Short quick convergence of short supportive ema(default: 10days) and upper band suggests a safe middle entry point.
Recommended auxiliary indicator: Wavetrend by Lazybear, which points out entry and exit points quite accurately in bull market.
-- PS --
This system is a hybrid of EMA Ribbons and Bollinger Band.