Bollinger Bands with Ema and Two DeviationBollinger Bands with Ema calculation. Based on high and low valus of candle. Also can be used two deviation for both upper and lower bands.
Cari dalam skrip untuk "bollingerband"
B.Bands | Augmented | Intra-range | Long-OnlyHere you have the essential trading engine based on Bollinger Bands .
The idea behind is to trade the intra-range of the bands.
How is going to work?
Define which Bollinger Bands we want to use. Classic Bollinger Bands or Augmented Bollinger Bands . Without selecting, the algorithm doesn't show a strategy.
Define the length of the Moving Average and the Standard Deviation by default the classic 20-2.
Define the Bollinger Bands Spread Max Range (Upper-Lower) to be able to determine wheter or not you're in a price range or potential breakout.
Define data source to trigger exit and entry points.
Define profit based on Middle Band or Opposite Band.
Define Stop Loss % and activate Trailing Stop if desired with the percentage required.
Determine if you want to sell only on profit after triggering the entry signal. * Note Stop Loss remains activated.
Choose a date range if you want to study a specific period.
Bear in mind, this is the essential trading engine, open for you to test, try and improve under your requirements. You can determinate when is the ideal market to implement it based on many other indicators. Maybe you wish to change the stop loss settings for ATR, previous low, etc. Totally up to you.
Note the script comes with initial capital, fee % and slippage by deault. This may change for your assets. Make sure you define it in advance.
NOTE: If you trade assets such BTC, you must update the initial capital. By default 5000 (USD) The script doesn't support fraction trading such 0.01BTC.
Will be updated on next version.
Feel free to get in touch if you've got any question.

BB%B StratSimple strategy to go long when price is below a bollinger band %B threshold, or go short when above a threshold.
Trades are closed when BB%B moves back to an opposite threshold.
Intended to be a relatively short time frame trade, usually only a few candles, and probably better on high time frames.

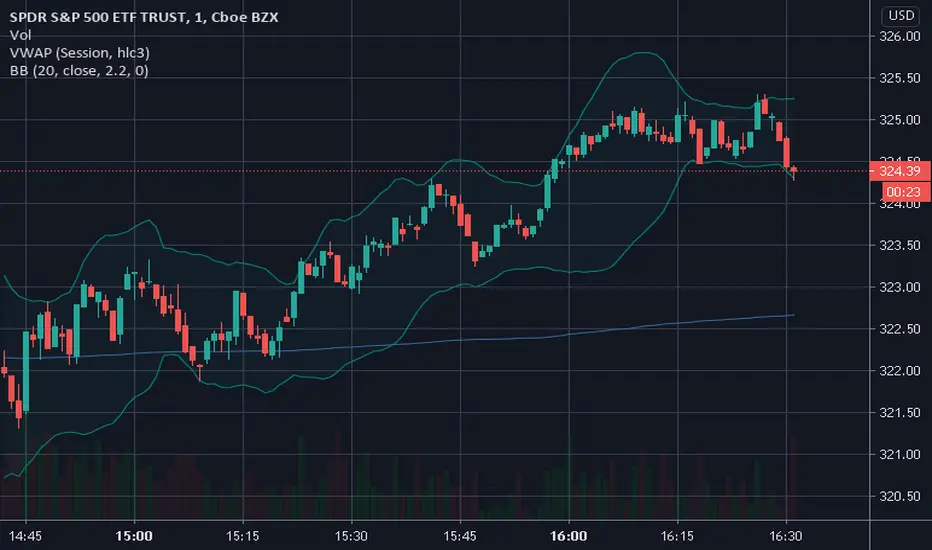
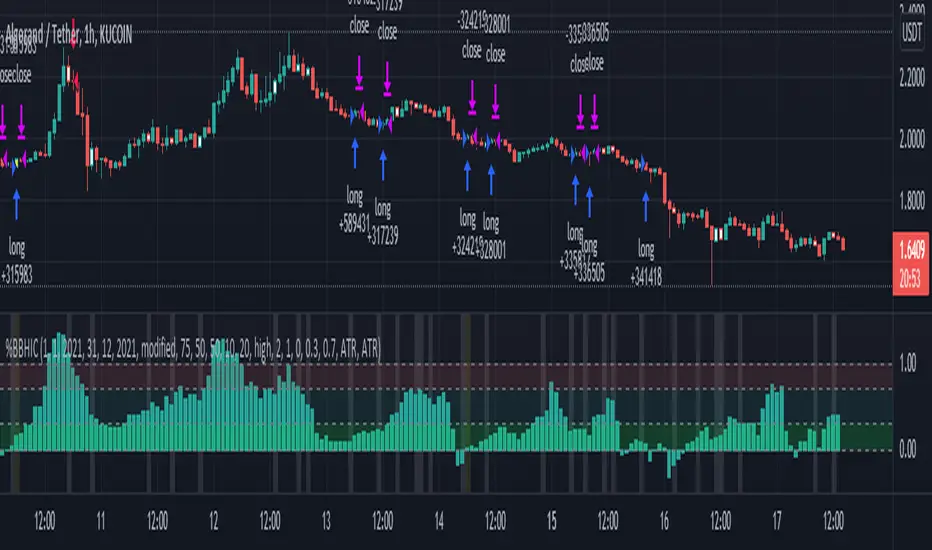
Bollinger Bands %B - Belt Holds & Inner CandlesThis is a simple strategy that uses Bollinger Bands %B represented as a histogram combined with Candle Beltholds and Inside candles for entry signals, and combines this with "buy" and "sell" zones of the %B indicator, to buy and sell based on the zones you set.
How to use:
Long when in the green zone and an inside candle (which is highlighted in white) or a bullish belt hold (which is highlighted in yellow), and sell when inside a red zone and has an inside candle or a bearish belt hold (which is highlighted in purple) or the stop loss or take profit is hit.
Short when in the red zone and an inside candle (which is highlighted in white) or a bearish belt hold (which is highlighted in purple), and sell when inside a green zone and has an inside candle or a bullish belt hold (which is highlighted in yellow) or the stop loss or take profit is hit.
Stop loss / take profit selection:
Choose which performs best for you, ATR based uses the average true range, and % based is based on a set percent of loss or profit.
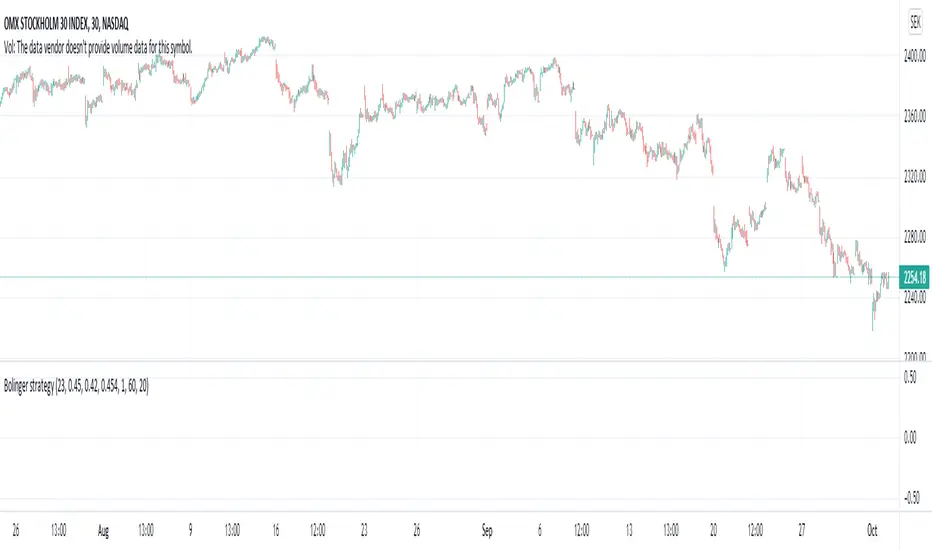
Bolinger strategy v1 openFind lows based on divergence on bollinger bands .
Works great on stocks and index, no success on forex.
Different stock/index requires different values.
Exit is not perfect, often on the safer side.
Example settings: NASDAQ:OMXS30, 30m: 25 0.452 0.42 0.453 2 62 20
Lower bbrower = buys harder dips, too low will cause buy during fall.
Higher bbrhigher = buys on lower dips
One of my first scripts, so code is not pretty
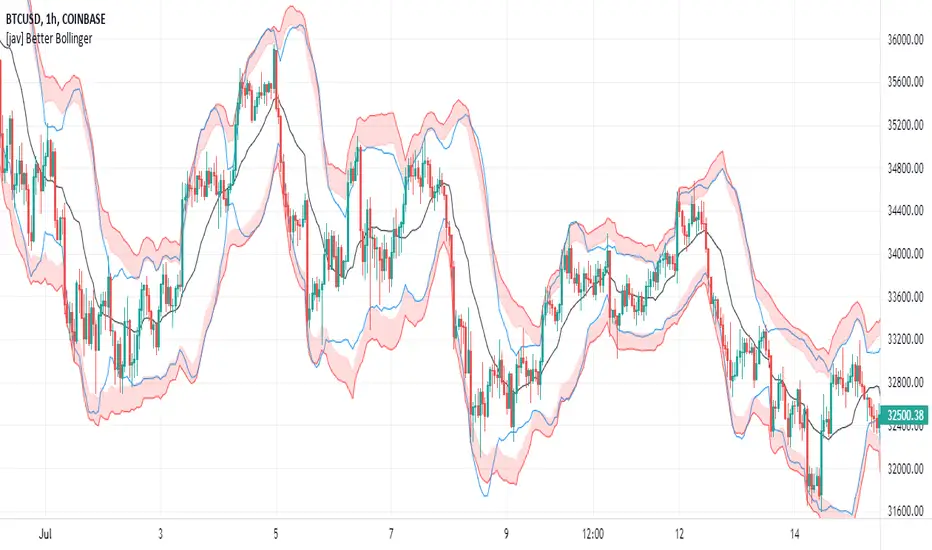
[jav] Better Bollinger BandsBetter Bollinger Bands (BBB)
This script is a modification of classic Bollinger Bands (BB).
CHARACTERISTICS
Main improvement over BB:
There is no need to introduce a standard deviation multiplier (usually 2).
Here, only a length is needed (usually 20 bars for BB).
Other features:
The type of moving average can be selected: sma, ema, vwma, wma or rma.
An inner band is plotted as an additional indication of approaching extreme levels.
Classic BB can also be shown on the graph for the sake of comparison.
CALCULATIONS
The calculation of BBB is done by adding three different contributions:
Standard deviation of price
Standard deviation of (price minus moving average)
Average of (high - low) over length.
RESULTS
It looks like BBB follows prices more smoothly (without the typical overshoots of BB). Also, it fits extreme values with higher accuracy. Finally, usually it doesn't cross through prices at less relevant, intermediate higher highs or lower lows, which can be advantageous.
See the comparison between red BBB vs blue BB:
Both vwma and ema seem to give decent BBB values using the standard length of 20 bars.
2 Length Bollinger BandsThis indicator is a two length Bollinger Band implementation. It uses the Simple Moving Average, and adjusts to the period you are looking at: e.g. if you are looking at the day chart, periods are in days. If you are looking at the 5 minute chart, periods are within 5 minute increments.
The foregrounded set of bands is based on the 20 length SMA. So, in the case of the day chart, the successive bands from the middle are 1, 2, 2.5, and 3 standard deviations from the midline (which is a dotted orange line). The upper 2.5 and 3 stddev band is orange and red respectively. When the price gets up into these regions it could indicate a potential sell or short opportunity. The lower 2.5 and 3 stddev bands are colored with lime and green,when the price goes into these regions it indicates a potential buy opportunity.
The backgrounded set of bands is based on the 50 length SMA. So, in the case of the day chart, the successive bands from the middle are 1, 2, 2.5, and 3 standard deviations from the midline (which is a dotted purple line). It is intentionally more transparent so as to be seen as a slower background trend, so that the foreground bands (based on the 20 length SMA) can be interpreted within a developing context based on consideration of the slower period.
There are many other things to consider with Bollinger Bands, such as the 'squeeze' when the bands get narrow, which is often followed by a 'squeeze' up or down. It is best to consider BBs alongside other indicators (leading & lagging) and with consideration of volume in order to confirm or invalidate your thesis before making a trade.

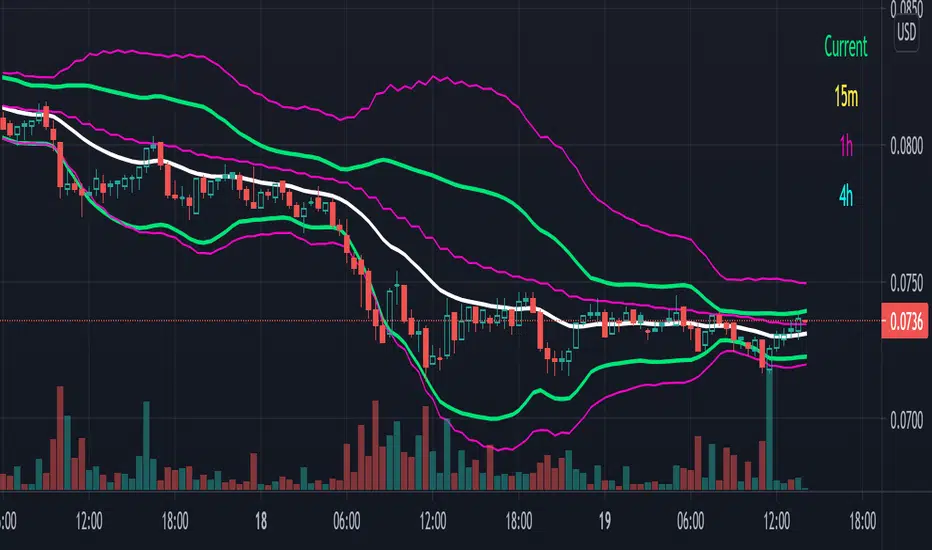
Multiple Timeframe Bollinger Bands - 15m, 1h, 4h plus currentI could not find any other indicator that does this on TradingView. I like to trade whilst looking at multiple time frames and on my desktop I can do that because I have three monitors. I went on vacation recently and I had to trade using my laptop. It sucked tabbing back and forth so I wrote this script.
I personally trade on a 1m chart with indicator data from longer charts so I get the fastest resolution possible. TradingView's horrid and useless idea posting algorithm won't let me post this script in that way so here's a 30 minute chart for posterity.
By default it shows only the time frame you are on but you can use the gear icon on the indicator to turn on 15 minute, 1 hour or 4 hour Bollinger bands. There is a color coded guide on the upper right hand side (yay for the new table feature) so you can see what you are getting yourself into. I have 1h bands and current frame (30m) bands on in the picture.
Use this on a fast chart with slower bands applied. It doesn't work all that well when you use it on a longer time frame with faster bands applied. I use this one a 1m or 5m chart with 15m and either 1h or 4h bands applied typically.
I am making use of this available for free though if you want my code to make adjustments it is available for a small donation to cover my development time; PM me if you are interested. My best bot strategies have all been based on this script so if you want to use this as a jumping off point for your Bollinger band-based strategies this will work well though you do need to buy the code from me for that.
Multiple Timeframe Fib Bollinger Bands - can be used for 3commas*** This idea is based on Bollingers Bands Fibonacci ratios by Shizaru ()
** This will look less chaotic if you don't have all four time frames on at once! I left them on for the demo picture just to show them all simultaneously working.
This is the basis for most of my bot ideas - indicators from longer chart time frames laid over short time frame charts. What I mean by this is that I like the responsiveness of a 1m chart but indicators from a 1h or 4h chart. There are obviously downsides to doing this or everyone would do it, but I have consistently gotten top results using this method. This is a study, so not a strategy yet but you can use this with 3commas if you convert it to a strategy using band crossover/under points as buy and sell triggers.
That is super easy; just follow this excellent guide here which should work for this script:
kodify.net
It's not super hard if you know a little Pine but if you need help hit me up and we can figure something out.
This script by default has 15m, 30m, 1h and 4h settings that are configurable via the gear icon. You can enable or disable any time frame, change the color, etc. I will probably add accurate line labels, custom time frames and adjustable transparency soon.
It's advisable to use higher time frame indicator on a lower time frame chart, but not the other way around. I would use these indicators on a 1m chart but not a 1d chart, for example.
Have fun and I hope you get some use out of this! I use it for context more than bots but it is definitely possible to use it with both.

Bollinger Blast Buy Unholy GrailThis strategy copy the Nick Radge's trading ideas for a profitable systems. He mentions a Bollinger Band idea which is also published in his book Unholy Grails. Nick says:
he strategy that we did test and showed very promising results was an entry using a Bollinger band and an exit using the opposite Bollinger band, but we use 3 standard deviations for the entry and 1 standard deviation for the exit, just to keep the trailing stop a little bit tighter.”
Entry: Buy on the Open the day after a stock closes above the top Bollinger Band
Exit: Exit on the Open the day after a stock closes below the lower Bollinger Band
Results tested on Nasdaq market are very good and better than simply buy& hold

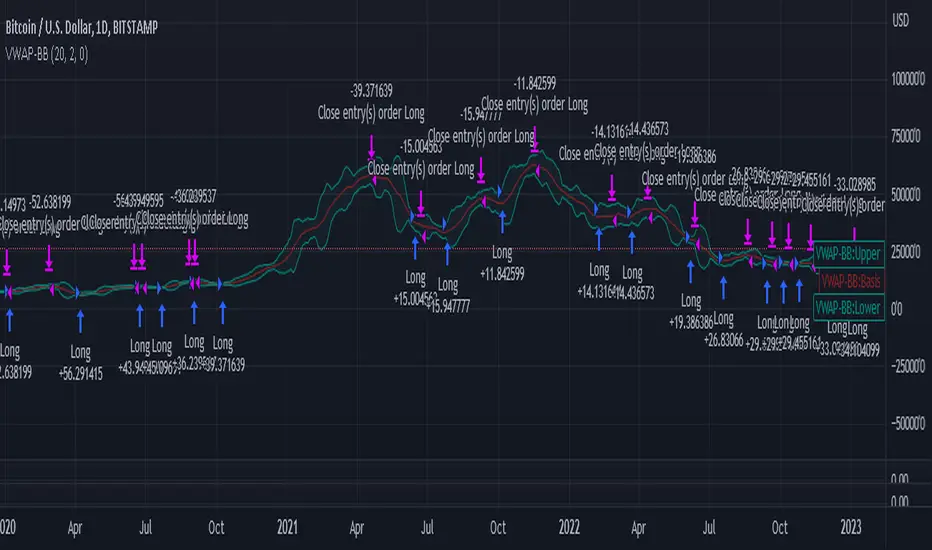
VWAP-Bollinger BandsThis script uses Bollinger bands but with a VWAP as the source, it uses the high crossing the upper band as a buy signal and a low crossing the lower band as a sell signal
Its default settings are for a day chart - Crypto 30 periods, forex 24 periods and stocks 20 periods, which basically line up with a month per asset class
ive seen good results in crypto and stocks, settings used between1% and 10% equity per trade with a 0.1% fee which lines up with Binance fee structure and $25 per trade which lines up with Commsec on the ASX
SMA&BOLL脚本用来将sma和布林带统一呈现, 方便及时捕捉价格的走势与波动区间. 只要简单地修改SMA的两条线, 布林带的中间线同时作为SMA的第三条长周期参考线也作为布林带的基础计算曲线, 一线双用节省资源.
The script is used to present the sma and Bollinger bands in a unified manner, which is convenient to capture the price trend and fluctuation range in time. Just simply modify the two lines of the SMA, and the middle line of the Bollinger bands serves as the third long-period reference line of the SMA and also serves as the Bollinger bands The basic calculation curve, one-line dual-use saves resources.

6 Bollinger Bands (1.5 thru 4)20 period SMA Bollinger Bands with the following standard deviations: 1.5 2 2.5 3 3.5 4

Cosmic Bands4 Bollinger Band channels with StdDev mult values of 1, 2, 4, and 4.5 (the last value can be changed in the indicator's settings).
Often shows better correlation with the log setting on.

Bollinger Bands With Squeeze [Nic]Bollinger bands with color indicators to detect two key scenarios :
- The squeeze (yellow) detects a potential breakout (or down) in price volatility.
- The extreme overbought / over sold conditions. This happens during a 'band ride'.
"There is nothing more beautiful than when a stock becomes overbought, and stays overbought" - John Bollinger

Bollinger Bands - Custom moving averageFormula for bollinger bands is as below:
Mid = sma(20)
Top = sma(20) + 2*StdDev(20)
Bottom = sma(20) - 2*StdDev(20)
While standard bollinger bands allow changing standard deviation and length, there is no option to use different moving average.
This indicator allows you to define bollinger bands based on different moving average types which can be selected from input.

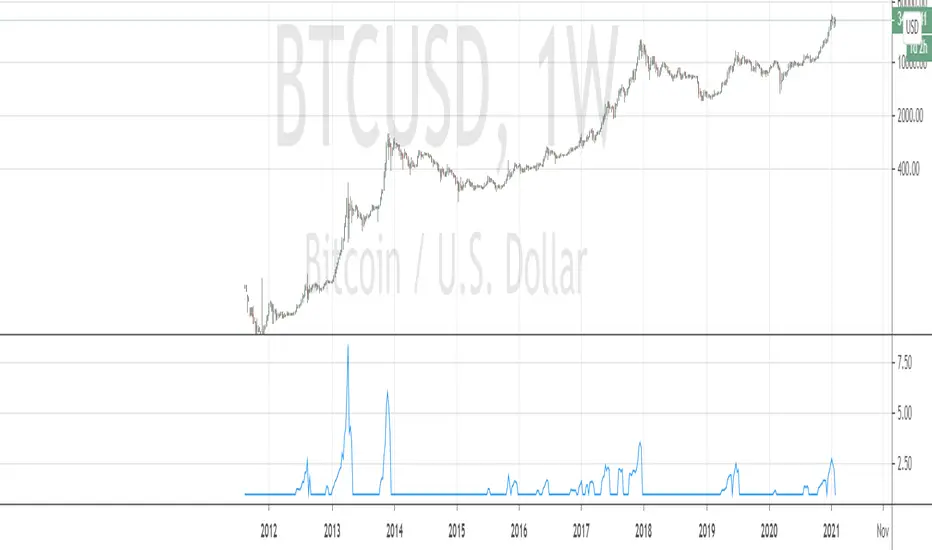
Bitcoin Bubble Strength IndexFor those who interested, here is a Bitcoin Strength Index source code. I used it on weekly chart with params (close,28). And only with Bitcoin . And only during bull run. It shows how far price went off the particular moving average during bubble run (i.e. being above BB). Weekly MA 28 is approximately daily ma 200.
The physical meaning of this indicator is to show current bull rally "speed".
Bollinger Bands Width %bAs the bottom reading of BBW changes dynamically with bull market progression, a relative bottom is preferred than absolute, hence normalization of BB Width via bollinger bands and %b, i.e. distance of datapoints from stdev band.

BBliciousStandard Bollinger Band with :
- BB with 1 Standard Dev
- BB with 1.5 Standard Dev
- BB with 2..5 Standard Dev
Top and Bottom Ribbon Color Area
- Fill Area between Standard Dev 1 and 1.5 ( Top & Bottom )

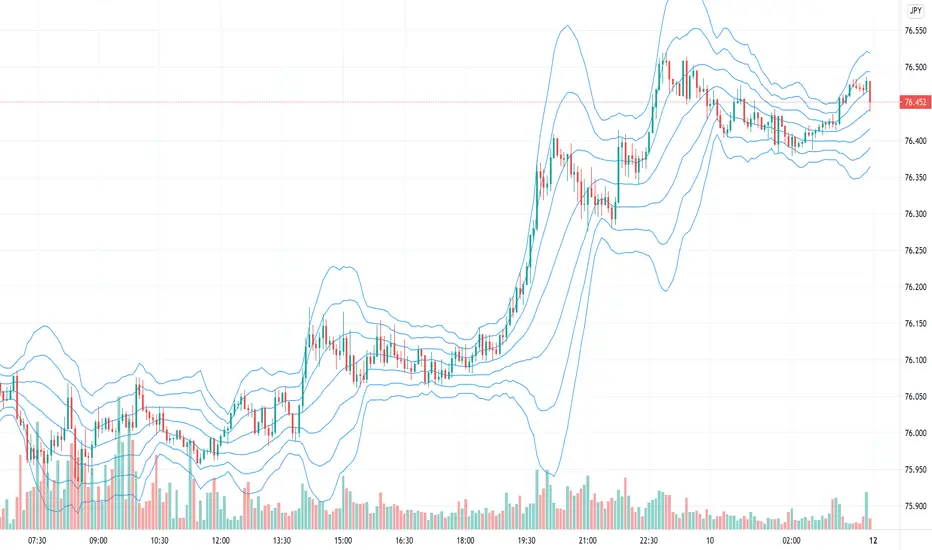
Bollinger bands on 1M/5M/15M chart onlyJapanese below. 日本語の説明は下記
This is Bollinger bands that is shown only on 1M, 5M and 15M charts only.
I Sometimes refer to Bollinger bands when I try to identify specific entry point on lower timeframe especially on 5M, whereas I do not want Bollinger bands to be shown up on other timeframes as they become noise...
This is why I removed Bollinger bands from 1 hour and upper timeframes.
——————————————————————————————
1分足、5分足、15分足のみに表示されるボリンジャーバンドのインジケーターです。
1分足や5分足でエントリーのタイミングを計るときにはボリンジャーバンドを使うことがあるのですが、1時間足以上では特に参照しないため、チャートに表示しないよう制御を加えました。
±1〜3シグマのバンド及びミドルラインとしてSMAを設定可能です。
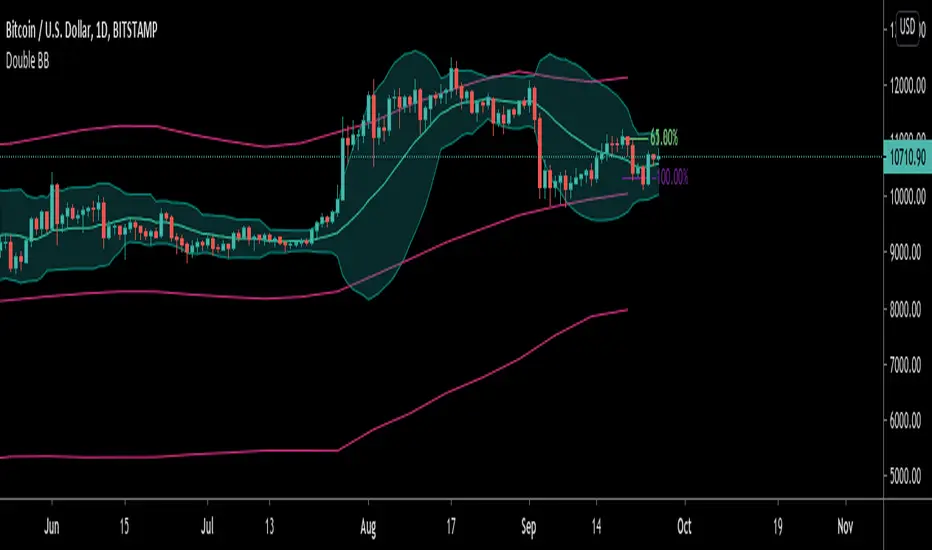
Bollinger Band x2Double BB with different deviation
bb1: 34, 2
bb2. 34. 2.5.
Las bb se pueden configurar