Trendstone Volatility Adjusted Bands v1.0The idea of the indicator is to show overbought and oversold situations. Whenever something moves outside of the middle channel to any of the R bands, the prices tend to stage violent counter-moves. Can be used for long term flags using 2h to 4h values or short-term swings with 5m to 45m.
Cari dalam skrip untuk "bollingerband"
ATOM Bollinger
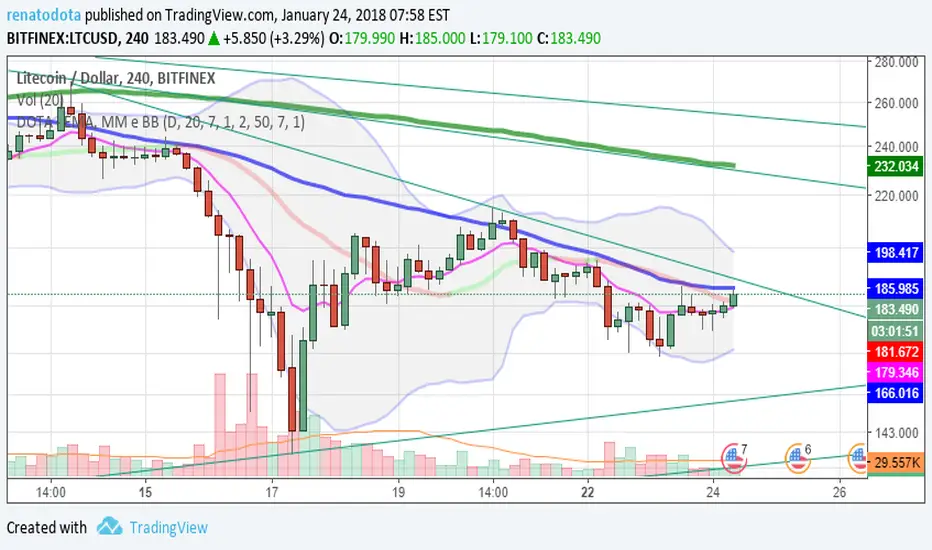
This is Bollinger band indicator. Default value is set at length 20 with 1 Standard Deviation (Narrow)
Upper and Lower Band is filled with blue color to indicate volatility of price movement
Line chart is represent price movement. Decision to buy/sell is as following :-
1 - Potential Buy - Price Line turned Green crossed above upper Band.
2 - Potential Sell - Price Line turned Red crossed below lower Band.
Note : Price breakout from narrow band normally result in rally.
The longer duration of narrow band will result in stronger rally after breakout
Note : Best use with "EMA Indicators with BUY sell Signal"
Lognormal Bollinger BandsThe standard Bolling Bands assumes a normal distribution. However, a normal distribution is an incorrect model for stock prices. This is because stock prices cannot fall below zero. If we assume that the percentage return follows a normal distribution, then a lognormal distribution is a more accurate model.
This is why I've transformed the standard deviation using the log function. It's much more useful for stock prices that have a low value and high volatility.
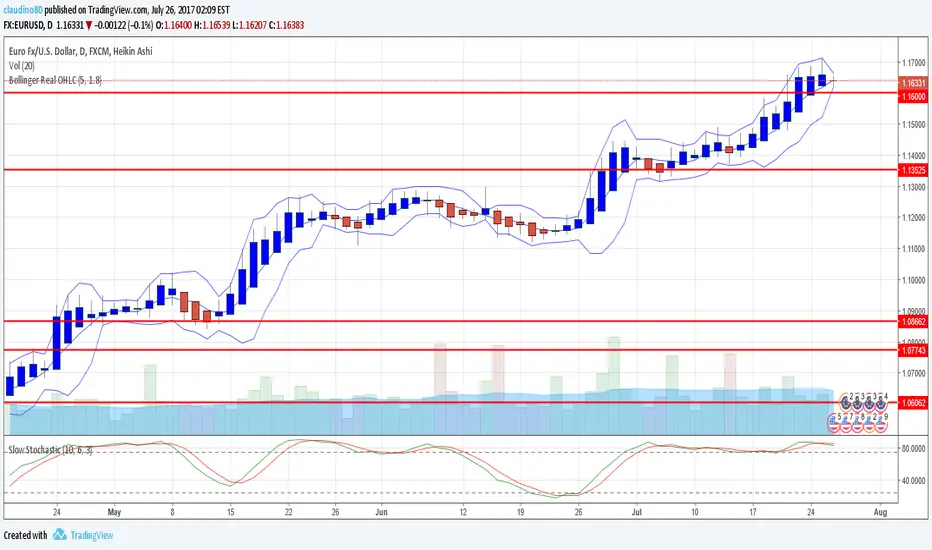
Bollinger Real OHLCThis uses the real OHLC not the one of the chart (useful for not standard chat like Heikin Ashi).
VDUB BB %B REVERSAL_v1VDUB BB %B REVERSAL_v1
* i am un able to highlight back ground, so I've merged std & custom together
std & on chart BB settings -
21 / 1.8
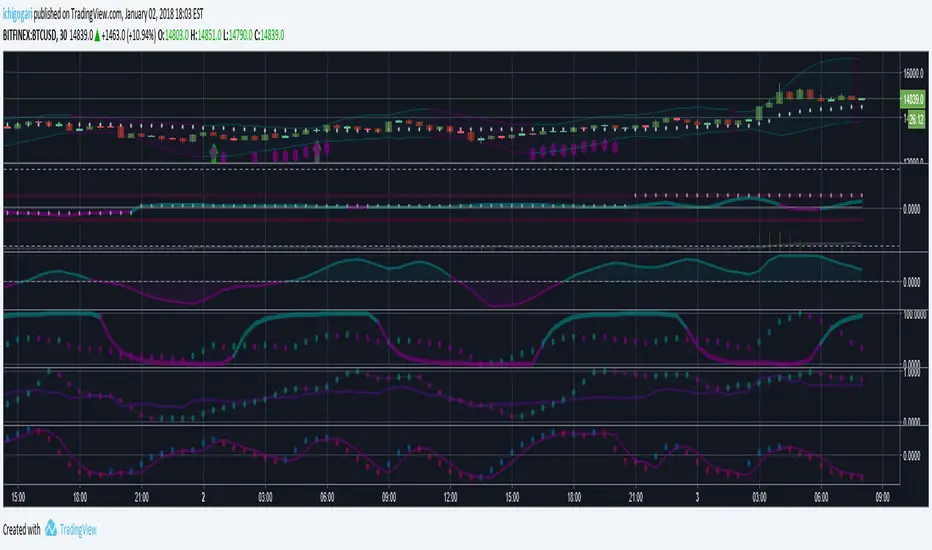
Strategy CCT Bollinger Band OscillatorThis strategy buy when ema crossover CCT BB oscillator and sell when crossunder. No SL neither TP only trailling stop at 1$. CCT BB oscillator is LaztBear indicator. Thanks to him.
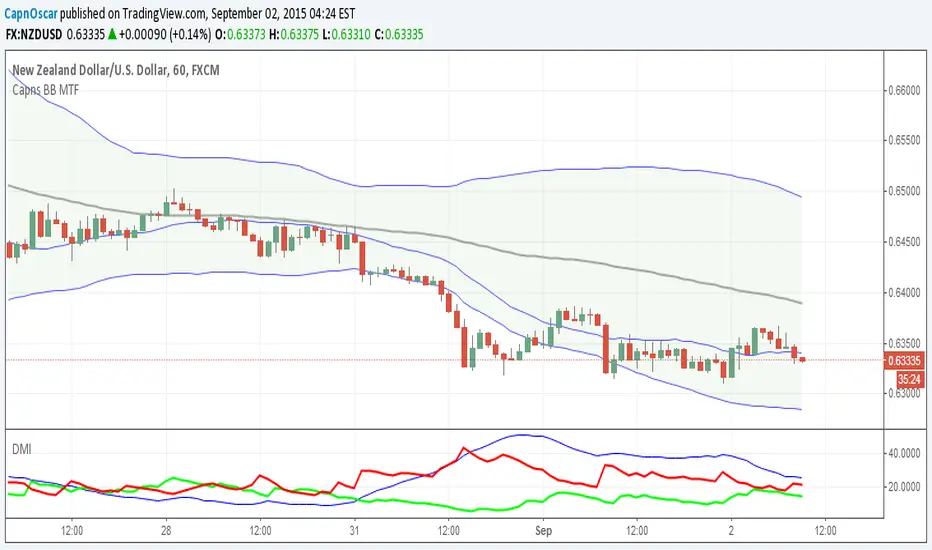
Capns Bollinger Bands MTF This Simple Script display higher time frame Bollinger Band on current resolution . Etc : On 1 Minutes chart BB Band is 5 Minutes Band. I use this code on my pc for scalping...Hope You like the idea
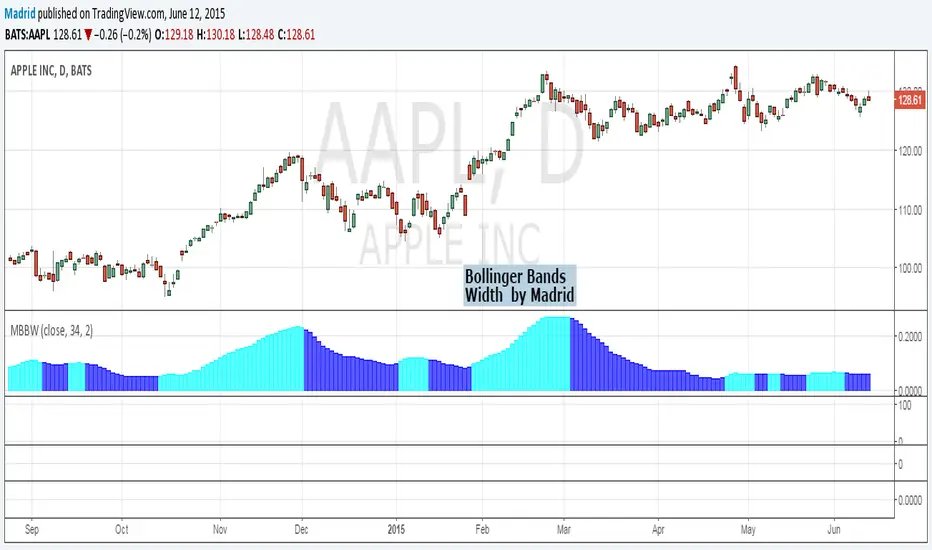
Madrid Bollinger Bands WidthThe contractions and expansions of the bands are represented by two different colors
Madrid Bollinger Bands %DBB %B : Madrid : 06/JUN/2014 23:36 : 2.0
This displays the distance from the lower band in terms of percentage. The farther it is from the basis line, the stronger the trend.
When the price exceeds 100% or it's below 0% it means the price has reached an overbought (above 100) or oversold (below 0) level.
Madrid Bollinger Bands SDThis study tracks where the 5MA is relative to the Bollinger Bands
Bollinger Bands are segmented in four parts, +/- 2 stdDev and +/- 1 stdDev
+/- 1 : first StdDev Band
+/- 4 : Second StdDev Band
+/- 9 : Overbought / Oversold (Beyond 2nd SD Band)
This study is used to reduce the clutter on the screen. Instead of displaying the whole band, it displays a map that shows on which band the price is located. And provides at a glance the strength of the trend.
Madrid Bollinger Bands BackgroundThis displays a background color according to the position of the closing price on the Standard Deviation band
Blue for upper bands, Orange for lower bands
Bold color for oversold/overbought conditions
This study can be used as a standalone bar or it can be merged with other indicators or used as a chart background. The parameters it requires are simple, the length of the study, the multiplier and the kind of input, by default the closing price.
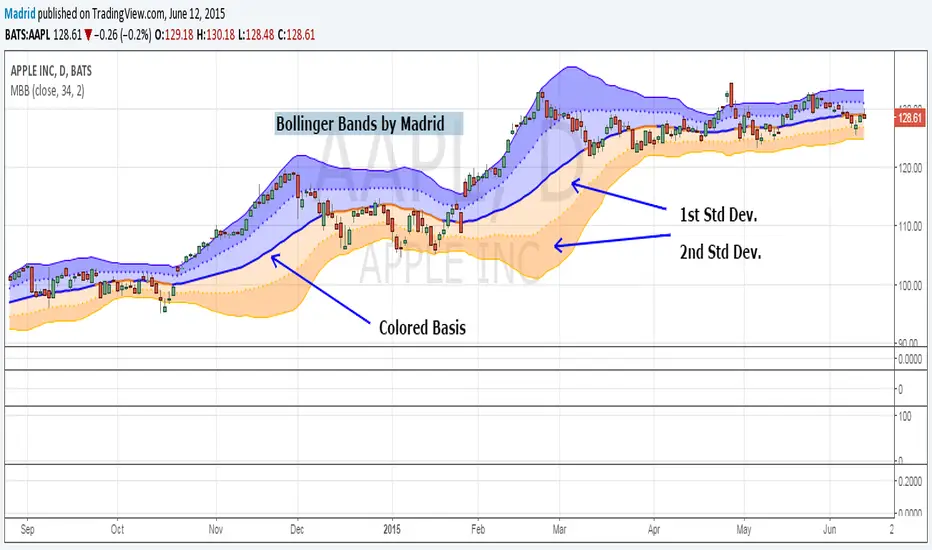
Bollinger BandsThis displays the traditional Bollinger Bands, the difference is that the 1st and 2nd StdDev are outlined with two colors and two different levels, one for each Standard Deviation.
The basis line is colored depending on the direction of the moving average.
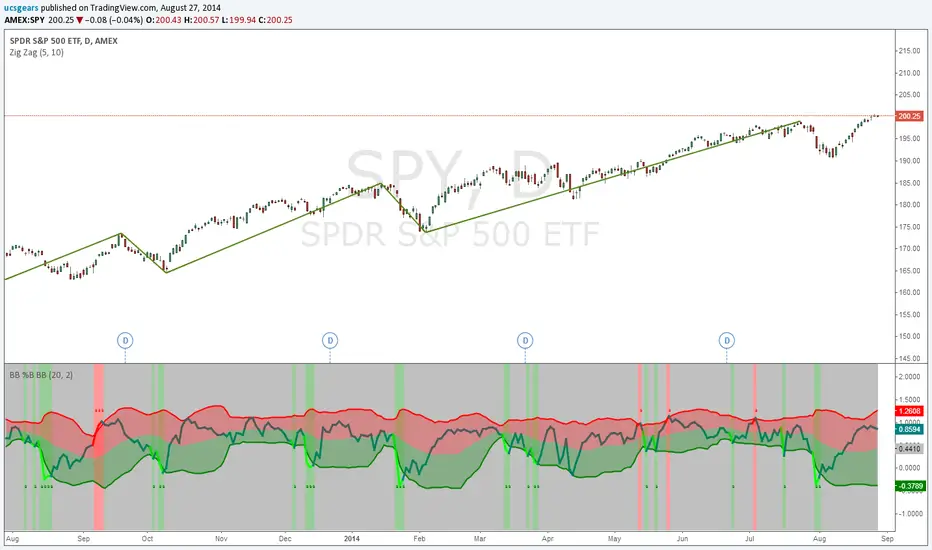
Bollinger Bands %B Bollinger Bands - Version 2Thanks to Chris Moody for his touch
List of All my Indicators - www.tradingview.com
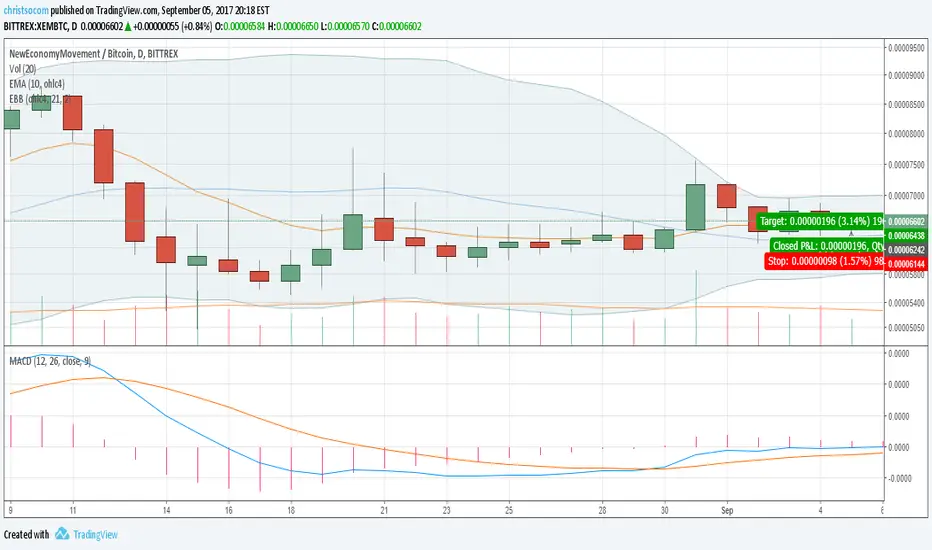
Breakdown OscillatorThis is an indicator I made, based on the observation that the longer the price action hugs the bottom bollinger band, the greater the danger of a breakdown occurring (price decline). Essentially its a moving average of the difference between close price and the bottom bollinger band, divided by the bottom bollinger band; I like to use 1.5 standard deviations for the 20 day bollinger band. When it crosses below zero there is increased danger of a breakdown, although of course it could turn right around and go up again. In fact if it does turn around sharply from near zero it can be a good time to buy in the context of a pullback within an uptrend. I also have included the 'slope factor' which makes the indicator more negative based on the rate of downward movement of the bollinger moving average (set to 0 to omit this modification). The indicator can be used just for exits or can be used for entry signals when crossing over the green bar if desired. In the example chart you can see the price hitting the lower band or crossing below the 50dMA plenty of times on the way up while the indicator says to hold tight. When the breakdown comes its after a prolonged period of low volatility (band squeeze) on the lower side of the moving average so the signal comes quickly - they won't all be this good of course. This indicator can also be used to help spot potential shorting candidates.
This indicator also works well on weekly charts; I like the 1 standard deviation with 16 to 24 week long period, 6 to 10 week short period and 30 buy level. Your mileage may vary, please do your own research.
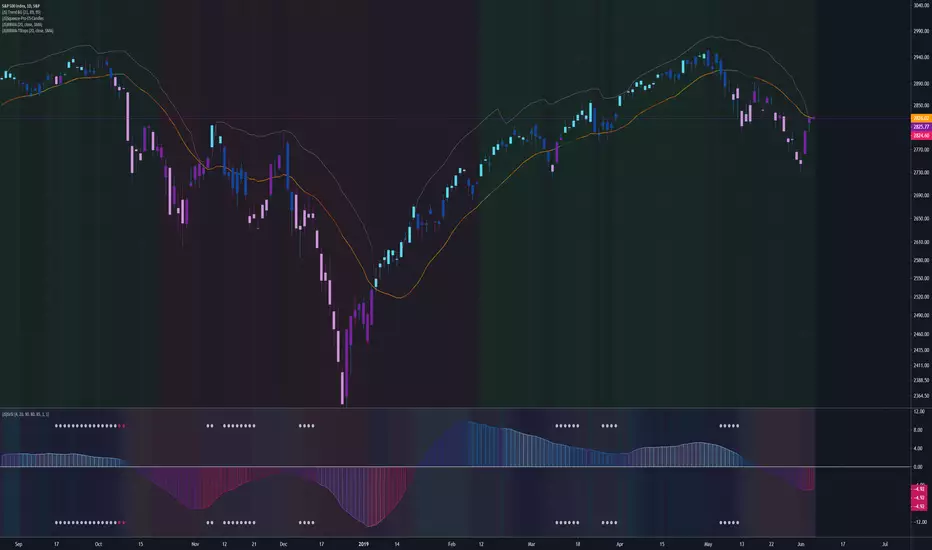
(JS) Bollinger Band Momentum Average Trailing StopsA tool I made to use alongside the Bollinger Band Momentum Average - fairly simple to use. It has the same settings as the BBMA so you can match them together.
If you prefer a wider stop than a close on the opposing side of the BBMA, this is for you.
The "stop" is triggered by a close on the other side of the stop line line turns red whenever the stop is triggered.
The calculation is simple:
The stop on the short side it is High - BBMA over the length of time you select to use (20 is default).
On the long side, it is BBMA - Low also over the preferred length of time you select to use.
Note: Just shorten the length to make a tighter stop.
Bollinger Bands MTF & Kalman Filter | Flux Charts📈 Multi-Timeframe Kalman Filtered Bollinger Bands Indicator
Introducing our MTF Kalman Filtered Bollinger Bands – a powerful multi-timeframe Bollinger Bands (BB) indicator enhanced with Kalman filtering for superior smoothing and trend analysis. This indicator dynamically adapts Bollinger Bands across multiple timeframes while incorporating volume-based gradient transparency to highlight significant price movements. This indicator is better optimized for lower timeframes.
❓ How to Interpret the Bands & Volume Gradient:
Our indicator combines Lower Timeframe (LTF) and Higher Timeframe (HTF) Bollinger Bands to provide a comprehensive trend analysis. It applies Kalman filtering to the LTF bands, ensuring smoother, noise-reduced signals. The color gradient and relative volume-based transparency offer deeper insights into price strength.
🔹 LTF Bollinger Bands: Shorter-period bands filtered with a Kalman smoothing algorithm, reducing lag and noise.
🔹 HTF Bollinger Bands: Traditional Bollinger Bands plotted on a higher timeframe, offering macro trend analysis.
🔹 Volume Gradient Transparency: The bands adjust their opacity based on relative buy/sell volume, allowing traders to assess momentum strength.
📌 How Does It Work?
1️⃣ Multi-Timeframe Bollinger Bands Calculation
The LTF BB uses Kalman filtering for a smoother price representation, helping to reduce false signals.
The HTF BB is EMA-smoothed for improved trend clarity.
2️⃣ Adaptive Gradient Transparency
The opacity of the fill color between the bands is determined by relative buy/sell volume.
Higher buy volume = stronger bullish signal (greener bands).
Higher sell volume = stronger bearish signal (redder bands).
3️⃣ Dynamic Trend Signals & Breakouts
Buy Signal: When price breaks below the HTF lower band and LTF bands start rising.
Sell Signal: When price breaks above the HTF upper band and LTF bands start falling.
⚙️ Settings & Customization:
🛠 LTF and HTF Bollinger Bands Settings:
Multiplier: The multiplier applied to the BB to determine the upper and lower bands
Length: Define the number of bars determines the BB calculations.
Custom Timeframe Selection: Choose from predefined options (e.g., 5m, 15m, 1H, 4H, etc).
🎨 Gradient & Transparency Settings:
Bullish/Bearish Color Options: Customize colors for uptrend and downtrend conditions.
Max & Min Opacity: Adjust the transparency levels based on volume intensity.
Solid vs. Gradient Mode: Choose between a gradient fill or a solid color mode for clarity.
📌 Recommended Settings for Optimal Use:
1️⃣ Timeframe Selection (LTF -> HTF):
1 min -> 5 min
2 min -> 5 min
3 min -> 15 min
5 min -> 15 min
15 min -> 1 hr
1 hr -> 4 hr
4 hr -> 1 day
2️⃣ Multiplier: Use 2.0 for LTF and 2.25 for HTF
3️⃣Length: Use a length of 20 - 30 bars
🚀 Why Use This Indicator?
✅ Multi-Timeframe Bollinger Bands with Kalman Filtering – Ideal for traders looking for reduced lag and clearer trend signals.
✅ Volume-Based Transparency – See momentum shifts instantly with adaptive opacity.
✅ Dynamic Buy & Sell Signals – Alerts based on price action + volume trends.
✅ Customizable for Any Strategy – Adjust colors, timeframes, and filtering options for personalized trading.
(JS) Bollinger Bands Momentum AverageSo this is something I've been using with my Squeeze system that I have found very useful (great addition especially if you use the Squeeze Arrows).
First thing I'd like to point out is that the default setting (20 SMA) is also the default for the Bollinger Bands basis line, so I recommend using the line set at the default.
First thing you'll notice is that whichever side of the line the candles close on, that basically determines the direction of the arrow for the Squeeze Arrows.
So this is extremely helpful in case momentum shifts after an arrow signal is given, if you see the price shoot to the other side of the line you can use that as a means of protection.
Second, the line is color coded in a way that I hope helps with entries and exits.
The colors of the line change based on two things:
1. If there is currently a squeeze.
2. Are the Bollinger Bands expanding or contracting.
Generally speaking, when the bands are contracting (light green and light orange default colors) this is the ideal time for entry before a trending move occurs.
Same thing on the flip side when they're expanding (dark green and dark orange default colors), that's usually the better time to exit.
Now what's the difference between orange and green?
Green = There's an ongoing squeeze
Orange = There's currently no squeeze
So playing the side of momentum when the line is light green and starts to break in a certain direction would be the ideal entry.
And, if momentum changes from that point, you can always use a close on the opposite side of the line as a stop (or an entry the other way).
This is something else I've been using on my own for a little while prior to publishing and it has been a tremendous tool for me. Hope it helps you all as much as it has me!
Bollinger Band Volatility Spread VisualizerThis indicator was created to see the total dollar (or whatever currency pair) amount spread between the upper and lower Bollinger Bands. This knowledge of knowing this spread can be used to indicate upcoming periods of high volatility in a market. The fundamental idea behind predicting periods of high volatility is backed up by the idea that periods of low volatility are followed by periods of high volatility and vice versa.
Based on this knowledge, the numerical spread of the Bollinger Bands, as shown in the indicator, we can deduce that when the value is super low, we can expect a period of high volatility AKA: big move incoming.
This indicator is not fully finished because this was my first time coding in Pinescript and I wanted to post the basic indicator first.
My future plans for improving this indicator include:
Adding customization as an option to choose your personal BBands settings that this indicator is based off of
Potentially converting this indicator as a TradingView Strategy where a signal would go off when the spread reaches a certain threshold
+ Bollinger Bands WidthHere is my rendition of Bollinger Bands Width. If you are unfamiliar, Bollinger Bands Width is a measure of the distance between the top and bottom bands of Bollinger Bands. Bollinger Bands themselves being a measure of market volatility, BB Width is a simpler, cleaner way of determining the amount of volatility in the market. Myself, I found the original, basic version of BB Width a bit too basic, and I thought that by adding to it it might make for an improvement for traders over the original.
Simple things that I've done are adding a signal line; adding a 'baseline' using Donchian Channels (such as that which is in my Average Candle Bodies Range indicator); adding bar and background coloring; and adding alerts for increasing volatility, and baseline and signal line crosses. It really ends up making for a much improved version of the basic indicator.
A note on how I created the baseline:
First, what do I mean by 'baseline?' I think of it as an area of the indicator where if the BB Width is below you will not want to enter into any trades, and if the BB Width is above then you are free to enter trades based on your system. It's basically a volatility measure of the volatility indicator. Waddah Attar Explosion is a popular indicator that implements something similar. The baseline is calculated thus: make a Donchian Channel of the BB Width, and then use the basis as the baseline while not plotting the actual highs and lows of the Donchian Channel. Now, the basis of a Donchian Channel is the average of the highs and the lows. If we did that here we would have a baseline much too high, however, by making the basis adjustable with a divisor input it no longer must be plotted in the center of the channel, but may be moved much lower (unless you set the divisor to 2, but you wouldn't do that). This divisor is essentially a sensitivity adjustment for the indicator. Of course you don't have to use the baseline. You could ignore it and only use the signal line, or just use the rising and falling of the BB Width by itself as your volatility measure.
I should make note: the main image above at default settings is an 8 period lookback (so, yes, that is quite fast), and the signal line is a Hull MA set to 13. The background and bar coloring are simply set to the rising and falling of the BB Width. Images below will show some different settings, but definitely play with it yourself to determine if it might be a good fit for your system.
Above, settings are background and bar coloring tuned to BB Width being above the baseline, and also requiring that the BB Width be rising. Background coloring only highlights increasing volatility or volatility above a certain threshold. Grey candles are because the BB Width is above the baseline but falling. We'll see an example without the requirement of BB Width rising, below.
Here, we see that background highlights and aqua candles are more prevalent because I've checked off the requirement that BB Width be rising. The idea is that BB Width is above the baseline therefor there is sufficient volatility to enter trades if our indicators give us the go-ahead.
This here is set to BB Width being above the signal line and also requiring a rising BB Width. Keep in mind the signal line is a Hull MA.
And this fourth and final image uses a volume-weighted MA as the signal line. Bar coloring is turned off, and instead the checkboxes for volatility advancing and declining are turned on under the signal line options. BB Width crosses up the signal line is advancing volatility, while falling below it is declining volatility. Background highlights are set to baseline and not requiring a rising BB Width. This way, with a quick glance you can see if the rising volatility is legitimate, i.e., is the cross up of the signal line coupled with it being above the baseline.
Please enjoy.
Bollinger Bands Triple - TradingEDThis case study is based on a previous Bollinger Bands study, but with 3 different counts to compare different trends. The use of this indicator is restricted to private use and it can be used only by invitation. Different functionalities have been added to the original code, such as alerts and signals that seek to make trading much easier to interpret by any type of trading operator of any experience level, from beginner to intermediate and advanced .
Key components of the original indicator:
• The Bollinger Bands are a technical analysis tool developed by John Bollinger to generate signals of overbuying and overselling.
• There are three lines that compose Bollinger Bands: one Simple Moving Average (middle band) and an upper and lower band.
• The Upper and Lower Bands are typically used with 2 Standard Deviations +/- of a 20-day Simple Moving Average (or 20 candles) but can be modified.
The use of Bollinger Bands is based on the concept of mean price reversal, assuming that if the price deviates from the Moving Average it will eventually return to the mean price. As recognized by its creator: John Bollinger , " the touches of the bands are just that, touches, not signals ".
So, a touch from the top is not in itself a sell signal and vice versa, a touch below should not be a buy signal either. A trader must look at the general direction of the price and then only take signals that align with the trend. For example, if the trend is down, you should only consider short positions when the lower band is indicated, and in case of an uptrend, take only long positions.
Another important point in the use of this indicator is that the bands will expand and contract as the Price Action becomes volatile (expansion) or is limited in its trading pattern (contraction). After a strong rise or fall in the trend, the market may consolidate, trading closely and crossing over and below the Moving Average until defining a new course, or continuing with the previous direction.
Main functions of this modified indicator:
1) You can select the type of MOVING AVERAGE , among many available options ( SMA , EMA , DEMA , HMA , etc.)
2) The SOURCE for the count can be determined by the trader (close, open, etc).
3) The MEASURE can be based on a CANDLES count if you are trading OHLC Charts from 1D onwards, or if your trading is intraday, you can also select counts by MINUTES , HOURS or DAYS , depending on your trading style.
4) LENGTH , by default it will be loaded as 20 but considering the previous point, you can modify it according to your convenience.
5) STANDARD DEVIATION , by default it will come loaded with 2 deviations, but you can modify it according to your convenience to operate.
6) You have the option to hide or show a LABEL at the top of the chart, with respect to the signals: bullish green, bearish red.
7) You have the option to hide or show SIGNALS based on the MOVING AVERAGE that you have previously chosen.
8) You have the option to hide or show SIGNALS based on the STANDARD DEVIATION that you have previously chosen.
Main functions to customize the style of this indicator:
a) You can select the colors for the UPPER BAND, MOVING AVERAGE and LOWER BAND depending on the trend, whether it is BEARISH or BULLISH , with the colors that best suit you. *
b) When you have a SHORT SIGNAL or a LONG SIGNAL , you can change the EMOTICON that comes by default. **
c) For any type of SIGNAL , it is painted as a VERTICAL LINE in the graph, you can change the color that comes by default. *
d) In the case of the LABELS that appear at the top, the text is not modifiable, but you can customize both the type of label and change the default color. *
e) You can select the colors for the BACKGROUND of the indicator according to the trend, whether it is BEARISH or BULLISH , with the colors that best suit you. *
* By default, they are marked as red for downtrends and green for uptrends.
** By default, they are marked with an emoticon indicating the possible direction of the price, down if it is bearish or up if it is bullish .