Ichimoku MTF HeatmapGreat for flying down you watchlist, getting an idea what time frame to go to. Enjoy!
Cari dalam skrip untuk "ichimoku"

Ichimoku_RSI_MACDIchimoku cloud + RSI + MACD. Combined indicators with signals, indicating whether it is bullish or bearish (BUY or SELL).

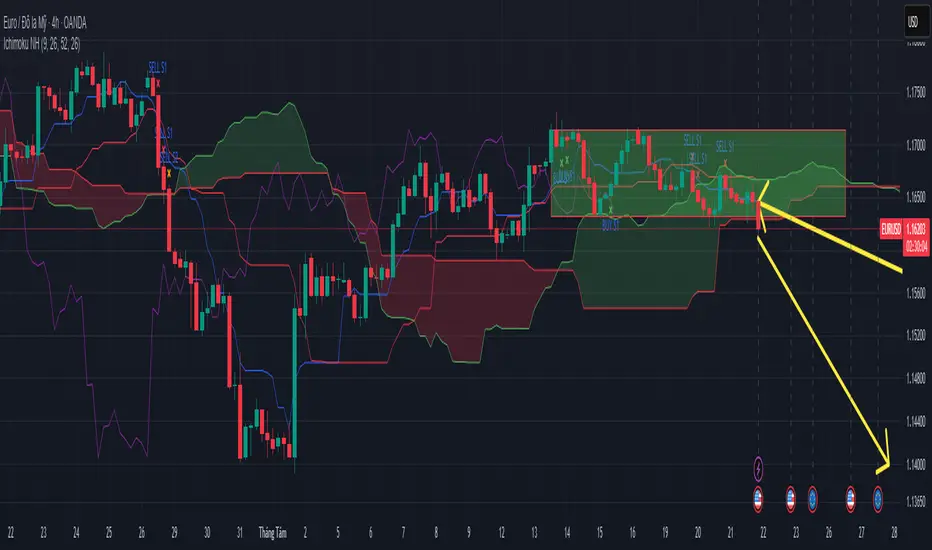
Ichimoku Trading Signals 1Swing Trading (Strategy 1, H4+ timeframes)
Use the Kumo Cloud to identify the trend: price above a green cloud = uptrend; price below a red cloud = downtrend.
Entry signals occur when price or the Tenkan-sen line crosses the Kijun-sen line, confirmed by Chikou Span momentum.
Exit triggers when price crosses back through the Kijun-sen or when Tenkan-sen crosses back below (for long positions) or above (for short positions).
Place stop-loss orders just beyond the nearest swing low/high candle cluster to manage risk tightly.
Ichimoku Trading Signals 2Swing Trading (Strategy 1, H4+ timeframes)
Use the Kumo Cloud to identify the trend: price above a green cloud = uptrend; price below a red cloud = downtrend.
Entry signals occur when price or the Tenkan-sen line crosses the Kijun-sen line, confirmed by Chikou Span momentum.
Exit triggers when price crosses back through the Kijun-sen or when Tenkan-sen crosses back below (for long positions) or above (for short positions).
Place stop-loss orders just beyond the nearest swing low/high candle cluster to manage risk tightly.

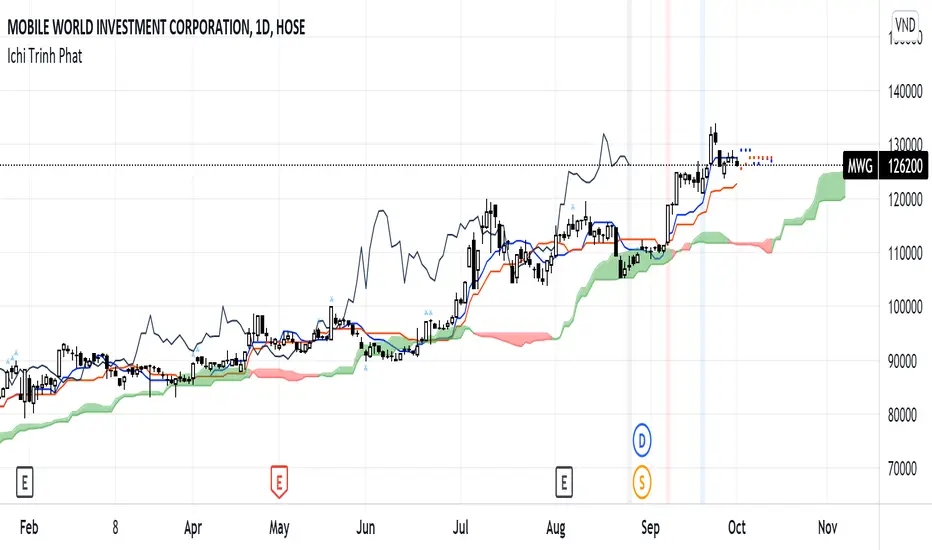
Ichimoku Trinh Phat - By NicolasShow the potential movement of Tenkan & Kijun in the future with assumption that the current highest price and lowest price of their period is unchanged
Show where the Tenkan and Kijun unite that preapre for a potential big movement
Alert for Union Signal, Breakout, Breakdown signal
Background Color Based on EMAHello Traders,
this is a very simple script. It paints the background color based on the close price in reference to an exponential moving average.
If the close is above the EMA the background color will be green.
If the close is under the EMA the background color will be red.
You can adjust colors and the EMA period by yourself.
This little indicator script is just to get a better overview, for example in combination with other indicators.
Hope you guys like this script. Wish you a great trading week.


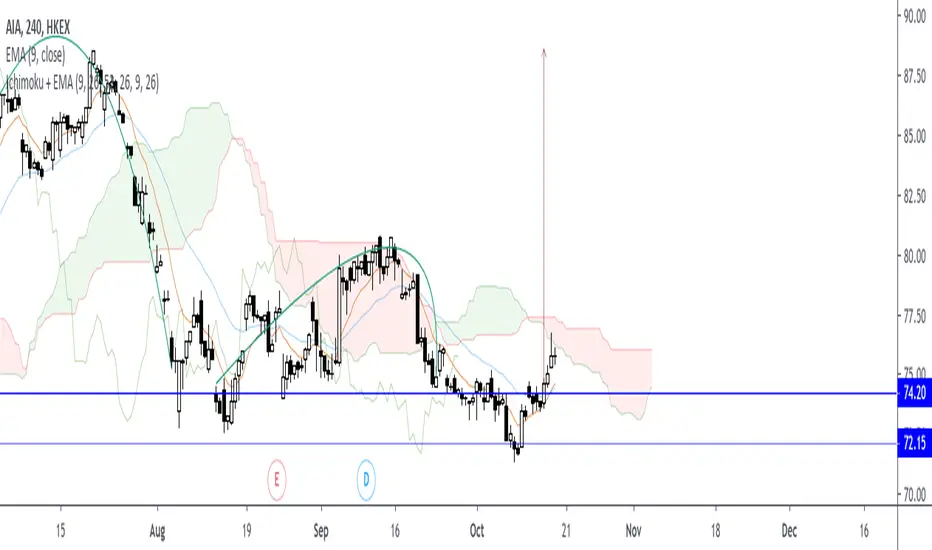
Ichimoku Cloud + EMA9,26instead of Base and Conversion, EMA9 and EMA26 is used to give more weight in recency of price movement
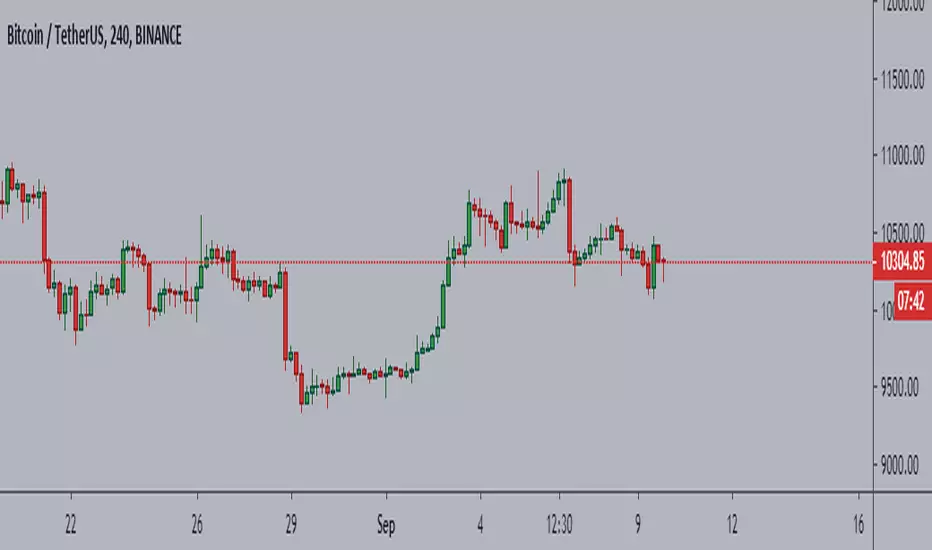

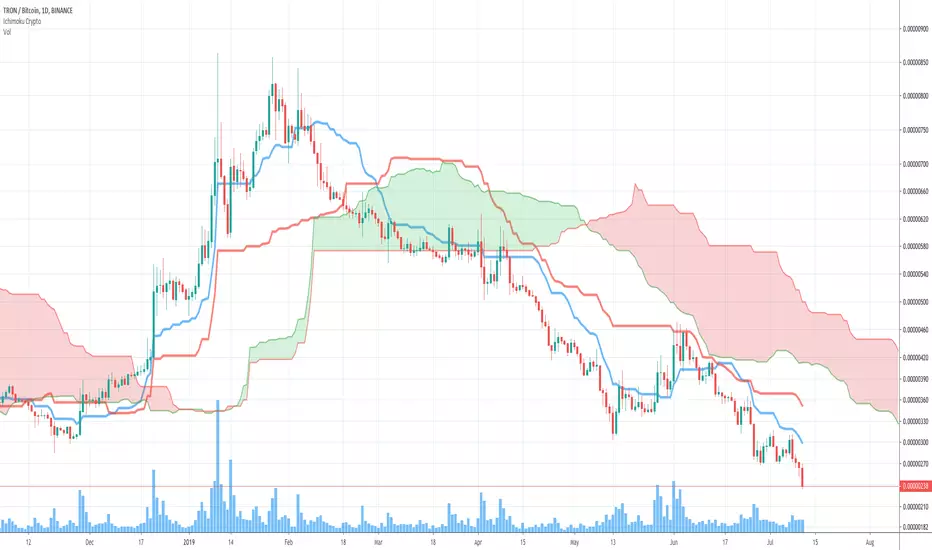


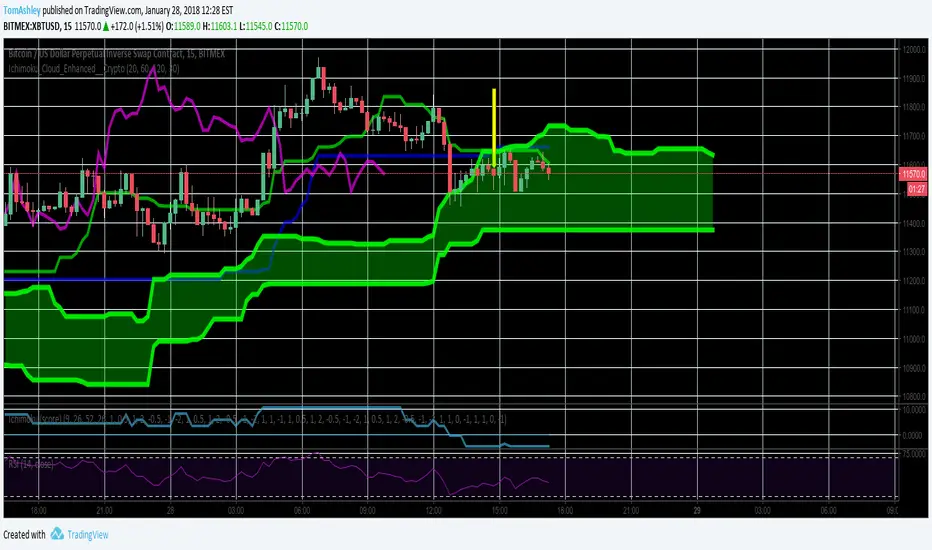
Ichimoku Cloud Enhanced For CryptoIntervals have been changed to account for a 24/7 cryptocurrency trading period. Values were then doubled so that the trader can avoid fakeout breakouts/traps. This leads to a bit less signals but rather, more sure signals instead. Very useful and more safe, even in smaller timeframes. Colors were set to the standard and breakout arrows are now enabled by default.
Ichimoku Cloud with Josh Olszewicz Crpyto Adjusted Settingslets you adjust your cloud to view higher timeframe cloud on lower timeframe by double or tripling timeframe

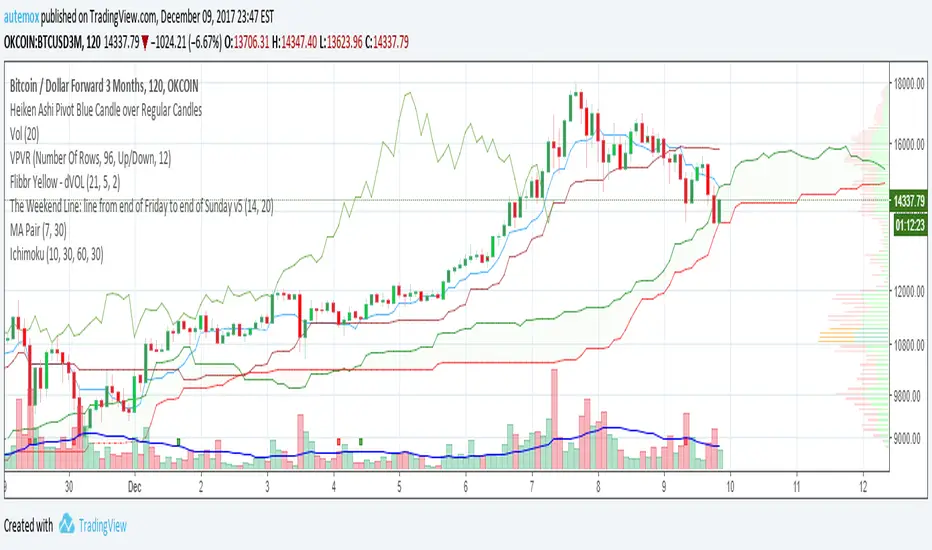
Ichimoku CriptomoneyConfigured for criptomonedas in its first version, testing the new configuration based on 10,30,60

Ichimoku PanOptic TM-V5 by BrainZZUpdate of the previous script.
New functions added:
- Highlight of price crossing KS
- Highlight of TS/KS crossing
- Highlight of rising/falling periods of KS
- Critical levels for SSB, KS and TS/


