CoT Trend Change MomentumI discovered that whenever there's huge change in long IO or short IO there will be a momentum shift. So, I created this indicator to spot massive explosive volume changes for commercials and non commercials activity. Using standard deviation 2 and -2 as extreme point. Whatever crossing above standard deviation 2 indicating positions are added regardless whether it is long or shorts, whatever crossing below standard deviation -2 means positions are closed.
This is how I use this indicator:
1) In this example , i use only the commercials long and shorts. Whenever the longs exceed stdeviation +2, means that long volume flow in massively, for me this can be indicating potential to the upside. Whenever longs fall below stdeviation-2, for me this can be indicating that commercials are either taking profits for the short positions or accumulating for another bull price.
2) For shorts same logic applied here, when it exceeds stdeviation +2, mean commercials shorts position increase massively, when it exceeds stdeviation-2, means that commercials closed their short positions.
For this script, I use 13 weeks period as lookback, u guys may directly modify the period in the script to set the period that u want.
I've added for non-commercials as well, to ease people who emphasizes on non-commercials positioning analysis process.
I'm still trying to incorporate this with Open Interest Analysis. Hopefully u guys find this indicator useful. Feel free to modify it, to understand it more, my suggestions are u compare date by date the positions, to see the extreme points. The indicator only works in weekly chart, it is non repainted only in weekly chart, meaning that the indicator shows the histogram just as the week open.
Cari dalam skrip untuk "momentum"

Uptrick: Bullish/Bearish Signal DetectorDetailed Explanation of the "Uptrick: Bullish/Bearish Signal Detector" Script
The "Uptrick: Bullish/Bearish Signal Detector" script is a sophisticated tool designed for the TradingView platform, leveraging Pine Script version 5. This script is crafted to enhance traders' ability to identify bullish (buy) and bearish (sell) signals directly on their trading charts. By combining the power of the MACD (Moving Average Convergence Divergence) and RSI (Relative Strength Index) indicators, this script provides a unique and efficient method for detecting potential trading opportunities. Below is an in-depth exploration of its purpose, features, and functionality.
Purpose
The primary purpose of this script is to assist traders in identifying potential entry and exit points in the market by signaling bullish and bearish conditions. This automated detection helps traders make more informed decisions without the need to manually analyze complex indicators. By overlaying signals directly on the price chart, the script allows for quick visual identification of market trends and reversals.
Uniqueness
What sets this script apart is its dual use of MACD and RSI indicators. While many trading strategies might rely on a single indicator, combining MACD and RSI enhances the reliability of the signals by filtering out false positives. The script not only identifies trends but also adds a layer of confirmation through the RSI, which measures the speed and change of price movements.
Inputs and Features
Customizable Label Appearance:
The script allows users to customize the appearance of the labels that indicate bullish and bearish signals. Users can set their preferred colors for the labels and the text, ensuring that the signals are easily distinguishable and aesthetically pleasing on their charts.
MACD Calculation:
The script calculates the MACD line and signal line using user-defined input values for the fast length, slow length, and signal length. The MACD histogram, which is the difference between the MACD line and the signal line, is used to determine the momentum of the market.
RSI Calculation:
The RSI is calculated using a user-defined input length. The RSI helps in identifying overbought or oversold conditions, which are crucial for confirming the strength of the trend detected by the MACD.
Bullish and Bearish Conditions:
The script defines bullish conditions as those where the MACD histogram is positive and the RSI is above 50. Bearish conditions are defined where the MACD histogram is negative and the RSI is below 50. This combination of conditions ensures that signals are generated based on both momentum and relative strength, reducing the likelihood of false signals.
Label Plotting:
The script plots labels on the chart to indicate bullish and bearish signals. When a bullish condition is met, and the previous signal was not bullish, a "LONG" label is plotted. Similarly, when a bearish condition is met, and the previous signal was not bearish, a "SHORT" label is plotted. This feature helps in clearly marking the points of interest for traders, making it easier to spot potential trades.
Tracking Previous Signals:
To avoid repetitive signals, the script keeps track of the last signal. If the last signal was bullish, it avoids plotting another bullish signal immediately. The same logic applies to bearish signals. This tracking ensures that signals are spaced out and only significant changes in market conditions are highlighted.
How It Works
The script operates in a loop, processing each bar (or candlestick) on the chart as new data comes in. It calculates the MACD and RSI values for each bar and checks if the current conditions meet the criteria for a bullish or bearish signal. If a signal is detected and it is different from the last signal, a label is plotted on the chart at the current bar's price level. This real-time processing allows traders to see the signals as they form, providing timely insights into market movements.
Practical Application
For practical use, a trader would add this script to their TradingView chart. They can customize the input parameters for the MACD and RSI calculations to fit their trading strategy or preferred settings. Once added, the script will automatically analyze the price data and start plotting "LONG" and "SHORT" labels based on the detected signals. Traders can then use these labels to make decisions on entering or exiting trades, adjusting their strategy as necessary based on the signals provided.
Conclusion
The "Uptrick: Bullish/Bearish Signal Detector" script is a powerful tool for any trader looking to leverage technical indicators for better trading decisions. By combining MACD and RSI, it offers a robust method for detecting market trends and potential reversals. The customizable features and real-time signal plotting make it a versatile and user-friendly addition to any trading toolkit. This script not only simplifies the process of technical analysis but also enhances the accuracy of trading signals, thereby potentially increasing the trader's success rate in the market.

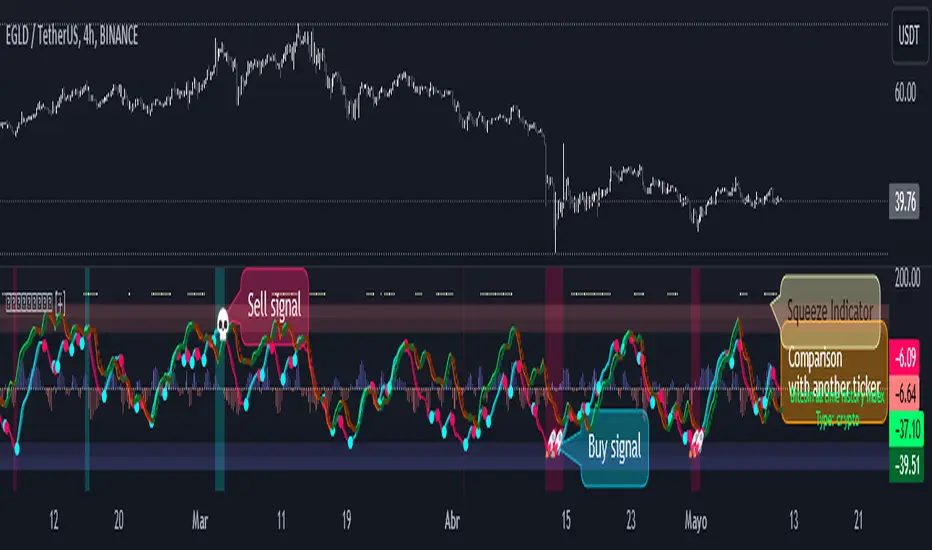
WaveTrend Oscillator PlusThe WaveTrend based on “Enhanced WaveTrend” of EliCobra. The WaveTrend Oscillator is a popular technical analysis tool used to identify overbought and oversold conditions in the market and generate trading signals. This indicator introduces additional features for improved analysis and comparison across assets.
WaveTrend:
The original WaveTrend indicator calculates two lines based on exponential moving averages and their relationship to the asset's price. The first line measures the distance between the asset's price and its EMA, while the second line smooths the first line over a specific period. The result is divided by 0.015 multiplied by the smoothed difference ('d' for reference). The indicator aims to identify overbought and oversold conditions by analyzing the relationship between the two lines.
In the original formula, the rudimentary estimation factor 0.015 times 'd' fails to accomodate for approximately a quarter of the data, preventing the indicator from reaching the traditional stationary levels of +-100. This limitation renders the indicator quantitatively biased, as it relies on the user's subjective adjustment of the levels. The enhanced version replaces this factor with the standard deviation of the asset's price, resulting in improved estimation accuracy and provides a more dynamic and robust outcome, we thereafter multiply the result by 100 to achieve a more traditional oscillation.
Enhancements and Features:
Dynamic Estimation: The original indicator uses an arbitrary estimation factor, while the enhanced version replaces it with the standard deviation of the asset's price. This modification provides a more dynamic and accurate estimation, adapting to the specific price characteristics of each asset.
Stationary Support and Resistance Levels: The enhanced version provides stationary key support and resistance levels that range from -150 to 150. These levels are determined based on the analysis of the indicator's data and encompass more than 95% of the indicator's values. These levels offer important reference points for traders to identify potential price reversals or significant price movements.
Comparison Across Assets: The enhanced version allows for better comparison and analysis across different assets. By incorporating the standard deviation of the asset's price, the indicator provides a more consistent and comparable interpretation of the market conditions across multiple assets.
Z-Score Analysis:
The Z-Score is a statistical measurement that quantifies how far a particular data point deviates from the mean in terms of standard deviations. In the enhanced version, the calculation involves determining the basis (mean) and deviation (standard deviation) of the asset's price to calculate its Z-Score, thereafter applying a smoothing technique to generate the final WaveTrend value.
Utility:
The offers traders and investors valuable insights into overbought and oversold conditions in the market. By analyzing the indicator's values and referencing the stationary support and resistance levels, traders can identify potential trend reversals, evaluate market strength, and make better informed analysis.
The following indicators were added:
⎆⎆ Squeeze Momentum Indicator
⎆⎆ Elliott Wave Oscillator
⎆⎆ Expert Trend Locator
UT Bot Stochastic RSIUT Bot Stochastic RSI is a powerful trading tool designed to help traders identify potential buy and sell signals in the market. This indicator combines the Stochastic and RSI (Relative Strength Index) oscillators, two of the most popular and effective technical analysis tools, to provide a comprehensive view of market conditions.
The Stochastic oscillator is a momentum indicator that compares a security's closing price to its price range over a given time period. The RSI, on the other hand, is a momentum oscillator that measures the speed and change of price movements. By combining these two indicators, the UT Bot Stochastic RSI can help traders identify overbought and oversold conditions, as well as potential trend reversals.
The UT Bot Stochastic RSI also includes an ATR (Average True Range) trailing stop, which can be used to set stop-loss levels and manage risk. This feature is particularly useful in volatile markets, where price movements can be large and unpredictable.
In addition to its powerful technical analysis tools, the UT Bot Stochastic RSI also includes a backtesting feature, allowing traders to test their strategies on historical data. This can help traders identify the most effective settings for the indicator and improve their trading performance.
Overall, the UT Bot Stochastic RSI is a versatile and effective tool for traders of all levels, providing valuable insights into market conditions and helping to improve trading decisions

Trig-Log Scaled Momentum OscillatorTaylor Series Approximations for Trigonometry:
1. The indicator starts by calculating sine and cosine values of the close price using Taylor Series approximations. These approximations use polynomial terms to estimate the values of these trigonometric functions.
Mathematical Component Formation:
2. The calculated sine and cosine values are then multiplied together. This gives us the primary mathematical component, termed as the 'trigComponent'.
Smoothing Process:
3. To ensure that our indicator is less susceptible to market noise and more reactive to genuine price movements, this 'trigComponent' undergoes a smoothing process using a simple moving average (SMA). The length of this SMA is defined by the user.
Logarithmic Transformation:
4. With our smoothed value, we apply a natural logarithm approximation. Again, this approximation is based on the Taylor expansion. This step ensures that all resultant values are positive and offers a different scale to interpret the smoothed component.
Dynamic Scaling:
5. To make our indicator more readable and comparable over different periods, the logarithmically transformed values are scaled between a range. This range is determined by the highest and lowest values of the transformed component over the user-defined 'lookback' period.
ROC (Rate of Change) Direction:
6. The direction of change in our scaled value is determined. This offers a quick insight into whether our mathematical component is increasing or decreasing compared to the previous value.
Visualization:
7. Finally, the indicator plots the dynamically scaled and smoothed mathematical component on the chart. The color of the plotted line depends on its direction (increasing or decreasing) and its boundary values.

Variety Step RSI w/ Dynamic Zones [Loxx]Variety Step RSI w/ Dynamic Zones is a stepped RSI calculation with Discontinued Signal Lines. This indicator includes 7 types of RSI to choose from. The addition of the Discontinued Signal Lines allows this indicator to better identify momentum shifts in price so traders have better defined long/short signals.
Enhanced Moving Average Calculation with Stepped Moving Average and the Advantages over Regular RSI
Technical analysis plays a crucial role in understanding and predicting market trends. One popular indicator used by traders and analysts is the Relative Strength Index (RSI). However, an enhanced approach called Stepped Moving Average, in combination with the Slow RSI function, offers several advantages over regular RSI calculations.
█ Stepped Moving Average and Moving Averages:
The Stepped Moving Average function serves as a crucial component in the calculation of moving averages. Moving averages smooth out price data over a specific period to identify trends and potential trading signals. By employing the Stepped Moving Average function, traders can enhance the accuracy of moving averages and make more informed decisions.
Stepped Moving Average takes two parameters:
The current RSI value and a size parameter. It computes the next step in the moving average calculation by determining the upper and lower bounds of the moving average range. It accomplishes this by adjusting the values of smax and smin based on the given RSI and size.
Furthermore, Stepped Moving Average introduces the concept of a trend variable. By comparing the previous trend value with the current RSI and the previous upper and lower bounds, it updates the trend accordingly. This feature enables traders to identify potential shifts in market sentiment and make timely adjustments to their trading strategies.
█ Advantages over Regular RSI:
Enhanced Range Boundaries:
The inclusion of size parameters in Stepped Moving Average allows for more precise determination of the upper and lower bounds of the moving average range. This feature provides traders with a clearer understanding of the potential price levels that can influence market behavior. Consequently, it aids in setting more effective entry and exit points for trades.
Improved Trend Identification:
The trend variable in Stepped Moving Average helps traders identify changes in market trends more accurately. By considering the previous trend value and comparing it to the current RSI and previous bounds, Stepped Moving Average captures trend reversals with greater precision. This capability empowers traders to respond swiftly to market shifts and potentially capture more profitable trading opportunities.
Smoother Moving Averages:
Stepped Moving Average's ability to adjust the moving average range bounds based on trend changes and size parameters results in smoother moving averages. Regular RSI calculations may produce jagged or erratic results due to abrupt market movements. Stepped Moving Average mitigates this issue by dynamically adapting the range boundaries, thereby providing traders with more reliable and consistent moving average signals.
Complementary Functionality with Slow RSI:
Stepped Moving Average and Slow RSI function in harmony to provide a comprehensive trading analysis toolkit. While Stepped Moving Average refines the moving average calculation process, Slow RSI offers a more accurate representation of market strength. The combination of these two functions facilitates a deeper understanding of market dynamics and assists traders in making better-informed decisions.
What is a Discontinued Signal Line (DSL)?
Many indicators employ signal lines to more easily identify trends or desired states of the indicator. The concept of a signal line is straightforward: by comparing a value to its smoothed, slightly lagging state, one can determine the current momentum or state.
The Discontinued Signal Line builds on this fundamental idea by extending it: rather than having a single signal line, multiple lines are used based on the indicator's current value.
The "signal" line is calculated as follows:
When a specific level is crossed in the desired direction, the EMA of that value is calculated for the intended signal line.
When that level is crossed in the opposite direction, the previous "signal" line value is "inherited," becoming a sort of level.
This approach combines signal lines and levels, aiming to integrate the advantages of both methods.
In essence, DSL enhances the signal line concept by inheriting the previous signal line's value and converting it into a level.
Extras
-Alerts
-Signals
Related indicators:
Step RSI

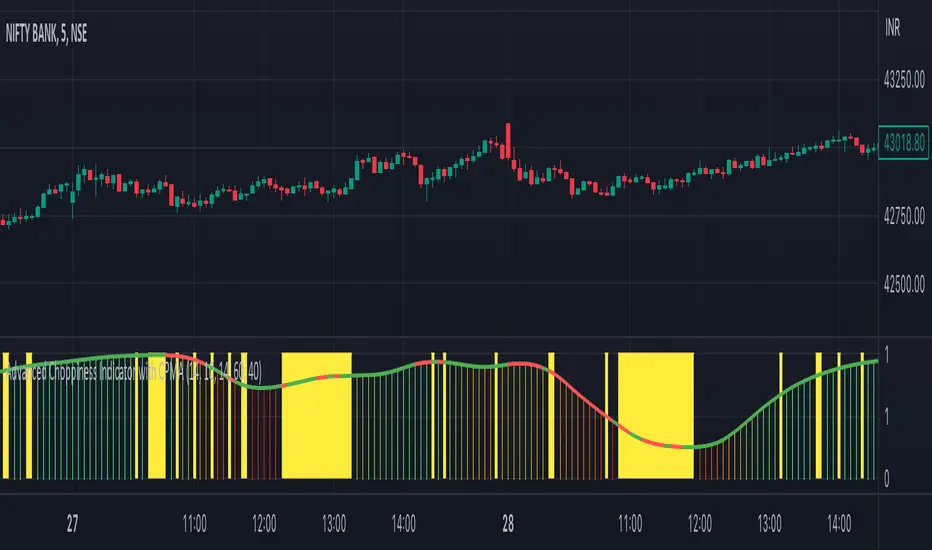
Advanced Choppiness Indicator with CPMA"The Advanced Choppiness Indicator with CPMA is a technical analysis tool designed to assist traders in identifying choppy market conditions and determining trend direction. It combines two key components: the Choppiness Index and a Custom Price Moving Average (CPMA).
The Choppiness Index is calculated using the Average True Range (ATR), which measures market volatility. It compares the ATR to the highest high and lowest low over a specified period. A higher Choppiness Index value indicates choppier market conditions, while a lower value suggests smoother and more directional price movements.
The CPMA is a custom moving average that takes into account various price types, including the close, high, low, and other combinations. It calculates the average of these price types over a specific length. The CPMA provides a smoother trend line that can help identify support and resistance levels more accurately than traditional moving averages.
When using this indicator, pay attention to the following elements:
Yellow range boxes: These indicate choppy zones, where market conditions are characterized by low momentum and erratic price action. Avoid entering trades during these periods.
Histogram bars: Green bars suggest an uptrend, while red bars indicate a downtrend. These bars are based on the CPMA and can help confirm the prevailing trend direction.
CPMA angle: The angle of the CPMA line provides further insight into the trend. A positive angle indicates an uptrend, while a negative angle suggests a downtrend.
Choppiness thresholds: The indicator includes user-defined thresholds for choppiness. Values above the high threshold indicate high choppiness, while values below the low threshold suggest low choppiness.
Trade decisions: Consider the information provided by the indicator to make informed trading decisions. Avoid trading during choppy zones and consider entering trades in the direction of the prevailing trend.
Remember that the indicator's parameters, such as ATR length and CPMA length, can be adjusted to suit your trading preferences and timeframe. However, it's important to use this indicator in conjunction with other technical analysis tools and your trading strategy for comprehensive market analysis."
By combining the Choppiness Index, CPMA, and other visual cues, this indicator aims to help traders identify suitable trading conditions and make more informed decisions based on market trends and volatility.
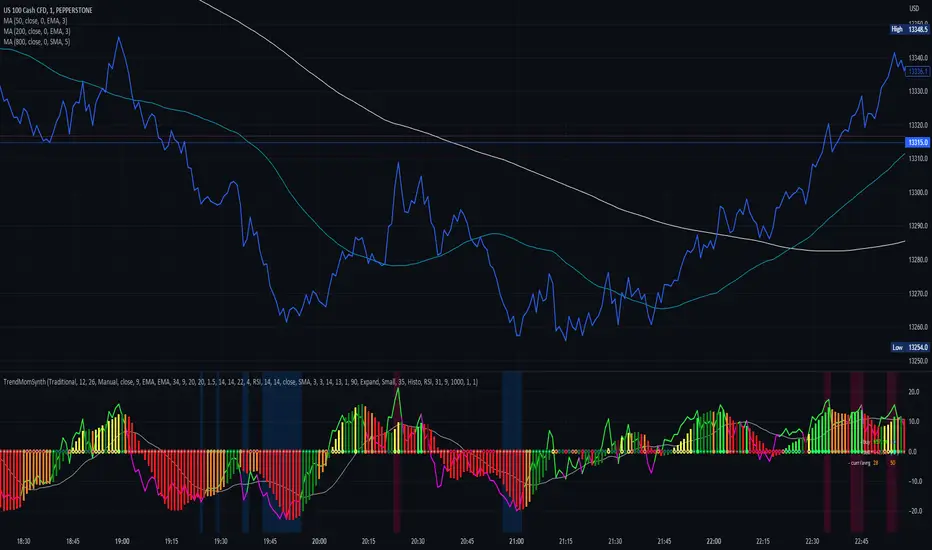
Trend Momentum SynthesizerBy analyzing the MACD (Moving Average Convergence Divergence) and Squeeze Momentum indicators, this indicator helps identify potential bullish, bearish, or undecided market conditions.
The algorithm within considers the positions of the MACD and Squeeze Momentum indicators to determine the overall market sentiment. When the indicators align and indicate a bullish market condition, the indicator's plot color will be either dark green, green, yellow, or lime, indicating a potential bullish trend. Conversely, if the indicators align and indicate a bearish market condition, the plot color will be maroon or red, denoting a potential bearish trend. When the indicators are inconclusive, the plot color will be orange, suggesting an undecided market.
The ADX is an addon component of this indicator, helping to assess the strength of a trend. By analyzing the ADX, the indicator determines whether a trend is strong enough, providing additional confirmation for potential trade signals. The ADX smoothing and DI (Directional Index) length parameters can be customized to suit individual trading preferences.
By combining these indicators, the algorithm provides traders with a comprehensive view of the market, helping them make informed trading decisions. It aims to assist traders in identifying potential market opportunities and aligns with the objective of maximizing trading performance.
How to use the indicator:
Note: I used back-testing for fine tuning do not base your trades on signals from the testing framework.
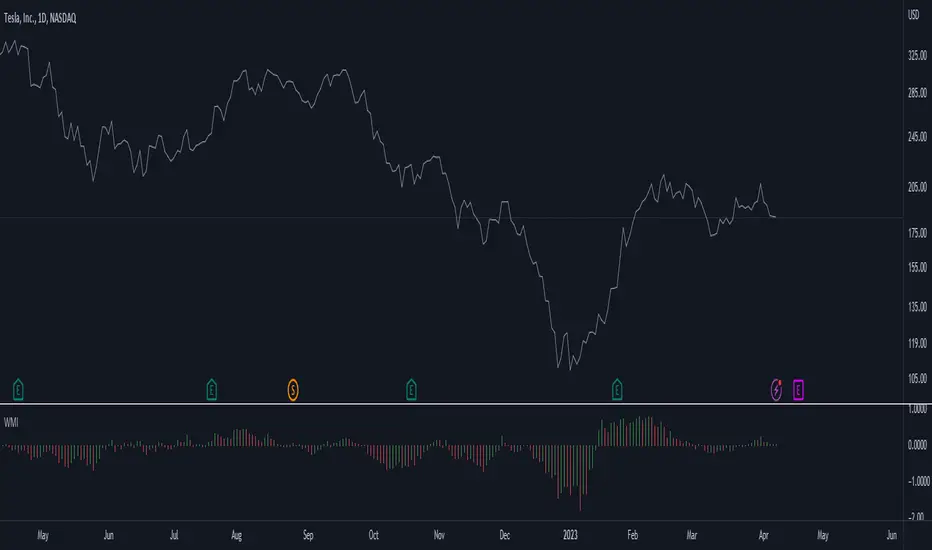
Weighted Momentum and Volatility Indicator (WMI)The Weighted Momentum and Volatility Indicator (WMI) is a composite technical analysis tool that combines momentum and volatility to identify potential trend changes in the underlying asset.
The WMI is displayed as an histogram that oscillates around a zero line, with increasing bars indicating a bullish trend and decreasing bars indicating a bearish trend.
The WMI is calculated by combining the Rate of Change (ROC) and Average True Range (ATR) indicators.
The ROC measures the percentage change in price over a set period of time, while the ATR measures the volatility of the asset over the same period.
The WMI is calculated by multiplying the normalized values of the ROC and ATR indicators, with the normalization process being used to adjust the values to a scale between 0 and 1.
Traders and investors can use the WMI to identify potential trend changes in the underlying asset, with increasing bars indicating a bullish trend and decreasing bars indicating a bearish trend.
The WMI can be used in conjunction with other technical analysis tools to develop a comprehensive trading strategy.
Do not hesitate to let me know your comments if you see any improvements to be made :)
Stochastic Momentum Index (SMI) Refurbished▮Introduction
Stochastic Momentum Index (SMI) Indicator is a technical indicator used in technical analysis of stocks and other financial instruments.
It was developed by William Blau in 1993 and is considered to be a momentum indicator that can help identify trend reversal points.
Basically, it's a combination of the True Strength Index with a signal line to help identify turning points in the market.
SMI uses the stochastic formula to compare the current closing price of an asset with the maximum and minimum price range over a specific period.
He then compares this ratio to a short-term moving average to create an indicator that oscillates between -100 and +100.
When the SMI is above 0, it is considered positive, indicating that the current price is above the short-term moving average.
When it is below 0, it is considered negative, indicating that the current price is below the short-term moving average.
Traders use the SMI to identify potential trend reversal points.
When the indicator reaches an extreme level above +40 or below -40, a trend reversal is possible.
Furthermore, traders also watch for divergences between the SMI and the asset price to identify potential trading opportunities.
It is important to remember that the SMI is a technical indicator and as such should be used in conjunction with other technical analysis tools to get a complete picture of the market situation.
▮ Improvements
The following features were added:
1. 7 color themes, for TSI, Signal and Histogram.
2. Possibility to customize moving average type for TSI/Signal.
3. Dynamic Zones.
4. Crossing Alerts.
5. Alert points on specific ranges.
5. Coloring of bars according to TSI/Signal/Histogram.
▮ Themes
Examples:
▮ About Dynamic Zones
'Most indicators use a fixed zone for buy and sell signals.
Here's a concept based on zones that are responsive to the past levels of the indicator.'
The concept of Dynamic Zones was described by Leo Zamansky ( Ph .D.) and David Stendahl, in the magazine of Stocks & Commodities V15:7 (306-310).
Basically, a statistical calculation is made to define the extreme levels, delimiting a possible overbought/oversold region.
Given user-defined probabilities, the percentile is calculated using the method of Nearest Rank.
It is calculated by taking the difference between the data point and the number of data points below it, then dividing by the total number of data points in the set.
The result is expressed as a percentage.
This provides a measure of how a particular value compares to other values in a data set, identifying outliers or values that are significantly higher or lower than the rest of the data.
▮ What to look for
1. Divergences/weakening of a trend/reversal:
2. Supports, resistances, pullbacks:
3. Overbought/Oversold Points:
▮ Thanks and Credits
- TradingView and PineCoders: for SMI and Moving Averages
- allanster: for Dynamic Zones

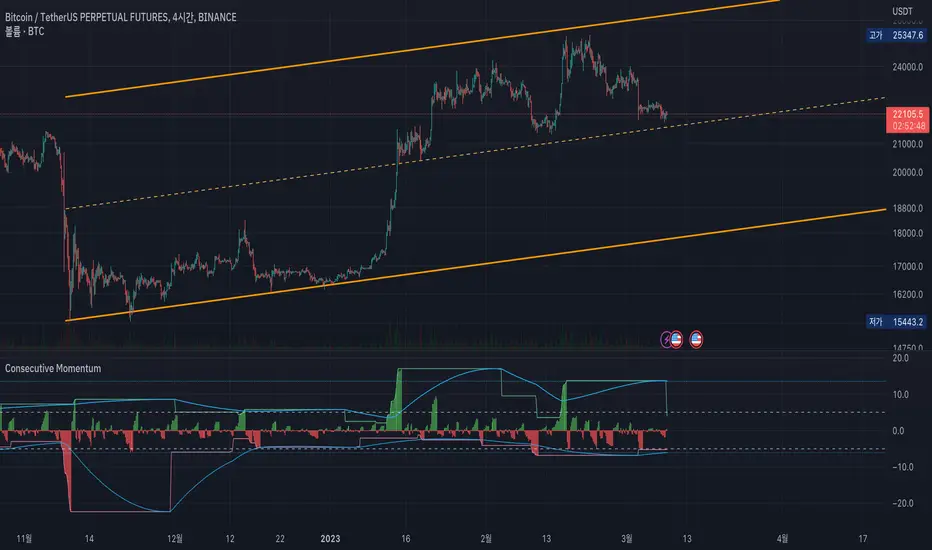
Consecutive MomentumThis is a momentum indicator that measures how much fluctuation has occurred in the direction of the consecutive candle.
The green line at the upper of the indicator shows the maximum rise over the set period (default is 120 candles).
Likewise, the red line at the bottom shows the biggest drop.
The blue line shows the average of the maximum fluctuation width.
---
For example, in the picture above, the green vertical line means that consecutive fallen goes beyond the average level.
Also, the red vertical line shows that the consecutive rising exceeds the average level.
---
Uncheck the 'Show Direction' check box to show the values as absolute values.
In addition, if you select the 'Show Consecutive Candle' option, you can see how many consecutive candles have been occurred.
---
Since You may be able to trade against the trend outside of the above average rise/fall,
through this indicator, I wanted to express a situation that requires risk management such as "It is overheat than usual, so I should wait for a retracement."
I hope this helps you.
------------------------------
이 지표는, 양봉 혹은 음봉이 연속적으로 발생할 때의 변동폭을 보여주는 모멘텀 지표입니다.
지표 상단의 녹색 선은 설정된 기간 동안 최대 상승폭을 나타냅니다(기본값은 120캔들).
마찬가지로 하단의 붉은색 선은 설정된 기간동안의 최대 하락폭을 보여줍니다.
하늘색 선은 이러한 최대 변동 폭의 평균을 가중평균으로 계산하였습니다.
---
예를 들어, 위의 그림에서 녹색 수직선은 연속적으로 하락한 것이 평균 수준을 초과한다는 것을 의미합니다.
또한 빨간색 수직선은 연속적인 상승폭이 이 평균 수준을 초과한다는 것을 보여줍니다.
---
음봉을 절댓값으로 보고 싶다면 'Show Direction'체크박스를 해제하시면 됩니다.
이 경우 '평균적인 최대 상승/하락폭'은 연속적인 양봉음봉의 평균으로 표기됩니다.
맨 아래에 있는 선택란에 'Show Consecutive Candle' 옵션을 선택하면, 연속적인 양봉 음봉의 갯수를 보여주는 상태로 바뀝니다.
---
당장 위와 같은 평균적인 연속 양봉의 상승/음봉의 하락폭을 벗어나는 자리에서 역추세매매를 할수도 있겠지만,
저는 이 지표를 통해 '평상시보다 과열 상태이니 되돌림을 기다려야겠다'와 같은 리스크 관리가 필요한 상태를 표현하고 싶었습니다.
잘 이용해주시면 감사하겠습니다.
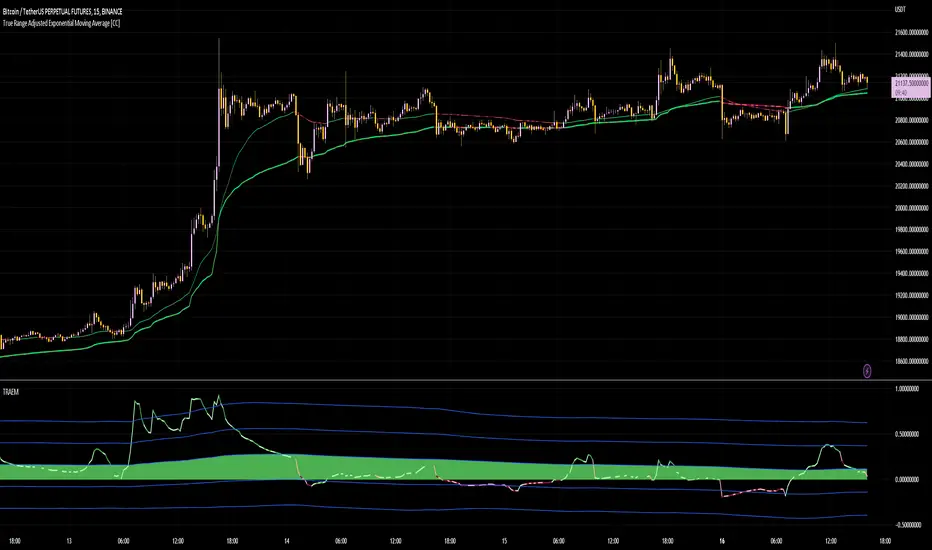
True Range Adjusted Exponential Momentum [CC]-[burgered]Original Script by CheatCountry, used with permission (chill guy):
I have made a sort of conversion of CheatCountries implementation of the True Range Adjusted Exponential Moving Average into a momentum oscillator.
Being True Range based, it the bounds vary based on the chart.
Includes a Bollinger Band for bounds that forms a trend follower based on the 0 point.
Includes CheatCountry color code signals, different color scheme. Bright colors are strong signals, ark are weak, green bull, red bear, the basics.
This oscillator can be used for divergences, trends, signal strength, confirmation, volatility readings, you name it.
Works well on smoothed/filtered signals as well.
Give CheatCountry a follow, hes one of the MVPs of Tradingview Pinescripters, constantly giving us access to novel new concepts as they are published by professionals.
Deemer Breakaway Momentum ThrustBreakaway momentum is a "breadth thrust" coined by Walter Deemer in the 1970s that occurs when the ten-day total advances on the NYSE are greater than 1.97 times the ten-day total NYSE declines.
This indicator calculates the ratio and plots it as a histogram. The 1.97 threshold is also plotted as a horizontal line. Anytime the histogram gets above the line Breakaway Momentum has occurred.
This is a rare signal that has only happened 25 times since 1945.

Stoch RSI 15 min - multi time frame tableABOUT THIS INDICATOR
This indicator calculates the Stochastic RSI for the time frames 15 min, 30 min, 1h, 4h, and 12h. However, the 15 min time frame should always be the default time frame for your chart.
IMPORTANT
* NOTE! It's extremely important that the chosen time frame for your chart is 15 min. Otherwise the Stochastic RSI for the longer time frames won’t be correctly calculated.
* Stochastic RSI will be calculated and displayed in a table for the time frames: 15 min, 30 min, 1h, 4h, 12h.
* All time frames are based on closed bars except the "15minR" that are realtime updated values calculated on a 15 min time frame.
ABOUT STOCHASTIC RSI
The Stochastic RSI (StochRSI) is a momentum indicator that ranges between 0 and 100. A Stochastic RSI value above 80 is considered overbought and below 20 is considered oversold.
By using different time frames you can get a better idea of what direction the trade could take in a "longer" perspective.
SETTINGS
1.) Length RSI = 14 (default period)
2.) Smoothing parameter of Stochastic RSI (Length Moving Average = 3) . Moving average of stochastic RSI
* By default the displayed Stochastic RSI values are smoothed values of the actual Stochastic RSI. The smoothnes is formed by a calculated moving average of with the length of 3 by default.
If you want Stochastic RSI with a sharper signal (higher risk for "false alarms" being more sensitive) change the Length Moving Average to = 1 (no smoothness at all)
You can see the selected "Length RSI" and "Length Moving Average" on top of the Stochastic RSI table.
Next version of this script will be updated with more a more flexible solution for different time frames.
* NOTE, Tradingview comes with a inbuilt Stochastic RSI. See the the chart below. The blue line in the Stochastic-RSI chart represents (K value = 3) the same value as the script calculate/display in the table.

Qube [AstrideUnicorn]Qube is an indicator that shows market regimes. It is able to detect medium and long term trends and ranging markets. If the indicator bars are colored blue and are between the two blue lines, it means that the market is in sideways movement or consolidation. If indicator bars cross the upper boundary and are colored green, it means that the market is in an uptrend. Red bars crossing the lower blue line indicate a downward trend. The red or green columns are further referred as signal bars.
The indicator is based on the normalized momentum oscillator raised to the third power. This is done to increase the sensitivity of the indicator and to emphasize the difference between the market modes.
The indicator can be used in different ways. One of them is determining the trend direction based on the last signal bar. Even if the current indicator bar is blue (showing range or consolidation), the user should consider the longer-term market mode as upward if the last signal bar is green. And vice versa, if the last signal bar is red, the current market bias is downward. One other way to use the indicator is to catch active price impulses, when columns of the same color (red or green) appear consecutively.

DMI Stochastic Momentum IndexConcepts
This is an improved version of the "DMI Stochastic Extreme Refurbished" indicator.
For more information on the main concepts of this indicator, please access this link:
The difference is that here, instead of using the traditional stochastic oscillator, I implemented the use of the Stochastic Momentum Index (SMI).
Stochastic Momentum Index (SMI)
The SMI is considered a refinement of the stochastic oscillator.
It calculates the distance of the current closing price as it relates to the median of the high/low range of price.
William Blau developed the SMI, which attempts to provide a more reliable indicator, less subject to false swings.
The original stochastic is limited to values from 0 to 100, while the SMI varies between the range of -100 to 100.
(Investopedia)
It is worth mentioning that the SMI presented in this script applies to the DMI value, not the screen price.

OMA-Filtered Kase Permission Stochastic [Loxx]OMA-Filtered Kase Permission Stochastic is a special implementation of Kase Permission Stochastic by Kase StatWare.
What is Kase StatWare?
Kase StatWare has been around since 1992 and is a technical analysis trading indicator package developed by the acclaimed market technician and former energy trader Cynthia A. Kase. StatWare’s self-optimizing indicators help professional and individual traders to form a precise and systematic approach to discretionary trading and trade risk management.
Kase StatWare creates subscription-based technical analysis tools mainly for Stocks and Futures trading which can be subscribed to at a monthly cost.
What is Kase Permission Stochastic?
The Kase Permission Stochastic is a momentum indicator that examines a synthetic longer bar length, that by default, is three (5x by default for this implementation here) times higher than the bar length it is plotted against.
Included
Alerts
Signals
Bar coloring

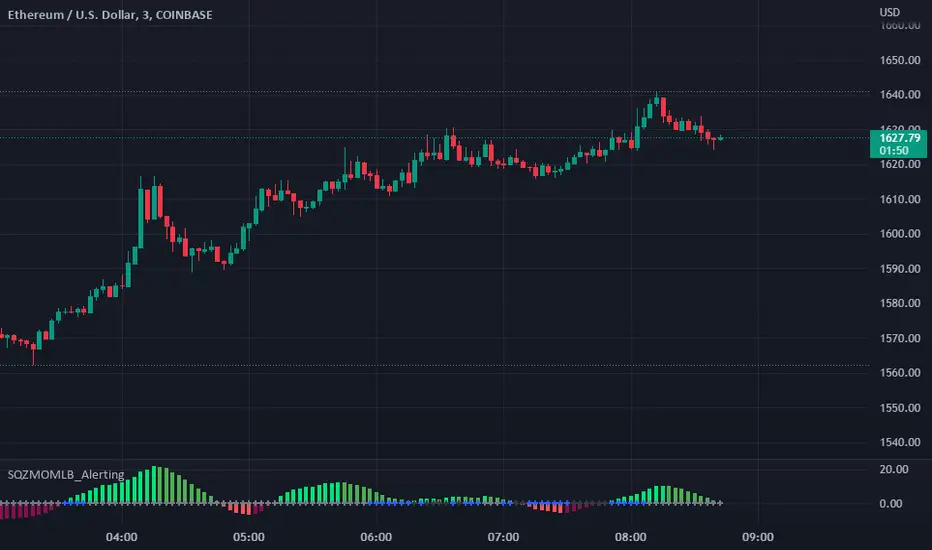
Squeeze Momentum Indicator [LazyBear] added Alerting + webhookA modified version of Squeeze Momentum Indicator visualizing on Price Chart.
author: @LazyBear, modified by @KivancOzbilgic, and by @dgtrd
I took in all of the information as the script below is based on the V2 Script that @LazyBear posted and then added Alerting based on the math and the conditions that @dgtrd added.
Per the description here:
The Squeeze Indicator measures the relationship between Bollinger Bands and Keltner's Channels to help identify consolidations and signal when prices are likely to break out (whether up or down).
The Squeeze Indicator finds sections of the Bollinger Bands which fall inside the Keltner's Channels, and in this case, the market is said to be in a squeeze (indicator turns off, displayed with grey diamond shapes in this study).
When the volatility increases, so does the distance between the bands. Conversely, when the volatility declines, the distance also decreases, and in such cases, the squeeze is said to be released (indicator turns on, displayed with triangle up or triangle down shapes)
Taking the above information and what was in the script was able to base the alert conditions:
So when the condition:
Squeeze On or No Squeeze = In Squeeze
Squeeze Off = Squeeze Release Long or Squeeze Release Long based off conditions.
There are 2 separate alert Types.
1. App, Pop-up, eMail, play sound and Send email to SMS
2. It Is dedicated to Webhook for your various applications.
Alerting Options
i.imgur.com
App Notification
i.imgur.com
i.imgur.com
Webhook test into Discord
i.imgur.com
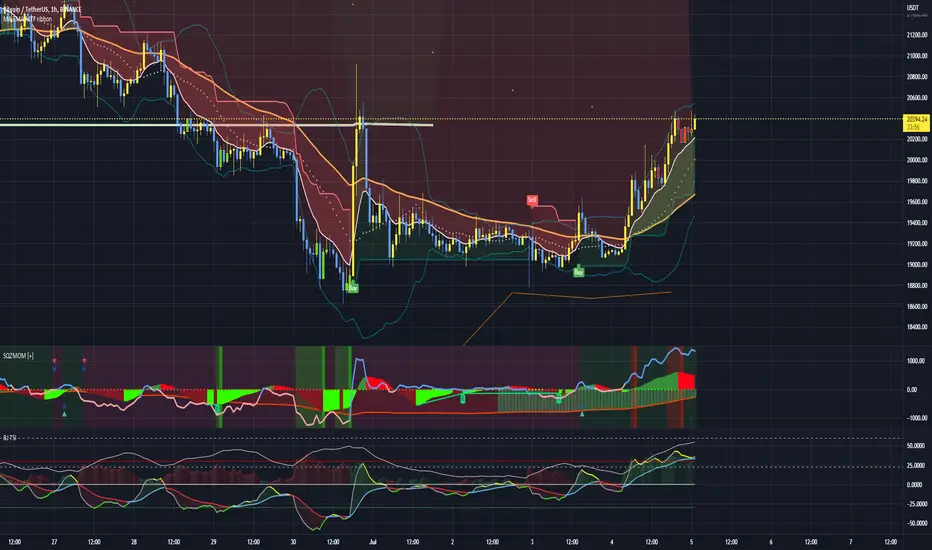
Squeeze Momentum Indicator + 2.0This is a squeeze momentum oscillator with ADX-RSI, Elliot waves oscillator, HMA background and more.
I recommend configure ADX-RSI with the following settings:
-ADX Length = 14
-ADX smooth = 14
-RSI Length = 14
-Threshold = 15
-Upline = 70
-Downline = 30
Thanks to OskarGallard for develop this indicator.
I am Sc4lp1ng, the developer of EMA MTF cloud and TSI-ADX Histogram.
Squeeze Momentum 3# Squeeze Momentum 3
First of All, I would like to give my gratitude to for the initital script's idea.
This is my own version of SQZMOM. I had revised all equations and parameters according to Investopedia.
Still, no matter how much we stick to the indicator, the indicator can not see the future.
Trading results vary from time to time. In my opinion, SQZMOM is great for speculating under 4H timeframe.
Remarks;
- implement horizontal shift
- revised all equations. Unfortunately, there is no magic params.
- Be careful with your money management
- Good Luck

Market Sector Scanner/Screener With MOM + RSI + MFI + DMI + MACDMARKET SECTOR SCANNER/SCREENER MOM + RSI + MFI + DMI + MACD FOR STOCKS CRYPTO & FOREX
This script scans 9 markets constantly and returns the values of 5 different popular indicators.
This indicator helps you see when one of your favorite stocks is bullish or bearish when you are not watching that chart so you can always catch the big moves as they happen.
***HOW TO USE***
A great way to use this market screener is to set up separate chart layouts for each sector you like to trade. Such as the top 9 stocks in the S & P 500, top 9 stocks in the XLF etf, etc. Make sure to set up separate chart layouts in Tradingview so you don’t have to change the symbols constantly. This will give you a good idea in real time if that entire sector is bullish, bearish or mixed. When the entire grid goes red or green, those are very strong signs of market direction across that entire sector, so trades in the corresponding direction are quite safe.
This can be done for crypto as well, using the top 9 cryptocurrencies by market cap. Watch the grid and wait for the entire lot to turn green or red and then take a position in that direction.
You can also use this with a variety of your favorite tickers so you can see when specific markets are looking strong in either direction, instead of constantly changing charts or missing good opportunities because you weren’t watching that specific chart.
This grid can also be used to determine how long to hold a position as well. If the entire grid is still green or red, according to your trade direction, you can usually expect price to continue in that direction until you see some conflicting colors start to pop up on the grid. As it starts to give mixed signals, you can expect the market to be indecisive or reverse which is a good time to get out.
If you have your scanner setup to show similar markets in one sector, be careful taking trades when the grid is very mixed in color. This shows signs of indecision and will likely have choppy price action until the market decides a direction so make sure to use caution when the grid is mixed. It is best to wait for the entire grid to turn green or red and then take position.
***COLOR MEANINGS***
When each indicator value is in bullish territory, the background of that value will turn green.
When each indicator value is in bearish territory, the background of that value will turn red.
When each indicator value is in neutral territory, the background of that value will turn blue.
When all 5 indicators for a ticker are bullish, the ticker background will turn green.
When all 5 indicators for a ticker are bearish, the ticker background will turn red.
When there is a mixture of bullish and bearish values, the ticker background will turn blue.
***CUSTOMIZATION***
You can customize which tickers are in your scanner including stocks, crypto, futures and forex, the source of the indicators, the length of the indicator settings and the smoothing parameters.
***INDICATORS USED***
The indicators used for each ticker are as follows:
Momentum(MOM) - Default length is 14. Bullish is above zero, bearish is below zero.
Relative Strength Index(RSI) - Default length is 14. Bullish is above 50, bearish is below 50.
Money Flow Index(MFI) - Default length is 14. Bullish is above 50, bearish is below 50.
Directional Movement Index(DMI) - Default length is 14 and smoothing is 14. Calculated by subtracting di minus from di plus. If the value is positive, it is bullish. If the value is negative, it is bearish.
Moving Average Convergence & Divergence(MACD) - Default settings are 12, 26, 9. If the short line is greater than the long line, then it is bullish. If the short line is less than the long line, it is bearish.
***MARKETS***
This market scanner can be used as a signal on all markets, including stocks, crypto, futures and forex.
***TIMEFRAMES***
This scanner can be used on all timeframes and pulls data from other tickers using the same timeframe as what your current chart is set to.
***TIPS***
Try using numerous indicators of ours on your chart so you can instantly see the bullish or bearish trend of multiple indicators in real time without having to analyze the data. Some of our favorites are Trend Friend Scalp & Swing Signals, Auto Fibonacci, Directional Movement Index, Volume Profile With Buy/Sell Pressure, Auto Support And Resistance and Money Flow Index in combination with this Scanner. They all have real time Bullish and Bearish labels as well so you can immediately understand each indicator's trend.

Dynamic Momentum Ecosystem Futures verI've reuploaded my previous uploaded script Dynamic Momentum Ecosystem, but this one specifically catered to futures trading.
The idea and underlying script function as usual.
Lime = Price closed higher + volume transacted higher than average + MACD Histogram increases + 13 EMA increases
Green = Price closed higher + MACD Histogram increases + 13 EMA increases
Red = Price closed lower + MACD Histogram decreases + 13 EMA decreases
Blue = Either MACD Histogram increases/decreases + 13 EMA increases/decreases
Lime candle is viewed as a robust bullish sign as price increases, supported by the rising MACD Histogram, 13EMA, and higher than average volumes transacted. Perfect for dip buying near the 20/50 MAs.
Green candle is viewed as bullish with the rising of MACD Histogram and EMA . Good for dip buying near the 20/50 MAs.
Red candle is viewed as bearish with the declining of MACD Histogram and EMA . Good for short entry. Can also be the early sign to take profits, as it could be the preliminary signal for trend reversal.
Blue candle is viewed as neutral.
The upper dotted purple line is the 52candles high.
The vertical grey line appears when the price > MA50 crosses above MA200, which is a golden crossover.
Traders are advised to time their entry using the impulse coloring system for stocks that are trading near the dotted line, following the grey line formation.

Leonidas Squeeze Momentum SystemThis indicator is based on LazyBear SQ Momentum Indicator and SQ Plus Indicator.
This indicator is using ADX and Squeeze Momentum Indicator.
When you see the ADX above 0 line and the slop is positive that means the trend is strong
When the ADX is below 0 line and the trend is weak you will see the slop negative and the color gray
When we see the SQ changing the color from Red to Yellow that means the sell pressure is decreasing this could be a potential buy signal
When we see the color changing from blue to dark blue that means the buy pressure is decreasing this could be a a potential sell signal
Bull/Bear divergences supported
Added SQ signal
this signal is an exponential moving average following the SQ main signal useful for filtering fake signals.
This indicator is very powerful but offers many fake signals it is recommended using this indicator with other indicators to confirm the entries
