Momentum Table - Felipe📊 Momentum Table – By Felipe
This multi-timeframe momentum dashboard displays a clean and color-coded overview of key trend and momentum indicators across 6 major timeframes (5m to 1W), directly on your chart. It’s ideal for quickly identifying market strength, trend alignment, and potential reversals at a glance.
🔍 Features:
EMA Trend Check (EMA 9, 20, 100, 200):
Compares the current close against each EMA.
✅ Green check = price is above the EMA (bullish bias).
🔻 Red arrow = price is below the EMA (bearish bias).
Visual trend alignment helps you spot strong directional setups.
RSI (Relative Strength Index):
Displays current RSI (14) value per timeframe.
Background color highlights momentum conditions:
🔴 Red = Overbought (>70)
🟢 Green = Oversold (<30)
⚪ Gray = Neutral
Stochastic RSI:
Uses Stoch RSI applied to RSI (14) for sensitivity.
Background color follows the same logic as RSI for quick visual cues.
Compact Visual Table:
Located in the bottom-right corner.
Clean design with headers and rows labeled by timeframe.
Helps traders monitor trend and momentum confluence across multiple timeframes in real time.
This tool supports momentum-based strategies, EMA stacking confirmation, and multi-timeframe alignment, making it ideal for scalpers, swing traders, and trend followers alike.
Cari dalam skrip untuk "momentum"

Momentum Zones [TradersPro]OVERVIEW
The Momentum Zones indicator is designed for momentum stock traders to provide a visible trend structure with actionable price levels. The indicator has been designed for high-growth, bullish stocks on a daily time frame but can be used on any chart and timeframe.
Momentum zones help traders focus on the momentum structure of price, enabling disciplined trading plans with specific entry, exit, and risk management levels.
It is built using CCI values, allowing for fixed trend range calculations. It is most effective when applied to screens of stocks with high RSI, year-to-date (YTD) price gains of 25% or higher, as well as stocks showing growth in both sales and earnings quarter-over-quarter and year-over-year.
CONCEPTS
The indicator defines and colors uptrends (green), downtrends (red), and trends in transition or pausing (yellow).
The indicator can be used for new trend entry or trend continuation entry. New trend entry can be done on the first green bar after a red bar. Trend continuation entries can be done with the first green bar after a yellow bar. The yellow transition zones can be used as price buffers for stop-loss management on new entries.
To see the color changes, users need to be sure to uncheck the candlestick color settings. This can be done by right-clicking the chart, going to Symbols, and unchecking the candle color body, border, and wick boxes.
Remember to check them if the indicator is turned off, or the candles will be blank with no color.
The settings also correspond to the screening function to get a list of stocks entering various momentum zones so you can have a prime list of the stocks meeting any other fundamental criteria you may desire. Traders can then use the indicator for the entry and risk structure of the trading plan.

Momentum Performance This Indicator displays the momentum (performance) of the symbol in percent.
You can compare the performance with other symbols.
The default benchmarks are the S&P 500, the MSCI World and the FTSE All World EX US.
The default length corresponds to one year in the timeframes monthly, weekly and daily.
In intraday the default length is 200, but you can also set your own setting.
You have also the opportunity to display a average momentum performance of the main symbol.

Momentum Indicator avg short return minus avg long returnAverage daily return over the period 2-12 months ago minus the average daily return over the period 1-5 years ago
=> a higher return 2-12 months ago indicates a higher return in coming months according to research, because of the momentum risk factor premium
=> a higher return 1-5 years ago indicates a lower return in coming months according to research, because of the momentum risk factor premium

Momentum Acceleration by DGTItalian physicist Galileo Galilei is usually credited with being the first to measure speed by considering the distance covered and the time it takes. Galileo defined speed as the distance covered during a period of time. In equation form, that is v = Δd / Δt where v is speed, Δd is change in distance, and Δt is change in time. The Greek symbol for delta, a triangle (Δ), means change.
Is the speed getting faster or slower?
Acceleration will be the answer, acceleration is defined as the rate of change of speed over a set period of time, meaning something is getting faster or slower. Mathematically expressed, acceleration denoted as a is a = Δv / Δt , where Δv is the change in speed and Δt is the change in time.
How to apply in trading
Lets think about Momentum, Rate of Return, Rate of Change all are calculated in almost same approach with Speed
Momentum measures change in price over a specified time period,
Rate of Change measures percent change in price over a specified time period,
Rate of Return measures the net gain or loss over a specified time period,
And Speed measures change in distance over a specified time period
So we may state that measuring the change in distance is also measuring the change in price over a specified time period which is length, hence
speed can be calculated as (source – source )/length and acceleration becomes (speed – speed )/length
In this study acceleration is used as signal line and result plotted as arrows demonstrating bull or bear direction where direction changes can be considered as trading setups
Just a little fun, since we deal with speed the short name of the study is named after famous cartoon character Speedy Gonzales
Trading success is all about following your trading strategy and the indicators should fit within your trading strategy, and not to be traded upon solely
Disclaimer: The script is for informational and educational purposes only. Use of the script does not constitutes professional and/or financial advice. You alone the sole responsibility of evaluating the script output and risks associated with the use of the script. In exchange for using the script, you agree not to hold dgtrd TradingView user liable for any possible claim for damages arising from any decision you make based on use of the script

Momentum Linear RegressionThe original script was posted on ProRealCode by user Nicolas.
This is an indicator made of the linear regression applied to the rate of change of price (or momentum). I made a simple signal line just by duplicating the first one within a period decay in the past, to make those 2 lines cross. You can add more periods decay to made signal smoother with less false entry.


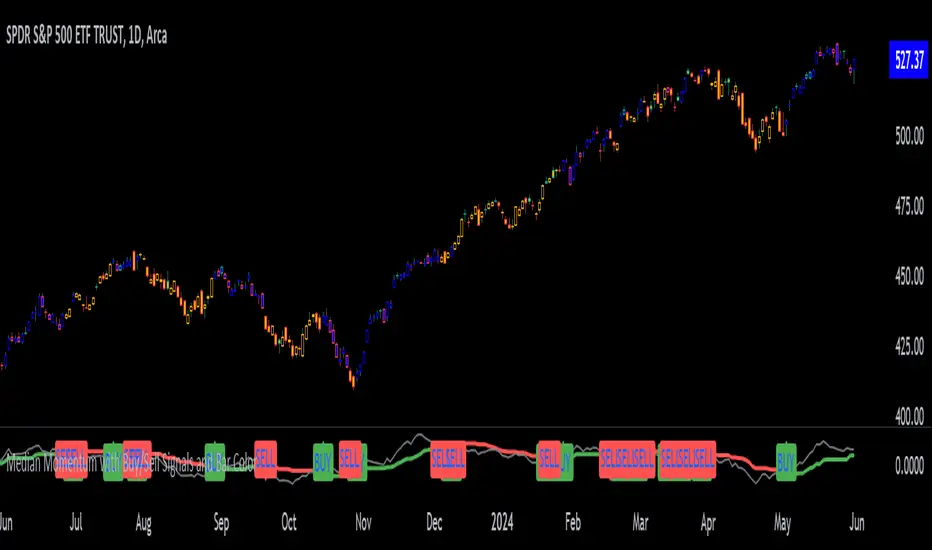
Median Momentum with Buy/Sell Signals and Bar ColorMomentum Calculation:
Momentum is calculated as the difference between the current close price and the close price momentum_length periods ago: momentum = close - close .
Highest and Lowest Momentum:
The highest and lowest momentum values over the specified length are calculated.
Median Momentum:
The median momentum is calculated as the average of the highest and lowest momentum values.
Color Setting:
medianColor is set based on whether the momentum is above, below, or equal to the median momentum.
barColor is set similarly for bar coloring.
Plotting:
The script plots the median momentum and the actual momentum values.
Buy and sell signals are generated when momentum crosses over or under the median momentum.
The script also plots the buy and sell signals with arrows on the chart.
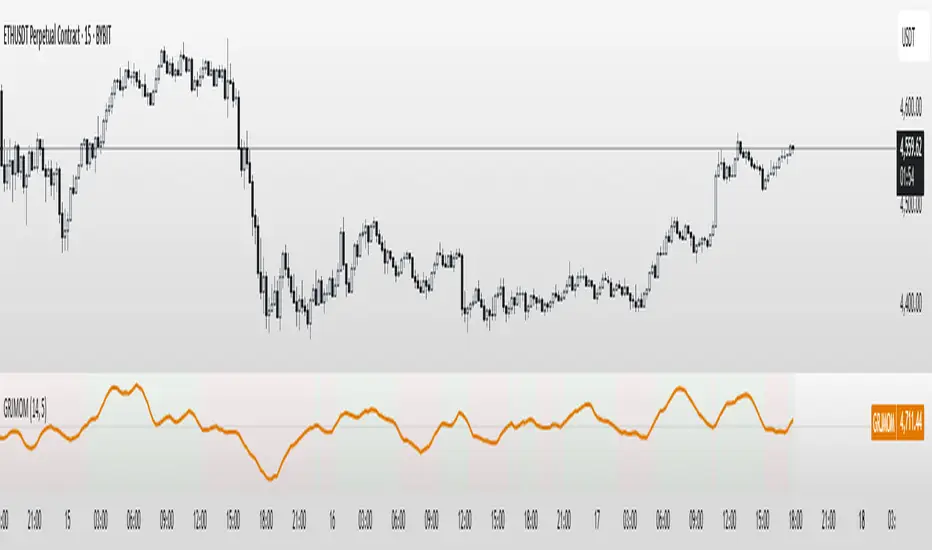
GRJMOM - Risk-Adjusted MomentumGRJMOM – Risk-Adjusted Momentum
GRJMOM stands for Generalized Risk-Adjusted Momentum. This indicator adjusts traditional momentum by dividing it by realized volatility over the same formation period. The result is a cleaner, more risk-sensitive momentum signal designed to avoid momentum crashes and volatility-driven false breakouts.
How it works:
Calculates raw momentum: Close - Close
Computes realized volatility using standard deviation of log returns
Outputs a risk-adjusted momentum score (Momentum / Volatility)
Optional smoothing can be applied to reduce short-term noise
Background coloring highlights bullish (green) and bearish (red) regimes
Use Cases:
GRJMOM > 0 suggests a bullish risk-adjusted trend
GRJMOM < 0 indicates a weakening or bearish trend
Can be used as a trend confirmation filter
Pairs well with cycle indicators like HHT or FFT for timing
Best for:
Swing traders, trend followers, and systematic strategy builders looking for smarter momentum signals with built-in risk awareness
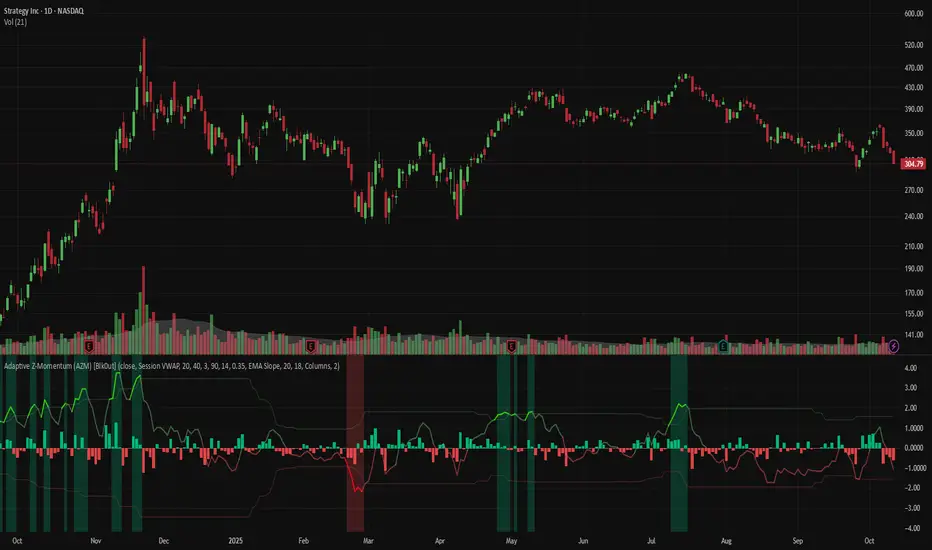
Adaptive Z-Momentum (AZM) [Blk0ut]Adaptive Z-Momentum (AZM) is a momentum indicator that expresses the normalized deviation of price from a dynamic anchor (VWAP or EMA) in standard-score (z-score) terms, with adaptive “extreme” thresholds, trend sensitivity, and optional regime filtering. The line color, background shading, and labels help you visually discern when momentum is mild, building, or overextended.
---
## Features & Concept
* Computes **z = (price – anchor) / σ**, where the anchor is either Session VWAP (intraday) or EMA (non-intraday).
* Uses exponential moving averages (EWMA) to adaptively estimate the running mean and variance, making the indicator responsive to regime changes.
* Defines an **adaptive extreme threshold** (±z threshold) based on the chosen percentile of |z| over a lookback window (e.g. 90th percentile) — dynamically adjusting to volatility environment.
* Colors the main z-line **differently when inside vs. outside the extreme thresholds**, giving immediate visual feedback.
* Optionally shades the background when momentum is over the extremes (bullish or bearish).
* Supports a **self-tuning mode** (ADX-aware) that tightens or relaxes lookback/smoothing in strong trend vs. chop regimes.
* Regime filtering options (EMA slope or ADX threshold) let you filter signals in trend vs. non-trend markets.
* Plots Δz (the change in z) in various styles to help detect acceleration or deceleration in momentum.
* Adds optional thrust/fade labels to highlight when z crosses ±extreme zones, or when momentum stalls.
---
## How to Use
* Look for **z crossing** above zero (bullish momentum) or below zero (bearish momentum).
* When **z enters the extreme band**, it suggests strong momentum; when it exits, that may indicate exhaustion or reversal.
* Watch **Δz** (momentum acceleration) for clues of weakening or strengthening momentum before z itself reacts.
* Use the **regime filter** to enforce that signals only count in favorable directional markets.
* Customize inputs: lookback window, smoothing length, extreme percentile, ADX/auto settings, colors, etc., to match your trading style and timeframe.
*Use VWAP as the anchor on intraday/session charts — because it resets each session, it highlights deviations from session “fair value” and captures volume-flow bias.
*Use EMA on swing or multi-day charts — it doesn’t reset, so it preserves trend structure and gives a smoother momentum baseline across sessions.
*In trending markets, EMA tends to deliver more reliable momentum extremes; in range or mean-reversion regimes, VWAP often gives more intuitive reversal zones.
---
## Limitations & Disclaimers
* Like all indicators, AZM is **lagging** (though adaptive) and should not be used as a standalone entry/exit trigger — always combine with price action, structure, or confirmation.
* The extreme thresholds are **percentile-based**, meaning in very quiet or very noisy periods, “extreme” may shift rapidly; use your eyes alongside the indicator.
* Because the script uses historical data and smoothing, earlier bars may differ from real-time behavior.
* Past behavior is no guarantee of future performance. Use proper risk management and test ideas on historical data before trading live.
---
## Inputs & Customization
* **Anchor** mode: Session VWAP (intraday) or EMA
* **Lookback window** and **smoothing EMA** for computing z
* **Extreme percentile** (e.g. 90) to define ±z thresholds
* **Auto / ADX-based tuning** to allow dynamic parameter changes in trending vs chop markets
* **Regime filter** (EMA slope or ADX) to restrict signals to trending conditions
* **Color settings** for inside vs outside extremes, background shading, zero line, Δz style, labels, etc.
* **Show/hide labels**, choose Δz style (columns, histogram, line, etc.)
---
## Why It’s Useful
By combining standard-score normalization with adaptive thresholds and regime sensitivity, AZM helps you see **relative momentum extremes** in a way that adjusts to market regime shifts. The dual visual cues (line color + background) reduce ambiguity at a glance.
---
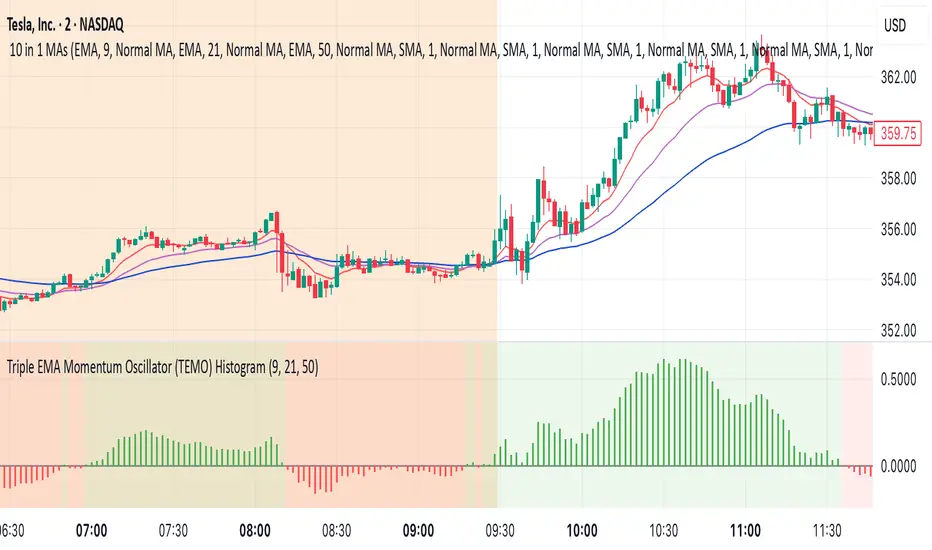
Triple EMA Momentum Oscillator (TEMO) HistogramThis Pine Script code replicates the Python indicator you provided, calculating the Triple EMA Momentum Oscillator (TEMO) and generating signals based on its value and momentum.
Explanation of the Code:
User Inputs:
Allows you to adjust the periods for the short, mid, and long EMAs.
Calculate EMAs:
Computes the Exponential Moving Averages for the specified periods.
Calculate EMA Spreads (Distances):
Finds the differences between the EMAs to understand the spread between them.
Calculate Spread Velocities:
Determines the change in spreads from the previous period, indicating momentum.
Composite Strength Score:
Weighted calculation of the spreads normalized by the EMA values.
Velocity Accelerator:
Weighted calculation of the velocities normalized by the EMA values.
Final TEMO Oscillator:
Combines the spread strength and velocity accelerator to create the TEMO.
Generate Signals:
Signals are generated when TEMO is positive and increasing (buy), or negative and decreasing (sell).
Plotting:
Zero Line: Helps visualize when TEMO crosses from positive to negative.
TEMO Oscillator: Plotted with green for positive values and red for negative values.
Signals: Displayed as a histogram to indicate buy (1) and sell (-1) signals.
Usage:
Buy Signal: When TEMO is above zero and increasing.
Sell Signal: When TEMO is below zero and decreasing.
Note: This oscillator helps identify momentum changes based on EMAs of different periods. It's useful for detecting trends and potential reversal points in the market.
Fat Tony's Composite Momentum Histogram (v01)# Fat Tony's Composite Momentum Histogram
## What It Does
This indicator combines four momentum oscillators into a single composite signal that ranges approximately from -100 to +100. It identifies potential overbought and oversold conditions while weighting signals by volume activity to filter out weak moves.
The histogram shows momentum strength with color-coded bars:
- **Red bars** indicate extreme overbought conditions (above +100)
- **Green bars** indicate extreme oversold conditions (below -100)
- **Blue bars** show positive momentum in normal range
- **Orange bars** show negative momentum in normal range
## Core Components
The indicator blends these four momentum measures:
1. **Williams %R** - Measures where price closed relative to the high-low range
2. **Stochastic %K** - Compares closing price to the recent price range
3. **MACD Histogram** - Shows momentum changes via moving average convergence/divergence
4. **ROC (Rate of Change)** - Measures percentage price change, normalized by volatility
Each component is scaled to a -50 to +50 range, then averaged together. The MACD component uses adaptive scaling based on its historical volatility to remain relevant across different market conditions.
## Volume Weighting
The indicator amplifies signals when volume is elevated and dampens them when volume is low. It uses a logarithmic scaling approach to smooth extreme volume spikes. There's also a minimum volume filter that prevents signals from triggering during very low-volume periods.
## Settings Explained
**Momentum Settings:**
- **Length (14)** - Lookback period for Williams %R and Stochastic calculations
- **MACD Fast/Slow/Signal (12/26/9)** - Standard MACD parameters
- **ROC Length (10)** - Lookback for rate of change calculation
- **MACD StDev Length (200)** - Historical window for normalizing MACD values
**Levels:**
- **Overbought Level (+100)** - Threshold for extreme upside momentum
- **Oversold Level (-100)** - Threshold for extreme downside momentum
**Volume Settings:**
- **Enable Volume Weighting** - Toggle volume amplification on/off
- **Volume Sensitivity (1.5)** - Controls how much volume impacts the signal (higher = stronger impact)
- **Min Avg Volume (50,000)** - Filters out signals when 5-bar average volume is too low
**Components:**
- **Include ROC Component** - Toggle to add/remove ROC from the calculation
- **Enable Trend Filter** - Only allows signals aligned with the 200-period EMA trend
- **Show Component Plots** - Displays individual oscillator values for tuning purposes
## Trading Signals
**Entry Signals:**
- **Long (green triangle)** - Composite crosses above the oversold level with adequate volume
- **Short (red triangle)** - Composite crosses below the overbought level with adequate volume
**Exit Signals (when trend filter enabled):**
- **Long Exit** - Composite crosses below zero from positive territory
- **Short Exit** - Composite crosses above zero from negative territory
The indicator also provides alert conditions for automated notifications on these signal events.

Clenow MomentumClenow Momentum Method
The Clenow Momentum Method, developed by Andreas Clenow, is a systematic, quantitative trading strategy focused on capturing medium- to long-term price trends in financial markets. Popularized through Clenow’s book, Stocks on the Move: Beating the Market with Hedge Fund Momentum Strategies, the method leverages momentum—an empirically observed phenomenon where assets that have performed well in the recent past tend to continue performing well in the near future.
Theoretical Foundation
Momentum investing is grounded in behavioral finance and market inefficiencies. Investors often exhibit herding behavior, underreact to new information, or chase trends, causing prices to trend beyond fundamental values. Clenow’s method builds on academic research, such as Jegadeesh and Titman (1993), which demonstrated that stocks with high returns over 3–12 months outperform those with low returns over similar periods.
Clenow’s approach specifically uses **annualized momentum**, calculated as the rate of return over a lookback period (typically 90 days), annualized to reflect a yearly percentage. The formula is:
Momentum=(((Close N periods agoCurrent Close)^N252)−1)×100
- Current Close: The most recent closing price.
- Close N periods ago: The closing price N periods back (e.g., 90 days).
- N: Lookback period (commonly 90 days).
- 252: Approximate trading days in a year for annualization.
This metric ranks stocks by their momentum, prioritizing those with the strongest upward trends. Clenow’s method also incorporates risk management, diversification, and volatility adjustments to enhance robustness.
Methodology
The Clenow Momentum Method involves the following steps:
1. Universe Selection:
- A broad universe of liquid stocks is chosen, often from major indices (e.g., S&P 500, Nasdaq 100) or global exchanges.
- Filters should exclude illiquid stocks (e.g., low average daily volume) or those with extreme volatility.
2. Momentum Calculation:
- Stocks are ranked based on their annualized momentum over a lookback period (typically 90 days, though 60–120 days can be common tests).
- The top-ranked stocks (e.g., top 10–20%) are selected for the portfolio.
3. Volatility Adjustment (Optional):
- Clenow sometimes adjusts momentum scores by volatility (e.g., dividing by the standard deviation of returns) to favor stocks with smoother trends.
- This reduces exposure to erratic price movements.
4. Portfolio Construction:
- A diversified portfolio of 10–25 stocks is constructed, with equal or volatility-weighted allocations.
- Position sizes are often adjusted based on risk (e.g., 1% of capital per position).
5. Rebalancing:
- The portfolio is rebalanced periodically (e.g., weekly or monthly) to maintain exposure to high-momentum stocks.
- Stocks falling below a momentum threshold are replaced with higher-ranked candidates.
6. Risk Management:
- Stop-losses or trailing stops may be applied to limit downside risk.
- Diversification across sectors reduces concentration risk.
Implementation in TradingView
Key features include:
- Customizable Lookback: Users can adjust the lookback period in pinescript (e.g., 90 days) to align with Clenow’s methodology.
- Visual Cues: Background colors (green for positive, red for negative momentum) and a zero line help identify trend strength.
- Integration with Screeners: TradingView’s stock screener can filter high-momentum stocks, which can then be analyzed with the custom indicator.
Strengths
1. Simplicity: The method is straightforward, relying on a single metric (momentum) that’s easy to calculate and interpret.
2. Empirical Support: Backed by decades of academic research and real-world hedge fund performance.
3. Adaptability: Applicable to stocks, ETFs, or other asset classes, with flexible lookback periods.
4. Risk Management: Diversification and periodic rebalancing reduce idiosyncratic risk.
5. TradingView Integration: Pine Script implementation enables real-time visualization, enhancing decision-making for stocks like NVDA or SPY.
Limitations
1. Mean Reversion Risk: Momentum can reverse sharply in bear markets or during sector rotations, leading to drawdowns.
2. Transaction Costs: Frequent rebalancing increases trading costs, especially for retail traders with high commissions. This is not as prevalent with commission free trading becoming more available.
3. Overfitting Risk: Over-optimizing lookback periods or filters can reduce out-of-sample performance.
4. Market Conditions: Underperforms in low-momentum or highly volatile markets.
Practical Applications
The Clenow Momentum Method is ideal for:
Retail Traders: Use TradingView’s screener to identify high-momentum stocks, then apply the Pine Script indicator to confirm trends.
Portfolio Managers: Build diversified momentum portfolios, rebalancing monthly to capture trends.
Swing Traders: Combine with volume filters to target short-term breakouts in high-momentum stocks.
Cross-Platform Workflow: Integrate with Python scanners to rank stocks, then visualize on TradingView for trade execution.
Comparison to Other Strategies
Vs. Minervini’s VCP: Clenow’s method is purely quantitative, while Minervini’s Volatility Contraction Pattern (your April 11, 2025 query) combines momentum with chart patterns. Clenow is more systematic but less discretionary.
Vs. Mean Reversion: Momentum bets on trend continuation, unlike mean reversion strategies that target oversold conditions.
Vs. Value Investing: Momentum outperforms in bull markets but may lag value strategies in recovery phases.
Conclusion
The Clenow Momentum Method is a robust, evidence-based strategy that capitalizes on price trends while managing risk through diversification and rebalancing. Its simplicity and adaptability make it accessible to retail traders, especially when implemented on platforms like TradingView with custom Pine Script indicators. Traders must be mindful of transaction costs, mean reversion risks, and market conditions. By combining Clenow’s momentum with volume filters and alerts, you can optimize its application for swing or position trading.

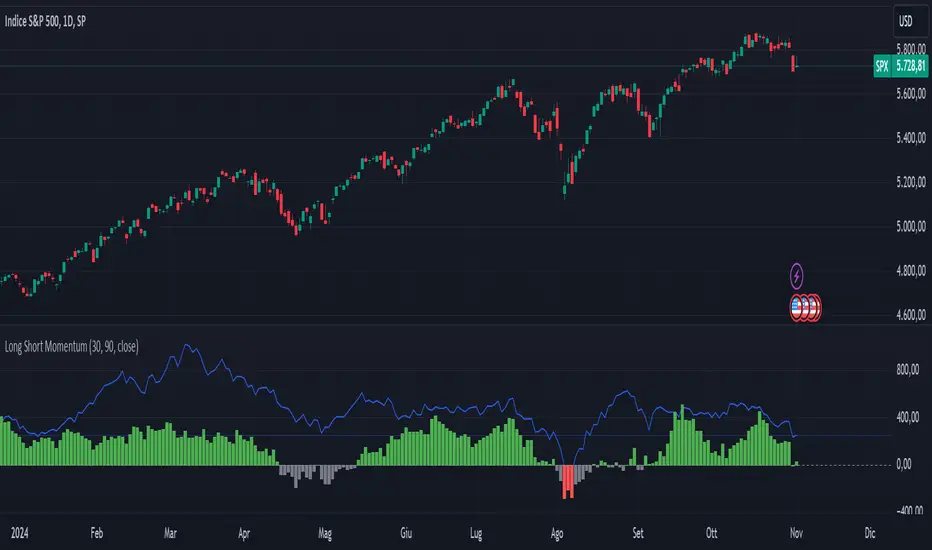
Long Short MomentumThis indicator is designed to visualize short-term and long-term momentum trends.The indicator calculates two momentum lines based on customizable lengths: a short momentum (Short Momentum) over a smaller period and a long momentum (Long Momentum) over a longer period. These lines are plotted relative to the chosen price source, typically the closing price.
The histogram, colored dynamically based on momentum direction, gives visual cues:
Green: Both short and long momentum are positive, indicating an upward trend.
Red: Both are negative, indicating a downward trend.
Gray: Mixed momentum, suggesting potential trend indecision.
Basic Polychromatic Momentum IndicatorBasic Polychromatic Momentum Indicator with alerts
PMI involves taking the difference between the current price and the price n periods ago, and then subtracting from it the difference between the current price and the price n periods ago, divided by n. This gives a smoothed version of the momentum indicator.
The user can also specify a smoothing factor using the "smoothing" input, which applies a simple moving average to the PMI. The resulting smoothed PMI is plotted on the chart in blue, with a dotted gray line at the zero level.

Polychromatic Momentum IndicatorPolychromatic Momentum is a generalized Momentum study considering a number of Momentum values controlled by the length input. The greatest weight is given to the most recent Momentum value, while the precedent values are given lesser weight. Each Momentum value is assigned weight equal to inverse square root of Momentum distance (number of bars prior to the current bar). Then the sum of the weighted Momentum values is divided by the sum of the square roots.

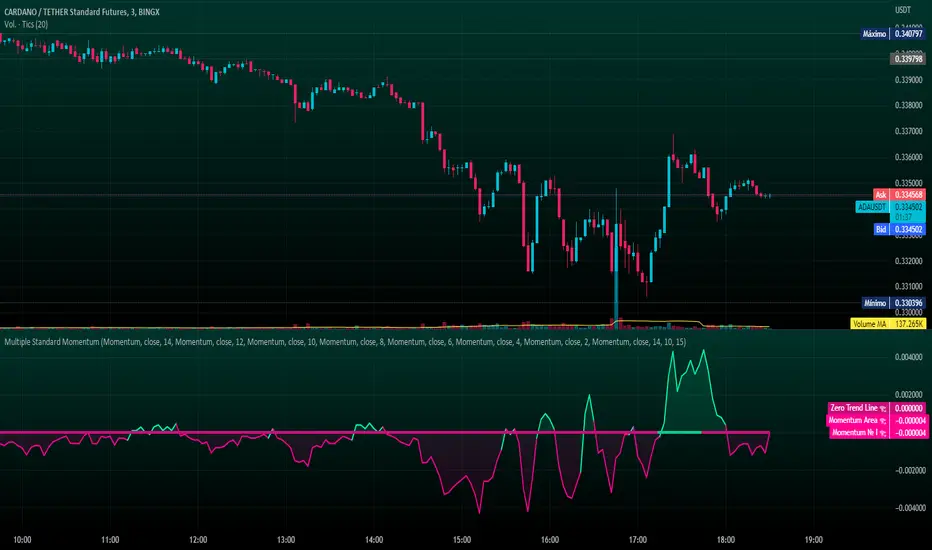
Multiple Standard MomentumMultiple Standard Momentum
The momentum indicator is a technical indicator that measures the speed and strength of the price movement of a financial asset. This indicator is used to identify the underlying strength of a trend and predict potential changes in price direction.
The calculation of the momentum indicator is based on the difference between the current price and the price of a previous period. The result is displayed on a chart, which can be positive or negative, depending on whether the current price is higher or lower than the price of the previous period. The indicator can be used on any time frame, but is generally used on short-term charts.
To use the momentum indicator , you look for two types of signals:
🔹 Crossover Signal – When the indicator crosses the zero line, it can signal a change of direction in the price trend.
🔹 Divergence – When the asset price moves in one direction and the indicator moves in the opposite direction, a divergence can be identified. This divergence may indicate a possible trend reversal.
COMPOSITION AND MODE OF USE OF THE INDICATOR
🔹 This indicator displays multiple Momentum levels on a single chart, allowing you to view multiple Momentum lines. Each level is represented on the chart where it can be hidden or shown as desired for better market analysis.
🔹 In addition, a zero trend line (also known as a horizontal trend line) has been added. The zero trend line is a horizontal line that indicates the point at which the current price equals the opening price, which allows users to draw a custom zero trend line on the chart using different colors and time periods of calculation.
* Highest performing custom setup for the Zero Trend Line. For Operations of:
- One Minute: Trend Line Time Frame = Five Minutes.
- Three Minutes: Trend Line Time Frame = Fifteen Minutes.
- Five Minutes: Trend Line Time Frame = Thirty Minutes.
- Fifteen Minutes: Trend Line Time Frame = Sixty Minutes.
Rules For Trading
🔹 Bullish:
* The Zero Trend Line must be in Green Color.
* When the Momentum Line Crosses the Zero Line from Bottom to Top.
🔹 Bearish:
* The Zero Trend Line must be in Red Color.
* When the Momentum Line Crosses the Zero Line from Top to Bottom.
In addition, parameters were defined to activate or deactivate the graphic signal taking into account the previous requirement (Bullish and Bearish):
🔹 Long or Buy = ▲
🔹 Short or Sell = ▼
This script can be used in different markets such as forex, indices, and cryptocurrencies for analysis and trading. However, it is important to note that no trading strategy is guaranteed to be profitable, and traders should always conduct their own research and risk management.
EMA Ribbon + ADX MomentumHere's a description for your TradingView indicator publication:
The EMA Ribbon + ADX Momentum indicator combines exponential moving averages (EMA) with the Average Directional Index (ADX) to identify strong trends and potential trading opportunities. This powerful tool offers:
🎯 Key Features:
EMA Ribbon (10, 21, 34, 55) for trend direction
ADX integration for trend strength confirmation
Clear visual signals with color-coded backgrounds
Real-time trend status display
Strength metrics with exact percentage values
📊 How It Works:
EMA Ribbon: Four EMAs form a ribbon pattern that shows trend direction through their stacking order
ADX Integration: Confirms trend strength when above the threshold (default 25)
Visual Signals:
Green background: Strong bullish trend
Red background: Strong bearish trend
Gray background: Neutral or weak trend
📈 Trading Signals:
STRONG BULL: EMAs properly stacked bullish + high ADX + DI+ > DI-
STRONG BEAR: EMAs properly stacked bearish + high ADX + DI- > DI+
BULL/BEAR TREND: Shows regular trend conditions without strength confirmation
NEUTRAL: No clear trend structure
🔧 Customizable Parameters:
ADX Length: Adjust trend calculation period
ADX Threshold: Modify strength confirmation level
ADX Panel Toggle: Show/hide the ADX indicator panel
💡 Best Uses:
Trend following strategies
Entry/exit timing
Trade confirmation
Market structure analysis
Risk management tool
This indicator helps traders identify not just trend direction, but also trend strength, making it particularly useful for both position entry timing and risk management. The clear visual signals and real-time metrics make it suitable for traders of all experience levels.
Note: As with all technical indicators, best results are achieved when used in conjunction with other forms of analysis and proper risk management.


Relative Strength and MomentumRelative Strength and Momentum Indicator
Unlock deeper market insights with the Relative Strength and Momentum Indicator—a powerful tool designed to help traders and investors identify the strongest stocks and sectors based on relative performance. This custom indicator displays essential information on relative strength and momentum for up to 15 different symbols, compared against a benchmark index, all within a clear and organized table format.
Key Features:
1. Customizable Inputs: Choose up to 15 symbols to compare, along with a benchmark index, allowing you to tailor the indicator to your trading strategy. The 'Lookback Period' input defines how many weeks of data are analyzed for relative strength and momentum.
2. Relative Strength Calculation: For each selected symbol, the indicator calculates the Relative Strength (RS) against the chosen benchmark. This RS is further refined using an exponential moving average (EMA) to smooth the results, providing a more stable trend overview.
3. Momentum Analysis: Momentum is determined by analyzing the rate of change in relative strength. The indicator calculates a momentum rank for each symbol, based on its relative strength’s improvement or deterioration.
4. Percentile Ranking System: Each symbol is assigned a percentile rank (from 1 to 100) based on its relative strength compared to the others. Similarly, momentum rankings are also assigned from 1 to 100, offering a clear understanding of which assets are outperforming or underperforming.
5. Visual Indicators:
a. Green: Signals improving or stable relative strength and momentum.
b. Red: Indicates declining relative strength or momentum.
c. Aqua: Highlights symbols performing well on both relative strength and momentum—ideal candidates for further analysis.
6. Two Clear Tables:
a. Relative Strength Rank Table: Displays weekly rankings of relative strength for each symbol.
b. Momentum Table: Shows momentum trends, helping you identify which symbols are gaining or losing strength.
7. Color-Coded for Easy Analysis: The tables are color-coded to make analysis quick and straightforward. A green color means the symbol is performing well in terms of relative strength or momentum, while red indicates weaker performance. Aqua marks symbols that are excelling in both areas.
Use Case:
a. Sector Comparison: Identify which sectors or indexes are showing both relative strength and momentum to pick high-potential stocks. This allows you to align with broader market trends for improved trade entries.
b. Stock Selection: Quickly compare symbols within the same sector to find the stronger performers.

Momentum Memory Indicator
The Momentum Memory Indicator (MMI) is a custom tool designed to predict future price movements based on the historical momentum of an asset. By calculating the Rate of Change (ROC) and then averaging it over a specified "memory" period, the MMI provides a prediction that reflects both recent and slightly older momentum data. The prediction is visualized as a histogram, with colors indicating the direction of the momentum.
**Parameters:**
1. **Rate of Change Period (ROC Period):** This parameter sets the period for the Rate of Change calculation, which measures the momentum of the asset. The default value is 14.
2. **Memory Period:** This parameter determines the period over which the average momentum is calculated. By considering momentum over this "memory" period, the indicator aims to provide a more stable and reliable prediction. The default value is 5.
**Logic:**
1. **Rate of Change (Momentum):** The ROC is calculated based on the asset's closing prices over the specified ROC period. It provides a measure of how much the price has changed over that period, indicating momentum.
2. **Average Momentum:** The average momentum is calculated by taking a simple moving average (SMA) of the ROC values over the memory period. This smoothens out the momentum data and provides a more stable value for prediction.
3. **Prediction:** The prediction is calculated by adjusting the current closing price based on the average momentum. This gives an estimate of where the price might be in the next period, assuming the momentum continues.
4. **Prediction Color:** The color of the prediction histogram is determined by the direction of the average momentum. A positive momentum results in a green histogram, while a negative momentum results in a red histogram.
**Plots:**
1. **Prediction (Histogram):** Represents the predicted price movement based on the average momentum. The direction and magnitude of the histogram bars provide insights into the expected price change. The color of the bars (green or red) indicates the direction of the momentum.
Momentum Bias Index [AlgoAlpha]Description:
The Momentum Bias Index by AlgoAlpha is designed to provide traders with a powerful tool for assessing market momentum bias. The indicator calculates the positive and negative bias of momentum to gauge which one is greater to determine the trend.
Key Features:
Comprehensive Momentum Analysis: The script aims to detect momentum-trend bias, typically when in an uptrend, the momentum oscillator will oscillate around the zero line but will have stronger positive values than negative values, similarly for a downtrend the momentum will have stronger negative values. This script aims to quantify this phenomenon.
Overlay Mode: Traders can choose to overlay the indicator on the price chart for a clear visual representation of market momentum.
Take-profit Signals: The indicator includes signals to lock in profits, they appear as labels in overlay mode and as crosses when overlay mode is off.
Impulse Boundary: The script includes an impulse boundary, the impulse boundary is a threshold to visualize significant spikes in momentum.
Standard Deviation Multiplier: Users can adjust the standard deviation multiplier to increase the noise tolerance of the impulse boundary.
Bias Length Control: Traders can customize the length for evaluating bias, enabling them to fine-tune the indicator according to their trading preferences. A higher length will give a longer-term bias in trend.
