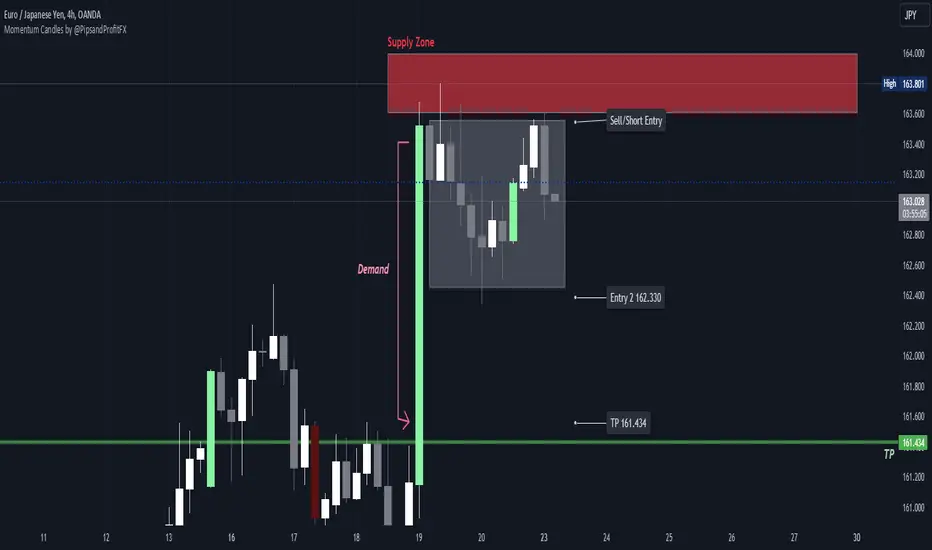
Momentum Candles by @PipsandProfitFXThe High Momentum Candles indicator highlights price bars with exceptional price movement and strong volume. It identifies candles with significantly long bodies relative to their shadows, indicating rapid price changes. Additionally, the indicator filters for candles with above-average volume to confirm the strength of the price movement.
Dark red: bearish momentum
Orange: bullish momentum
(You can easily change the momentum candles to whatever color you want in the indicator settings.)
By visually emphasizing these high momentum candles, traders can potentially identify potential trend reversals or continuations, as well as potential entry and exit points.
Key Features:
Identifies candles with large bodies relative to their shadows
Filters candles based on volume to confirm strength
Highlights high momentum candles with a distinct color
Let me know if you'd like to see any updates on this indicator.
Note: This indicator is a visual tool and should be used in conjunction with other technical analysis techniques for making informed trading decisions.
Cari dalam skrip untuk "momentum"
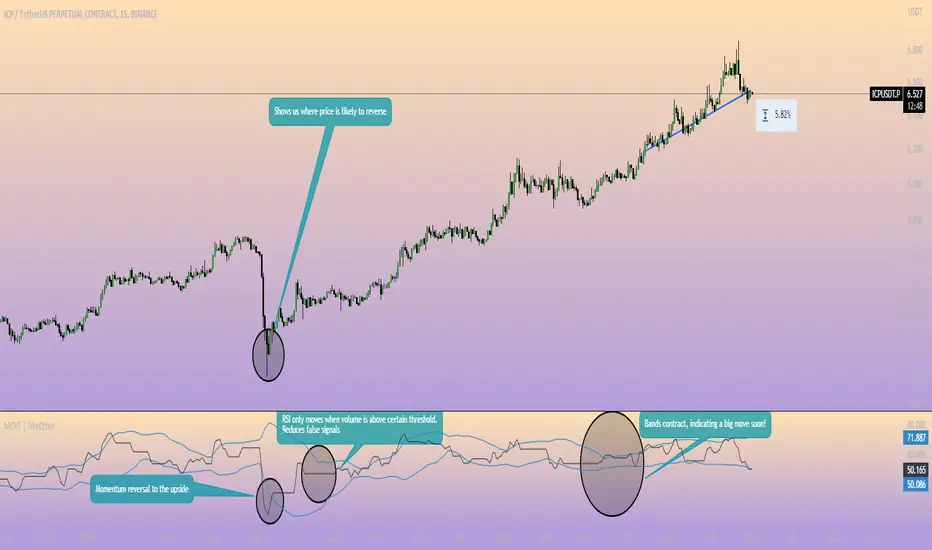
Momentum Channel - [Volume Filter]The indicator incorporates a volume filter to ensure that the RSI only moves when the volume is above the moving average of the volume.
The filtered RSI is then used to calculate the Bollinger Bands and moving averages, providing insights into the market dynamics.
It also gives you insight into the bigger timeframes so you can monitor momentum!
Volume Filter Length: Input parameter for the length of the volume filter moving average.
Overview of code:
rsiPeriod: Input parameter for the RSI period.
bandLength: Input parameter for the length of the Bollinger Bands.
lengthrsipl: Input parameter for the length of the fast moving average (MA) on the RSI.
volumeFilterLength: Input parameter for the length of the volume filter moving average.
volumeAvg: Calculates the moving average of the volume using the ta.sma() function with the specified volume filter length.
filteredRsi: Uses the ta.valuewhen() function to obtain the RSI value only when the volume is greater than or equal to the volume moving average. This creates a filtered RSI based on the volume filter.
offs: Calculates the offset value for the Bollinger Bands. It is derived by multiplying 1.6185 with the standard deviation of the filtered RSI using the ta.stdev() function.
München's Momentum WaveMUNICH'S MOMENTUM WAVE:
This momentum tracker has features sampled from Madrid's moving average ribbon but has differentiated many values, parameters, and usage of integers. It is derived using momentum and then creates moving averages and mean lengths to help support the strength of a move in price action, and also has the key mean length that helps determine HL/LH or rejections into trend continuation. This indicator works on ALL TIME FRAMES, ALL ASSET CLASSES ON ALL SETTINGS!!
HOW DO I USE IT?
*First off, I have arranged the input settings into groups based on the parts of the indicator it affects.
*You want to use the aqua/white/yellow (Munich's line) as your leading indicator, this is a combined average of the MoM indicator.
* When using Munich's line you want to look at the relation to the mean line (the flat line that adjusts based on price action. You will often see rejections of this line into trend continuation. I personally have caught perfect LH/HL bounce trades off of this indicator.
* Use the Background and other colored moving averages to help pre-determine moves based on the -3 offset value of Munich's line. This was by design not to create 'accurate' results, but to help predict momentum swings based on sharper moves in price action better than if all values lined up to the current bar.
Cheat Code's Notes:
I hope you guys find this indicator to be useful, this is most likely the best indicator that I have written. Simply for the fact it is useful on any chart, any timeframe with any setting. If you guys have any issues with it, shoot me a pm or drop a comment. Thanks!
-CheatCode1
BINANCE:BTCUSDT BITSTAMP:ETHUSD BITSTAMP:BTCUSD PEPPERSTONE:JPYX TVC:DXY TVC:NDQ AMEX:SPY

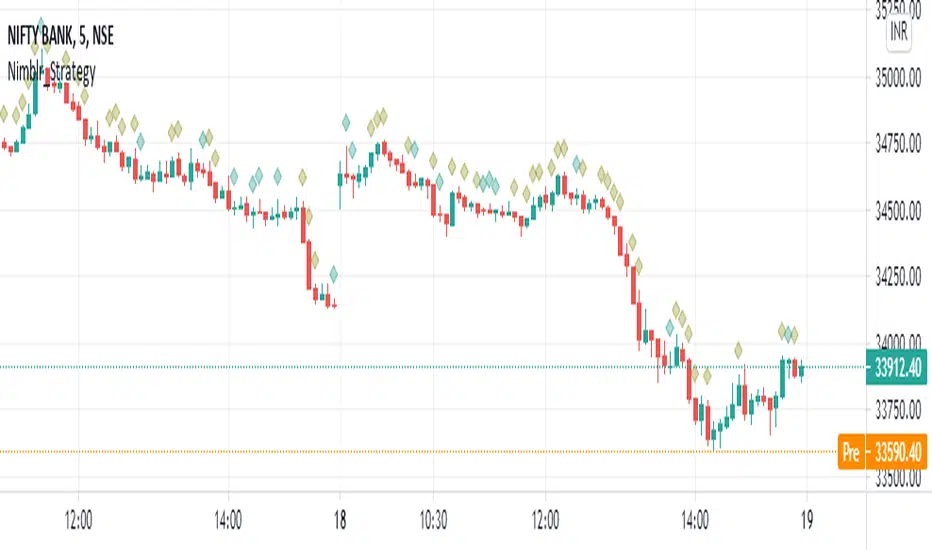
Nimblr Strategy- Momentum Candle IndicatorDescription:
Strategy uses the Nimblr advice.
It display the momentum candle with diamond on top of the candle.
Candle Height= High-Low
Body Height=Open- close
Criteria:
Candle height=100%
And body Height >50%
NSE:NIFTY
Adaptive Momentum Pressure (AMP)🔹 Adaptive Momentum Pressure (AMP)
A hybrid momentum oscillator that adapts to volatility and trend dynamics.
AMP measures the rate of change of price pressure and automatically adjusts its sensitivity based on market volatility.
It reacts faster in trending markets and smooths out noise during consolidation — helping traders identify genuine momentum shifts early while avoiding whipsaws.
🧠 Core Concept
AMP fuses three elements into one adaptive momentum model:
Normalized Momentum (ROC) – captures directional acceleration of price.
Adaptive Smoothing – the smoothing length dynamically contracts when volatility rises and expands when it falls.
Directional Bias – derived from the short-term EMA slope to weight momentum toward the prevailing trend.
Combined, these form a pressure value oscillating between –100 and +100, revealing when momentum expands or fades.
⚙️ How It Works
Calculates a normalized rate of change (ROC) relative to recent volatility.
Adjusts its effective length using the ATR — more volatile periods shorten the lookback for quicker reaction.
Applies a custom EMA that adapts in real time.
Modulates momentum by a normalized EMA slope (“trend bias”).
Produces a smoothed AMP line with a Signal line and crossover markers.
🔍 How to Read It
Green AMP line rising above Signal → Building bullish momentum.
Red AMP line falling below Signal → Fading or bearish momentum.
White Signal line = smoothed confirmation of trend energy.
Green dots = early bullish crossovers.
Red dots = early bearish crossovers.
Typical interpretations:
AMP crossing above 0 from below → early bullish impulse.
AMP peaking near +50–100 and curling down → potential momentum exhaustion.
Crosses below 0 with red pressure → bearish confirmation.
⚡ Advantages
✅ Adaptive across all markets and timeframes
✅ Built-in trend bias filters false signals
✅ Reacts earlier than RSI/MACD while reducing noise
✅ No manual retuning required
🧩 Suggested Use
Combine with structure or volume tools to confirm breakouts.
Works well as a momentum confirmation filter for entries/exits.
Optimal display: separate oscillator pane (not overlay).
Use it responsibly — AMP is an analytical tool, not financial advice.

Directional Momentum VisualizerDescription
This script provides a color-coded column visualization of a classic momentum oscillator that measures relative strength and weakness. Instead of a single line, it uses conditional coloring to make directional changes easier to identify at a glance.
The tool is designed for clarity and adaptability, offering both column and line displays, with optional overbought, oversold, and midpoint guides.
How It Works
The script evaluates the oscillator’s value relative to a midpoint and its previous reading.
Depending on whether it’s above or below the midpoint — and whether it’s rising or falling — each column changes color:
Strong upward momentum (above midpoint and rising) → bright green
Fading upward momentum (above midpoint but falling) → pale green
Strong downward momentum (below midpoint and falling) → bright red
Fading downward momentum (below midpoint but rising) → pale red
Unchanged from the previous value → gray
This structure makes momentum shifts instantly visible without relying on line crossings or alerts.
Key Features
Color-coded momentum columns for instant visual interpretation
Adjustable midpoint, overbought, and oversold levels
Optional line overlay for smoother reference
Dynamic background highlighting in extreme zones
Works on any symbol or timeframe
Inputs Overview
Length: Controls the sensitivity of the oscillator calculation.
Source: Selects the price source (Close, HL2, etc.).
Midpoint Level: Defines the central reference level separating bullish and bearish momentum.
Show Line: Toggles visibility of the traditional line overlay.
Overbought / Oversold Levels: Define upper and lower boundaries for potential exhaustion zones.
How to Use
Add the script to your chart from the Indicators tab.
Adjust the midpoint and level settings to fit your preferred configuration.
Observe how column colors shift to reflect strength or weakness in momentum.
Use these transitions as visual context, not as trade signals.
How it Helps
This visual approach offers a clearer perspective on momentum dynamics by replacing the traditional single-line display with color-coded columns. The conditional coloring instantly reveals whether momentum is strengthening or weakening around a chosen midpoint, making trend shifts and fading pressure easier to interpret at a glance. It helps reduce visual noise and allows for quicker, more intuitive analysis of market behavior.
This tool is intended purely as a visual aid to help identify changing momentum conditions at a glance. It is not a buy or sell signal generator and should be used in combination with other forms of analysis and sound risk management.
⚠️ Disclaimer:
This script is provided for educational and informational purposes only. It is not financial advice and should not be considered a recommendation to buy, sell, or hold any financial instrument. Trading involves significant risk of loss and is not suitable for every investor. Users should perform their own due diligence and consult with a licensed financial advisor before making any trading decisions. The author does not guarantee any profits or results from using this script, and assumes no liability for any losses incurred. Use this script at your own risk.
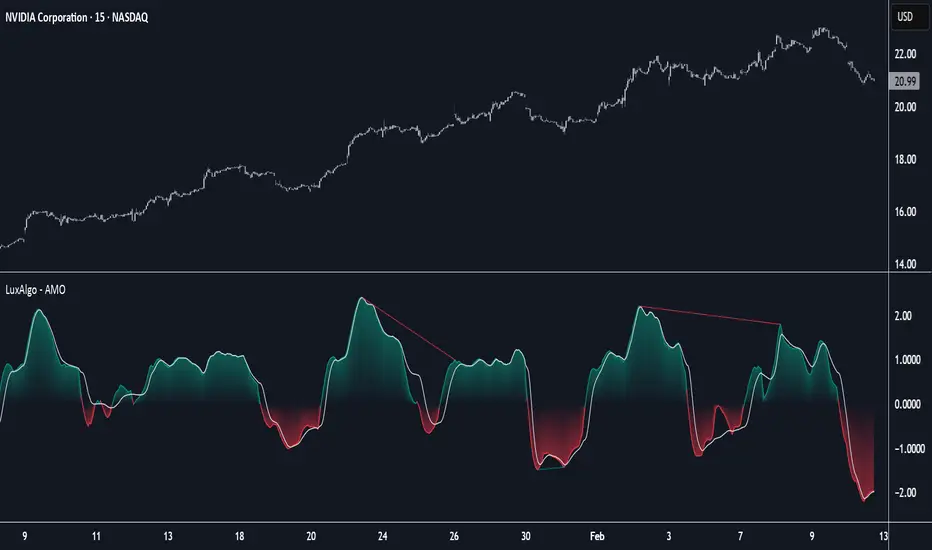
Adaptive Momentum Oscillator [LuxAlgo]The Adaptive Momentum Oscillator tool allows traders to measure the current relative momentum over a given period using the maximum delta in price.
It features a histogram with gradient color, divergences, and an adaptive moving average that allows traders to clearly see the smoothed trend direction.
🔶 USAGE
This unbounded oscillator has positive momentum when values are above 0 and negative momentum when values are below 0. The adaptive moving average is used as a minimum lag smoothing tool over the momentum histogram.
🔹 Signal Line
There are two main uses for the signal line drawn on the chart above.
Momentum crosses above or below the signal line: acceleration in momentum.
Signal line crosses the 0 value: positive or negative momentum.
🔹 Data Length
On the chart above, we can compare different length sizes and how the tool values change, allowing traders to get a shorter or longer-term view of current market strength.
🔹 Smoothing Length
In the previous figure, we can compare how different Smoothing Length values affect the oscillator output.
🔹 Divergences
The divergence detector is disabled by default. Traders can enable it and adjust the divergence length from the settings panel.
As we can see in the chart above, by changing the length of the divergences, traders can fine-tune their detection, a small number will detect smaller divergences, and use a larger number for larger divergences.
🔶 SETTINGS
Data: Select data source, close price by default
Data Length: Select the length for data gathering
Smoothing Length: Select the length for data smoothing
Divergences: Enable/Disable divergences detection and length
Rolling ATR Momentum - EnhancedATR Rolling Momentum Indicator – User Manual
---
🔍 Overview
The ATR Rolling Momentum Indicator is a dynamic volatility tool built on the Average True Range (ATR). It not only tracks increasing or decreasing momentum but also provides early warnings and confirmation signals for potential breakout moves. It’s especially powerful for futures and options traders looking to align with expanding price action.
---
📊 Core Components
✅ ATR Delta (Rolling ATR)
- Definition: Difference between current ATR and past ATR (user-defined lookback).
- Use: Tells whether volatility is expanding (positive delta) or contracting (negative delta).
- Visual: Green line for rising momentum, red for declining.
🟣 ATR Delta Slope
- Definition: Measures acceleration in momentum.
- Use: Helps identify early signs of breakout buildup.
- Visual: Purple line. Watch for slope turning up from below.
🟡 Volatility Squeeze (Yellow Dot)
- Definition: Current ATR is significantly lower than its 20-period average.
- Use: Indicates the market is coiling—possible breakout ahead.
🔼 Momentum Start (Green Triangle)
- Definition: ATR Delta slope turns from negative to positive.
- Use: Early warning to prepare for volatility expansion.
🔷 Breakout Confirmation (Blue Label Up)
- Definition: ATR Delta exceeds its high of the last 10 candles.
- Use: Confirms volatility breakout—trade opportunity if direction aligns.
🟩/🟥 Background Color
- Green Background: Momentum rising (positive ATR delta)
- Red Background: Momentum falling (negative ATR delta)
- Yellow Tint: Active squeeze zone
---
✅ How to Use It (Futures/Options Focus)
Step-by-Step:
1. Squeeze Detected (Yellow Dot) → Stay alert. Market is coiling.
2. Green Triangle Appears → Momentum is starting to rise.
3. Background Turns Green → Confirmed rising momentum.
4. Blue Label Appears → Confirmed breakout (enter trade if trend aligns).
Directional Bias:
- Use your main chart setup (price action, EMAs, trendlines, etc.) to decide direction (Call or Put, Long or Short).
- ATR Momentum only tells you how strong the move is—not which way.
---
⚙️ Inputs & Settings
- ATR Period: Default 14 (core volatility measure)
- Rolling Lookback: Used to calculate delta (default 5)
- Slope Length: Used to measure acceleration (default 3)
- Squeeze Factor: Default 0.8 — lower = more sensitive squeeze detection
- Breakout Lookback: Checks ATR delta against last X bars (default 10)
---
🧠 Pro Tips
- Works great when paired with EMA stacks, price structure, or breakout patterns.
- Avoid taking trades based only on squeeze or momentum—combine with chart confirmation.
- If background turns red after a breakout, it may be losing momentum—book partials or tighten stops.
---
🧭 Ideal For:
- Nifty/BankNifty Futures
- Option directional trades (call/put buying)
- Index scalping and momentum swing setups
---
Use this tool as your volatility compass—it won't tell you where to go, but it'll tell you when the wind is strong enough to move fast.
End of Manual

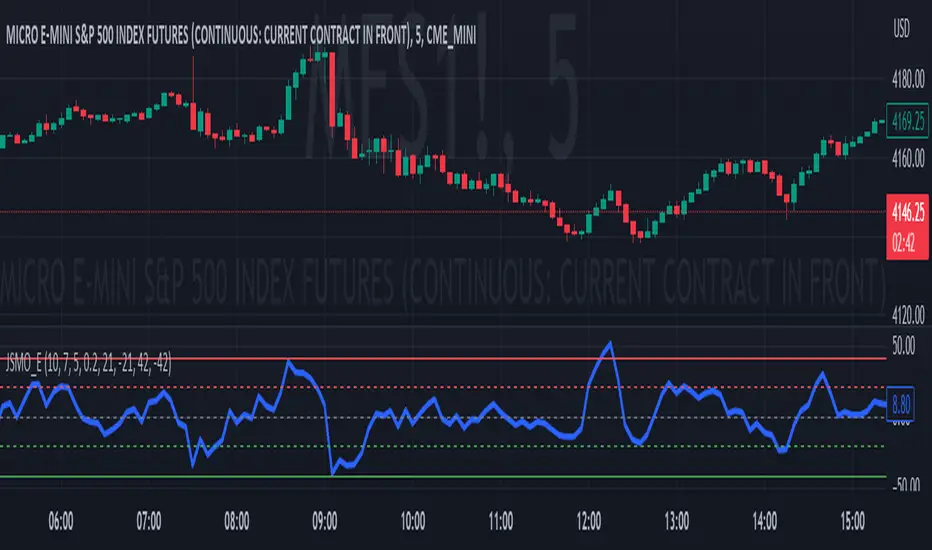
Jdawg Sentiment Momentum Oscillator EnhancedThe Jdawg Sentiment Momentum Oscillator Enhanced (JSMO_E) is a versatile technical analysis indicator designed to provide traders with insights into potential trend changes and overbought or oversold market conditions. JSMO_E combines the principles of the Relative Strength Index (RSI), the Simple Moving Average (SMA), and the Rate of Change (ROC) to create a comprehensive tool for assessing market sentiment and momentum.
The uniqueness of JSMO_E lies in its ability to integrate the RSI, SMA of RSI, and ROC of RSI, while also allowing users to customize the weight of the ROC component. This combination of features is not commonly found in other indicators, which increases its distinctiveness.
To effectively use JSMO_E, follow these steps:
Apply the JSMO_E indicator to the price chart of the asset you are analyzing.
Observe the plotted JSMO_E line in relation to the zero line, overbought, and oversold levels.
When the JSMO_E line crosses above the zero line, it may signal the beginning of an uptrend or bullish momentum. Conversely, when the JSMO_E line crosses below the zero line, it may indicate the start of a downtrend or bearish momentum.
Overbought and oversold levels, marked by the red and green dashed lines, respectively, can serve as a warning that a trend reversal may be imminent. When the JSMO_E line reaches or surpasses the overbought level, it might indicate that the asset is overvalued and could experience a price decline. Conversely, when the JSMO_E line reaches or goes below the oversold level, it can signal that the asset is undervalued and may experience a price increase.
Adjust the input parameters (RSI Period, SMA Period, ROC Period, and ROC Weight) as needed to optimize the indicator for the specific market and time frame you are analyzing.
The JSMO_E indicator is suitable for various markets, including stocks, forex, commodities, and cryptocurrencies. However, its effectiveness may vary depending on the market conditions and time frames used. It is recommended to use JSMO_E in conjunction with other technical analysis tools and methods to confirm potential trade setups and improve overall trading performance. Always conduct thorough backtesting and forward-testing before employing any indicator in a live trading environment.
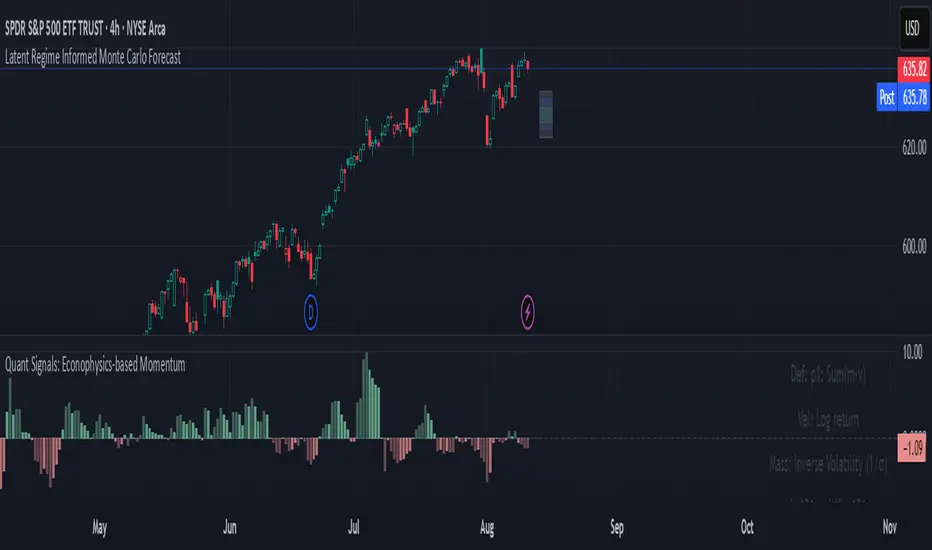
Quant Signals: Econophysics-based MomentumPhysical Momentum Switcher (p0 / p1 / p2 / p3)
This indicator implements a “physical momentum” concept from quantitative finance research, where momentum is defined similarly to physics:
Momentum (p) = Mass × Velocity
Instead of using only the standard cumulative return (classic momentum), it lets you switch between multiple definitions:
p0: Cumulative return over the lookback period (no mass, just price change).
p1: Sum of (mass × velocity) over the lookback period.
p2: Weighted average velocity = (Σ mass×velocity) ÷ (Σ mass).
p3: Sharpe-like momentum = average velocity ÷ volatility (massless).
Velocity can be measured as:
Log return: ln(Pt / Pt-1)
Normal return: (Pt / Pt-1 – 1)
Mass (for p1/p2) can be defined as:
Unit mass (1) — equal weighting, equivalent to traditional momentum.
Turnover proxy — Volume ÷ average volume over k bars.
Value turnover proxy — Dollar volume ÷ average dollar volume.
Inverse volatility — 1 ÷ return volatility over a specified period.
Features:
Switchable momentum definition, velocity type, and mass type.
Adjustable lookback (k) and smoothing period for the signal line.
Optional ±1σ display bands for quick overbought/oversold visual cues.
Alerts for crosses above/below zero or the signal line.
Table display summarizing current settings and values.
Typical uses:
Momentum trading: Buy when PM > 0 (or crosses above the signal), sell/short when PM < 0 (or crosses below).
Contrarian strategies: Reverse the logic when testing mean-reversion effects.
Cross-asset testing: Apply to different instruments to see which PM definition works best.
TradFi Fundamentals: Enhanced Macroeconomic Momentum Trading Introduction
The "Enhanced Momentum with Advanced Normalization and Smoothing" indicator is a tool that combines traditional price momentum with a broad range of macroeconomic factors. I introduced the basic version from a research paper in my last script. This one leverages not only the price action of a security but also incorporates key economic data—such as GDP, inflation, unemployment, interest rates, consumer confidence, industrial production, and market volatility (VIX)—to create a comprehensive, normalized momentum score.
Previous indicator
Explanation
In plain terms, the indicator calculates a raw momentum value based on the change in price over a defined lookback period. It then normalizes this momentum, along with several economic indicators, using a method chosen by the user (options include simple, exponential, or weighted moving averages, as well as a median absolute deviation (MAD) approach). Each normalized component is assigned a weight reflecting its relative importance, and these weighted values are summed to produce an overall momentum score.
To reduce noise, the combined momentum score can be further smoothed using a user-selected method.
Signals
For generating trade signals, the indicator offers two modes:
Zero Cross Mode: Signals occur when the smoothed momentum line crosses the zero threshold.
Zone Mode: Overbought and oversold boundaries (which are user defined) provide signals when the momentum line crosses these preset limits.
Definition of the Settings
Price Momentum Settings:
Price Momentum Lookback: The number of days used to compute the percentage change in price (default 50 days).
Normalization Period (Price Momentum): The period over which the price momentum is normalized (default 200 days).
Economic Data Settings:
Normalization Period (Economic Data): The period used to normalize all economic indicators (default 200 days).
Normalization Method: Choose among SMA, EMA, WMA, or MAD to standardize both price and economic data. If MAD is chosen, a multiplier factor is applied (default is 1.4826).
Smoothing Options:
Apply Smoothing: A toggle to enable further smoothing of the combined momentum score.
Smoothing Period & Method: Define the period and type (SMA, EMA, or WMA) used to smooth the final momentum score.
Signal Generation Settings:
Signal Mode: Select whether signals are based on a zero-line crossover or by crossing user-defined overbought/oversold (OB/OS) zones.
OB/OS Zones: Define the upper and lower boundaries (default upper zones at 1.0 and 2.0, lower zones at -1.0 and -2.0) for zone-based signals.
Weights:
Each component (price momentum, GDP, inflation, unemployment, interest rates, consumer confidence, industrial production, and VIX) has an associated weight that determines its contribution to the overall score. These can be adjusted to reflect different market views or risk preferences.
Visual Aspects
The indicator plots the smoothed combined momentum score as a continuous blue line against a dotted zero-line reference. If the Zone signal mode is selected, the indicator also displays the upper and lower OB/OS boundaries as horizontal lines (red for overbought and green for oversold). Buy and sell signals are marked by small labels ("B" for buy and "S" for sell) that appear at the bottom or top of the chart when the score crosses the defined thresholds, allowing traders to quickly identify potential entry or exit points.
Conclusion
This enhanced indicator provides traders with a robust approach to momentum trading by integrating traditional price-based signals with a suite of macroeconomic indicators. Its normalization and smoothing techniques help reduce noise and mitigate the effects of outliers, while the flexible signal generation modes offer multiple ways to interpret market conditions. Overall, this tool is designed to deliver a more nuanced perspective on market momentum.

Adaptive Momentum BaseThe Adaptive Momentum Base, (AMB), is a momentum based indicator which measures the momentum change in the recent candles and changes the colour of bar which it occurred on.
Momentum is used as a confirmation to show that the market may move in favour of your direction if the momentum is present for that direction.
Trade Example:
If you have long/short positions open and the market is moving in your favour, the signal will indicate to hold on to the position for a while has the price action has not been completed.
Script Explained:
AMB works by using the velocity created by the bars during the period of the "lookback" which is then used to formulate the momentum. The momentum is then compared against the previous bars and if a spike in momentum occurs, the indicator will follow to give a signal.

Dual-Frame Momentum OscillatorDual-Frame Momentum Oscillator (DFMO)
This is not just another oscillator. This is a confluence engine, built for the discerning trader who reads the story of price action and needs an objective tool to confirm the climax.
The Dual-Frame Momentum Oscillator was designed to solve a specific problem: how to differentiate a genuine, sustainable breakout from an exhaustive liquidity grab. It provides a visual confirmation for high-probability reversal and scalp setups by measuring momentum across two distinct time frames simultaneously.
This tool is for the trader who understands that indicators should not dictate trades, but rather confirm a well-defined thesis based on market structure, volume, and liquidity.
The Core Concept: Context Meets Trigger
The DFMO fuses a slow, methodical Stochastic with a hyper-sensitive RSI to give you a complete picture of momentum.
The Context (Slow Stochastic %K - default 40,4,4): This acts as your long-term momentum gauge. It tells you if the underlying trend is healthy or nearing exhaustion. A high reading suggests the market is overextended and vulnerable, while a low reading suggests the opposite.
The Trigger (Fast RSI - default 3): This is your immediate impulse reader. It measures the velocity and intensity of the current price thrust, making it incredibly sensitive to exhaustive moves, spikes, and bounces.
By themselves, they are useful. Together, they are formidable.
The Confluence Engine: Your Visual Edge
The true power of the DFMO lies in its "Confluence Engine." The indicator's background highlights in real-time when both oscillators are in agreement, visually flagging moments of maximum opportunity.
Bearish Confluence Zone (Red): The background turns red only when the Stochastic is overbought AND the RSI is overbought. This is your signal that the broader trend is exhausted and the current buying impulse has reached a climax. It is the ideal confirmation for a short entry following a liquidity sweep above a key high.
Bullish Confluence Zone (Green): The background turns green only when the Stochastic is oversold AND the RSI is oversold. This signals that the downtrend is tired and the immediate selling pressure is exhaustive, providing high-probability confirmation for a long entry at a key support level.
When these zones appear, the indicator is telling you that both the context and the trigger are aligned. This removes ambiguity and allows for decisive, confident execution.
Practical Application: The Liquidity Sweep
Imagine you're stalking a short on a futures contract like MCL or MES. You've marked the high of the day (HOD) as a key resistance level where liquidity is resting. You see a sharp, vertical impulse move that breaks the HOD, clearing out the stops.
Is this a real breakout, or is it a manipulation move—a classic liquidity grab?
You glance down at the DFMO. The moment price swept the high, the background flashed red. That's your objective confirmation. The slow Stoch was already overbought, and the fast RSI spiking confirmed the exhaustive, terminal nature of that price thrust. You now have the confidence to enter your short scalp, knowing you are aligned with the probable direction of the market's next move.
This is how you move from "feeling" the market to systematically executing a high-probability edge. This is how you aspire for greatness.
Add the Dual-Frame Momentum Oscillator to your toolkit and transform your ability to time entries with surgical precision.
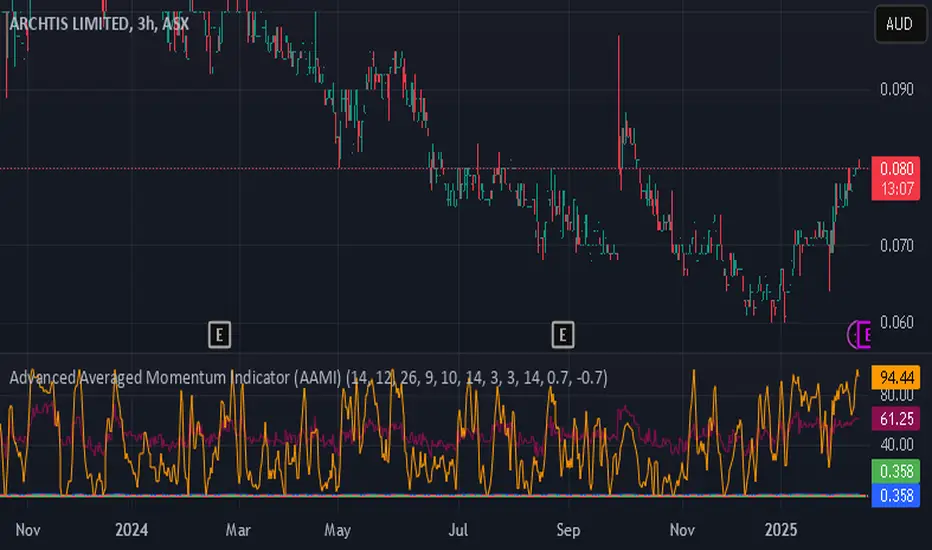
Advanced Averaged Momentum Indicator (AAMI)Key Features of AAMI:
Combination of Momentum Indicators: It averages normalized values from RSI, MACD histogram, raw Momentum, and Stochastic oscillator to give a comprehensive view of momentum.
Normalization: Each component is normalized to a scale from -1 to 1 to ensure they contribute equally to the AMI calculation.
Visual Cues: The indicator includes visual levels for neutral, overbought, and oversold conditions to aid in quick decision-making.
Alerts: Basic alert conditions are included for when AMI moves into overbought or oversold territory, which traders can customize further.
Customizable: All parameters can be adjusted within TradingView to tailor the indicator to different market conditions or trading strategies.
Smoothing: Included an SMA for AMI to reduce noise and give smoother signals.
Divergence Detection: Implemented a basic divergence detection mechanism to spot potential reversals.
Usage Tips:
Overbought/Oversold: When AMI goes above 0.7, it might suggest an overbought condition, potentially signaling a sell or take profit. Below -0.7 might indicate oversold conditions, suggesting a buy opportunity.
Divergence: Watch for divergences between the AMI and price action for signals of potential trend reversals.
Crossing Zero: The AMI crossing from negative to positive might be used as a buy signal, and vice versa for a sell signal.
This script provides a new way to view momentum by consolidating multiple traditional indicators into one, potentially offering clearer signals in complex market environments.
RSI-ROC Momentum AlertThis is the RSI-ROC Momentum Alert trading indicator, designed to help traders identify potential buy and sell signals based on the momentum of price movements.
The indicator is based on two technical indicators: the Rate of Change (ROC) and the Relative Strength Index (RSI). The ROC measures the speed of price changes over a given period, while the RSI measures the strength of price movements. By combining these two indicators, this trading indicator aims to provide a comprehensive view of the market momentum.
An RSI below its oversold level, which shows as a green background, in addition to a ROC crossing above its moving average (turns green) signals a buying opportunity.
An RSI above its overbought level, which shows as a red background, in addition to a ROC crossing below its moving average (turns red) signals a selling opportunity.
Traders can use this indicator to identify potential momentum shifts and adjust their trading strategies accordingly.
The ROC component of the indicator uses a user-defined length parameter to calculate the ROC and a simple moving average (SMA) of the ROC. The color of the ROC line changes to green when it is above the ROC SMA and to red when it is below the ROC SMA. The ROC SMA color changes whether it's above or below a value of 0.
The RSI component of the indicator uses a user-defined length parameter to calculate the RSI, and user-defined RSI Low and RSI High values to identify potential buy and sell signals. When the RSI falls below the RSI Low value, a green background color is applied to the chart to indicate a potential buy signal. Conversely, when the RSI rises above the RSI High value, a red background color is applied to the chart to indicate a potential sell signal.
This indicator is intended to be used on any time frame and any asset, and can be customized at will.

Market momentum catcherIs a tool used to catch market momentum. If the color is green it means the bulls are in momentum or the prices will continue to increase, if the color is red it means the bears are in momentum or the prices will continue to decrease and gray color means the market is consolidating.
This tool is made from moving averages and RSI.
You can place a buy order when the color is green, you can place a sell order when the color is red and if the color is gray do not trade.

Point and Figure (PnF) MomentumThis is live and non-repainting Point and Figure Chart Momentum tool. The script has it’s own P&F engine and not using integrated function of Trading View.
Point and Figure method is over 150 years old. It consist of columns that represent filtered price movements. Time is not a factor on P&F chart but as you can see with this script P&F chart created on time chart.
P&F chart provide several advantages, some of them are filtering insignificant price movements and noise, focusing on important price movements and making support/resistance levels much easier to identify.
Momentum indicator measures the rate of change or speed of price movement. It compares the current price with the previous price from a number of periods ago. By analysing the rate of change , possible to gauge the strength or “momentum”. By using this script we get Point and Figure chart momentum.
If you are new to Point & Figure Chart then you better get some information about it before using this tool. There are very good web sites and books. Please PM me if you need help about resources.
Options in the Script
Box size is one of the most important part of Point and Figure Charting. Chart price movement sensitivity is determined by the Point and Figure scale. Large box sizes see little movement across a specific price region, small box sizes see greater price movement on P&F chart. There are four different box scaling with this tool: Traditional, Percentage, Dynamic (ATR), or User-Defined
4 different methods for Box size can be used in this tool.
User Defined: The box size is set by user. A larger box size will result in more filtered price movements and fewer reversals. A smaller box size will result in less filtered price movements and more reversals.
ATR: Box size is dynamically calculated by using ATR, default period is 20.
Percentage: uses box sizes that are a fixed percentage of the stock's price. If percentage is 1 and stock’s price is $100 then box size will be $1
Traditional: uses a predefined table of price ranges to determine what the box size should be.
Price Range Box Size
Under 0.25 0.0625
0.25 to 1.00 0.125
1.00 to 5.00 0.25
5.00 to 20.00 0.50
20.00 to 100 1.0
100 to 200 2.0
200 to 500 4.0
500 to 1000 5.0
1000 to 25000 50.0
25000 and up 500.0
Default value is “ATR”, you may use one of these scaling method that suits your trading strategy.
If ATR or Percentage is chosen then there is rounding algorithm according to mintick value of the security. For example if mintick value is 0.001 and box size (ATR/Percentage) is 0.00124 then box size becomes 0.001.
And also while using dynamic box size (ATR or Percentage), box size changes only when closing price changed.
Reversal : It is the number of boxes required to change from a column of Xs to a column of Os or from a column of Os to a column of Xs. Default value is 3 (most used). For example if you choose reversal = 2 then you get the chart similar to Renko chart.
Source: Closing price or High-Low prices can be chosen as data source for P&F charting.
There is 2 options for P&F Momentum
Length: Length for the P&F Momentum, default value is 10
Display as: there are two options and can display as “Histogram” or “Line”

Hash Momentum IndicatorHash Momentum Indicator
Overview
The Hash Momentum Indicator provides real-time momentum-based trading signals with visual entry/exit markers and automatic risk management levels. This is the indicator version of the popular Hash Momentum Strategy, designed for traders who want signal alerts without backtesting functionality.
Perfect for: Live trading, automation via alerts, multi-indicator setups, and clean chart visualization.
What Makes This Indicator Special
1. Pure Momentum-Based Signals
Captures price acceleration in real-time - not lagging moving average crossovers. Enters when momentum exceeds a dynamic ATR-based threshold, catching moves as they begin accelerating.
2. Automatic Risk Management Visualization
Every signal automatically displays:
Entry level (white dashed line)
Stop loss level (red line)
Take profit target (green line)
Partial TP levels (dotted green lines)
3. Smart Trade Management
Trade Cooldown: Prevents overtrading by enforcing waiting period between signals
EMA Trend Filter: Only trades with the trend (optional)
Session Filters: Trade only during Tokyo/London/New York sessions (optional)
Weekend Toggle: Avoid low-liquidity weekend periods (optional)
4. Clean Visual Design
🟢 Tiny green dot = Long entry signal
🔴 Tiny red dot = Short entry signal
🔵 Blue X = Long exit
🟠 Orange X = Short exit
No cluttered labels or dashboard - just clean signals
5. Professional Alerts Ready
Set up TradingView alerts for:
Long signals
Short signals
Long exits
Short exits
How It Works
Step 1: Calculate Momentum
Momentum = Current Price - Price
Normalized by standard deviation for consistency
Must exceed ATR × Threshold to trigger
Step 2: Confirm Acceleration
Momentum must be increasing (positive momentum change)
Price must be moving in signal direction
Step 3: Apply Filters
EMA Filter: Long only above EMA, short only below EMA (if enabled)
Session Filter: Check if in allowed trading session (if enabled)
Weekend Filter: Block signals on Sat/Sun (if enabled)
Cooldown: Ensure minimum bars passed since last signal
Step 4: Generate Signal
All conditions met = Entry signal fires
Lines automatically drawn for entry, stop, and targets
Step 5: Exit Detection
Opposite momentum detected = Exit signal
Stop loss or take profit hit = Exit signal
Lines removed from chart
⚙️ Settings Guide
Core Strategy
Momentum Length (Default: 13)
Number of bars for momentum calculation. Higher values = stronger signals but fewer trades.
Aggressive: 10
Balanced: 13
Conservative: 18-24
Momentum Threshold (Default: 2.25)
ATR multiplier for signal generation. Higher values = only trade the biggest momentum moves.
Aggressive: 2.0
Balanced: 2.25
Conservative: 2.5-3.0
Risk:Reward Ratio (Default: 2.5)
Your target profit as a multiple of your risk. With 2.2% stop and 2.5 R:R, your target is 5.5% profit.
Conservative: 3.0+ (need 25% win rate to profit)
Balanced: 2.5 (need 29% win rate to profit)
Aggressive: 2.0 (need 33% win rate to profit)

(OFPI) Order Flow Polarity Index - Momentum Gauge (DAFE) (OFPI) Order Flow Polarity Index - Momentum Gauge: Decode Market Aggression
The (OFPI) Gauge Bar is your front-row seat to the battle between buyers and sellers. This isn’t just another indicator—it’s a momentum tracker that reveals market aggression through a sleek, centered gauge bar and a smart dashboard. Built for traders who want clarity without clutter, it’s your edge for spotting who’s driving price, bar by bar.
What Makes It Unique?
Order Flow Pressure Index (OFPI): Splits volume into buy vs. sell pressure based on candle body position. It’s not just volume—it’s intent, showing who’s got the upper hand.
T3 Smoothing Magic: Uses a Tilson T3 moving average to keep signals smooth yet responsive. No laggy SMA nonsense here.
Centered Gauge Bar: A 20-segment bar splits bullish (lime) and bearish (red) momentum around a neutral center. Empty segments scream indecision—it’s like a visual heartbeat of the market.
Momentum Shift Alerts: Catches reversals with “Momentum Shift” flags when the OFPI crests, so you’re not caught off guard.
Clean Dashboard: A compact, bottom-left table shows momentum status, the gauge bar, and the OFPI value. Color-coded, transparent, and no chart clutter.
Inputs & Customization
Lookback Length (default 10): Set the window for pressure calculations. Short for scalps, long for trends.
T3 Smoothing Length (default 5): Tune the smoothness. Tight for fast markets, relaxed for chill ones.
T3 Volume Factor (default 0.7): Crank it up for snappy signals or down for silky trends.
Toggle the dashboard for minimalist setups or mobile trading.
How to Use It
Bullish Momentum (Lime, Right-Filled): Buyers are flexing. Look for breakouts or trend continuations. Pair with support levels.
Bearish Momentum (Red, Left-Filled): Sellers are in charge. Scout for breakdowns or shorts. Check resistance zones.
Neutral (Orange, Near Center): Market’s chilling. Avoid big bets—wait for a breakout or play the range.
Momentum Shift: A reversal might be brewing. Confirm with price action before jumping in.
Not a Solo Act: Combine with your strategy—trendlines, RSI, whatever. It’s a momentum lens, not a buy/sell bot.
Why Use the OFPI Gauge?
See the Fight: Most tools just count volume. OFPI shows who’s winning with a visual that slaps.
Works Anywhere: Crypto, stocks, forex, any timeframe. Tune it to your style.
Clean & Pro: No chart spam, just a sharp gauge and a dashboard that delivers.
Unique Edge: No other indicator blends body-based pressure, T3 smoothing, and a centered gauge like this.
The OFPI Gauge catches the market’s pulse so you can trade with confidence. It’s not about predicting the future—it’s about knowing who’s in control right now.
For educational purposes only. Not financial advice. Always use proper risk management.
Use with discipline. Trade your edge.
— Dskyz , for DAFE Trading Systems

Uptrick: Momentum-Volatility Composite Signal### Title: Uptrick: Momentum-Volatility Composite Signal
### Overview
The "Uptrick: Momentum-Volatility Composite Signal" is an innovative trading tool designed to offer traders a sophisticated synthesis of momentum, volatility, volume flow, and trend detection into a single comprehensive indicator. This tool stands out by providing an integrated view of market dynamics, which is critical for identifying potential trading opportunities with greater precision and confidence. Its unique approach differentiates it from traditional indicators available on the TradingView platform, making it a valuable asset for traders aiming to enhance their market analysis.
### Unique Features
This indicator integrates multiple crucial elements of market behavior:
- Momentum Analysis : Utilizes Rate of Change (ROC) metrics to assess the speed and strength of market movements.
- Volatility Tracking : Incorporates Average True Range (ATR) metrics to measure market volatility, aiding in risk assessment.
- Volume Flow Analysis : Analyzes shifts in volume to detect buying or selling pressure, adding depth to market understanding.
- Trend Detection : Uses the difference between short-term and long-term Exponential Moving Averages (EMA) to detect market trends, providing insights into potential reversals or confirmations.
Customization and Inputs
The Uptrick indicator offers a variety of user-defined settings tailored to fit different trading styles and strategies, enhancing its adaptability across various market conditions:
Rate of Change Length (rocLength) : This setting defines the period over which momentum is calculated. Shorter periods may be preferred by day traders who need to respond quickly to market changes, while longer periods could be better suited for position traders looking at more extended trends.
ATR Length (atrLength) : Adjusts the timeframe for assessing volatility. A shorter ATR length can help day traders manage the quick shifts in market volatility, whereas longer lengths might be more applicable for swing or position traders who deal with longer-term market movements.
Volume Flow Length (volumeFlowLength): Determines the analysis period for volume flow to identify buying or selling pressure. Day traders might opt for shorter periods to catch rapid volume changes, while longer periods could serve swing traders to understand the accumulation or distribution phases better.
Short EMA Length (shortEmaLength): Specifies the period for the short-term EMA, crucial for trend detection. Shorter lengths can aid day traders in spotting immediate trend shifts, whereas longer lengths might help swing traders in identifying more sustainable trend changes.
Long EMA Length (longEmaLength): Sets the period for the long-term EMA, which is useful for observing longer-term market trends. This setting is particularly valuable for position traders who need to align with the broader market direction.
Composite Signal Moving Average Length (maLength): This parameter sets the smoothing period for the composite signal's moving average, helping to reduce noise in the signal output. A shorter moving average length can be beneficial for day traders reacting to market conditions swiftly, while a longer length might help swing and position traders in smoothing out less significant fluctuations to focus on significant trends.
These customization options ensure that traders can fine-tune the Uptrick indicator to their specific trading needs, whether they are scanning for quick opportunities or analyzing more prolonged market trends.
### Functionality Details
The indicator operates through a sophisticated algorithm that integrates multiple market dimensions:
1. Momentum and Volatility Calculation : Combines ROC and ATR to gauge the market’s momentum and stability.
2. Volume and Trend Analysis : Integrates volume data with EMAs to provide a comprehensive view of current market trends and potential shifts.
3. Signal Composite : Each component is normalized and combined into a composite signal, offering traders a nuanced perspective on when to enter or exit trades.
The indicator performs its calculations as follows:
Momentum and Volatility Calculation:
roc = ta.roc(close, rocLength)
atr = ta.atr(atrLength)
Volume and Trend Analysis:
volumeFlow = ta.cum(volume) - ta.ema(ta.cum(volume), volumeFlowLength)
emaShort = ta.ema(close, shortEmaLength)
emaLong = ta.ema(close, longEmaLength)
emaDifference = emaShort - emaLong
Composite Signal Calculation:
Normalizes each component (ROC, ATR, volume flow, EMA difference) and combines them into a composite signal:
rocNorm = (roc - ta.sma(roc, rocLength)) / ta.stdev(roc, rocLength)
atrNorm = (atr - ta.sma(atr, atrLength)) / ta.stdev(atr, atrLength)
volumeFlowNorm = (volumeFlow - ta.sma(volumeFlow, volumeFlowLength)) / ta.stdev(volumeFlow, volumeFlowLength)
emaDiffNorm = (emaDifference - ta.sma(emaDifference, longEmaLength)) / ta.stdev(emaDifference, longEmaLength)
compositeSignal = (rocNorm + atrNorm + volumeFlowNorm + emaDiffNorm) / 4
### Originality
The originality of the Uptrick indicator lies in its ability to merge diverse market metrics into a unified signal. This multi-faceted approach goes beyond traditional indicators by offering a deeper, more holistic analysis of market conditions, providing traders with insights that are not only based on price movements but also on underlying market dynamics.
### Practical Application
The Uptrick indicator excels in environments where understanding the interplay between volume, momentum, and volatility is crucial. It is especially useful for:
- Day Traders : Can leverage real-time data to make quick decisions based on sudden market changes.
- Swing Traders : Benefit from understanding medium-term trends to optimize entry and exit points.
- Position Traders : Utilize long-term market trend data to align with overall market movements.
### Best Practices
To maximize the effectiveness of the Uptrick indicator, consider the following:
- Combine with Other Indicators : Use alongside other technical tools like RSI or MACD for additional validation.
- Adapt Settings to Market Conditions : Adjust the indicator settings based on the asset and market volatility to improve signal accuracy.
- Risk Management : Implement robust risk management strategies, including setting stop-loss orders based on the volatility measured by the ATR.
### Practical Examples and Demonstrations
- Example for Day Trading : In a volatile market, a trader notices a sharp increase in the momentum score coinciding with a surge in volume but stable volatility, signaling a potential bullish breakout.
- Example for Swing Trading : On a 4-hour chart, the indicator shows a gradual alignment of decreasing volatility and increasing buying volume, suggesting a strengthening upward trend suitable for a long position.
### Alerts and Their Uses
- Alert Configurations : Set alerts for when the composite score crosses predefined thresholds to capture potential buy or sell events.
- Strategic Application : Use alerts to stay informed of significant market moves without the need to continuously monitor the markets, enabling timely and informed trading decisions.
Technical Notes
Efficiency and Compatibility: The indicator is designed for efficiency, running smoothly across different trading platforms including TradingView, and can be easily integrated with existing trading setups. It leverages advanced mathematical models for normalizing and smoothing data, ensuring consistent and reliable signal quality across different market conditions.
Limitations : The effectiveness of the Uptrick indicator can vary significantly across different market conditions and asset classes. It is designed to perform best in liquid markets where data on volume, volatility, and price trends are readily available and reliable. Traders should be aware that in low-liquidity or highly volatile markets, the signals might be less reliable and require additional confirmation.
Usage Recommendations : While the Uptrick indicator is a powerful tool, it is recommended to use it in conjunction with other analysis methods to confirm signals. Traders should also continuously monitor the performance and adjust settings as needed to align with their specific trading strategies and market conditions.
### Conclusion
The "Uptrick: Momentum-Volatility Composite Signal" is a revolutionary tool that offers traders an advanced methodology for analyzing market dynamics. By combining momentum, volatility, volume, and trend detection into a single, cohesive indicator, it provides a powerful, actionable insight into market movements, making it an indispensable tool for traders aiming to optimize their trading strategies.

Composite Momentum█ Introduction
The Composite Momentum Indicator is a tool we came across that we found to be useful at detecting implied tops and bottoms within quick market cycles. Its approach to analyzing momentum through a combination of moving averages and summation techniques makes it a useful addition to the range of available indicators on TradingView.
█ How It Works
This indicator operates by calculating the difference between two moving averages—one fast and one slow, which can be customized by the user. The difference between these two averages is then expressed as a percentage of the fast moving average, forming the core momentum value which is then smoothed with an Exponential Moving Average is applied. The smoothed momentum is then compared across periods to identify directional changes in direction
Furthermore, the script calculates the absolute differences between consecutive momentum values. These differences are used to determine periods of momentum acceleration or deceleration, aiming to establish potential reversals.
In addition to tracking momentum changes, the indicator sums positive and negative momentum changes separately over a user-defined period. This summation is intended to provide a clearer picture of the prevailing market bias—whether it’s leaning towards strength or weakness.
Finally, the summed-up values are normalized to a percentage scale. This normalization helps in identifying potential tops and bottoms by comparing the relative strength of the momentum within a given cycle.
█ Usage
This indicator is primarily useful for traders who focus on detecting quick cycle tops and bottoms. It provides a view of momentum shifts that can signal these extremes, though it’s important to use it in conjunction with other tools and market analysis techniques. Given its ability to highlight potential reversals, it may be of interest to those who seek to understand short-term market dynamics.
█ Disclaimer
This script was discovered without any information about its author or original intent but was nonetheless ported from its original format that is available publicly. It’s provided here for educational purposes and should not be considered a guaranteed method for market analysis. Users are encouraged to test and understand the indicator thoroughly before applying it in real trading scenarios.
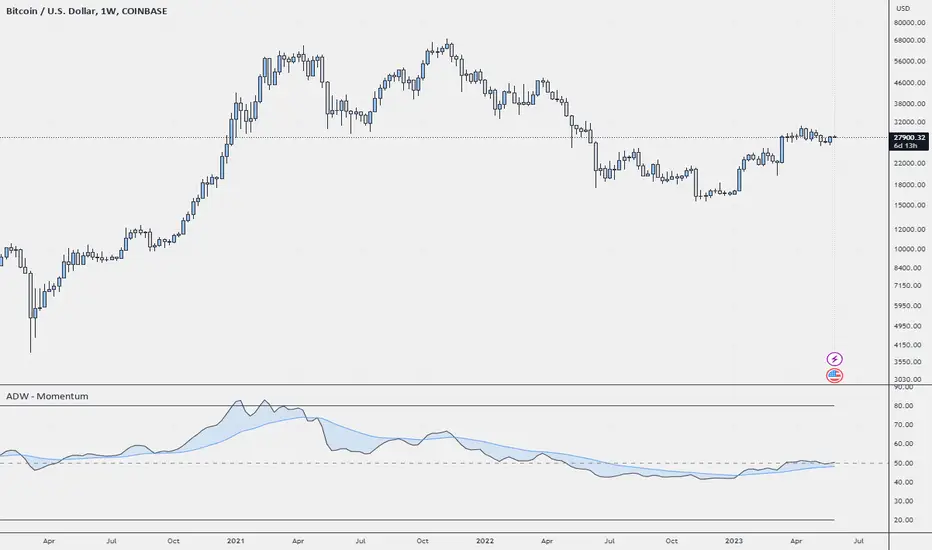
ADW - MomentumADW - Momentum is a trading indicator based on the Relative Momentum Index (RMI) and Exponential Moving Averages (EMAs). This indicator plots the RMI along with its EMAs and highlights regions where RMI crosses its slow EMA. Additionally, it provides alerts when the momentum flips bullish or bearish.
Key Features:
The RMI helps to identify momentum in the market.
Three EMAs (Fast, Standard, and Slow) were calculated on the RMI. These can be utilized to analyze the momentum trend over different periods.
Highlighted regions and colour coding to indicate when RMI crosses its Slow EMA, signalling potential momentum shifts.
Customizable parameters: Users can specify the lengths of the RMI and EMAs, boundaries for RMI, and colours for various components of the plot.
Alerts: The script can alert users when the momentum has flipped bullish or bearish.
The script is organized into several sections:
Inputs: The user can customize several parameters including the RMI averaging length, momentum lookback, RMI boundaries, and the EMA lengths. In addition, users can also specify the colours for the RMI line, Slow EMA line, and the fill colour.
RMI Calculation: The script calculates the RMI based on the user-provided length and momentum lookback. This is done by first calculating two EMAs - one for the positive differences between closing prices (emaInc), and one for the negative differences (emaDec). Then, the RMI is computed using these EMAs.
Plotting: The script plots the RMI line, Slow EMA line, and two horizontal lines indicating the RMI boundaries. In addition, it also fills the region between the RMI and Slow EMA lines.
Conditions: The script computes the conditions for bullish and bearish momentum flips. These are defined as when the RMI crosses above or below the Slow EMA respectively.
Alerts: Finally, the script sets up two alert conditions based on the bullish and bearish conditions. These alert the user when the momentum has flipped bullish or bearish, with a message that includes the current RMI value.
Momentum Ratio Oscillator [Loxx]What is Momentum Ratio Oscillator?
The theory behind this indicator involves utilizing a sequence of exponential moving average (EMA) calculations to achieve a smoother value of momentum ratio, which compares the current value to the previous one. Although this results in an outcome similar to that of some pre-existing indicators (such as volume zone or price zone oscillators), the use of EMA for smoothing is what sets it apart. EMA produces a smooth step-like output when values undergo sudden changes, whereas the mathematics used for those other indicators are completely distinct. This is a concept by the beloved Mladen of FX forums.
To utilize this version of the indicator, you have the option of using either levels, middle, or signal crosses for signals. The indicator is range bound from 0 to 1.
What is an EMA?
EMA stands for Exponential Moving Average, which is a type of moving average that is commonly used in technical analysis to smooth out price data and identify trends.
In a simple moving average (SMA), each data point is given equal weight when calculating the average. For example, if you are calculating the 10-day SMA, you would add up the prices for the past 10 days and divide by 10 to get the average. In contrast, in an EMA, more weight is given to recent prices, while older prices are given less weight.
The formula for calculating an EMA involves using a smoothing factor that is multiplied by the difference between the current price and the previous EMA value, and then adding this to the previous EMA value. The smoothing factor is typically calculated based on the length of the EMA being used. For example, a 10-day EMA might use a smoothing factor of 2/(10+1) or 0.1818.
The result of using an EMA is that the line produced is more responsive to recent price changes than a simple moving average. This makes it useful for identifying short-term trends and potential trend reversals. However, it can also be more volatile and prone to whipsaws, so it is often used in combination with other indicators to confirm signals.
Overall, the EMA is a widely used and versatile tool in technical analysis, and its effectiveness depends on the specific context in which it is applied.
What is Momentum?
In technical analysis, momentum refers to the rate of change of an asset's price over a certain period of time. It is often used to identify trends and potential trend reversals in financial markets.
Momentum is calculated by subtracting the closing price of an asset X days ago from its current closing price, where X is the number of days being used for the calculation. The result is the momentum value for that particular day. A positive momentum value suggests that prices are increasing, while a negative value indicates that prices are decreasing.
Traders use momentum in a variety of ways. One common approach is to look for divergences between the momentum indicator and the price of the asset being traded. For example, if an asset's price is trending upwards but its momentum is trending downwards, this could be a sign of a potential trend reversal.
Another popular strategy is to use momentum to identify overbought and oversold conditions in the market. When an asset's price has been rising rapidly and its momentum is high, it may be considered overbought and due for a correction. Conversely, when an asset's price has been falling rapidly and its momentum is low, it may be considered oversold and due for a bounce back up.
Momentum is also often used in conjunction with other technical indicators, such as moving averages or Bollinger Bands, to confirm signals and improve the accuracy of trading decisions.
Overall, momentum is a useful tool for traders and investors to analyze price movements and identify potential trading opportunities. However, like all technical indicators, it should be used in conjunction with other forms of analysis and with consideration of the broader market context.
Extras
Alerts
Signals
Loxx's Expanded Source Types, see here for details
