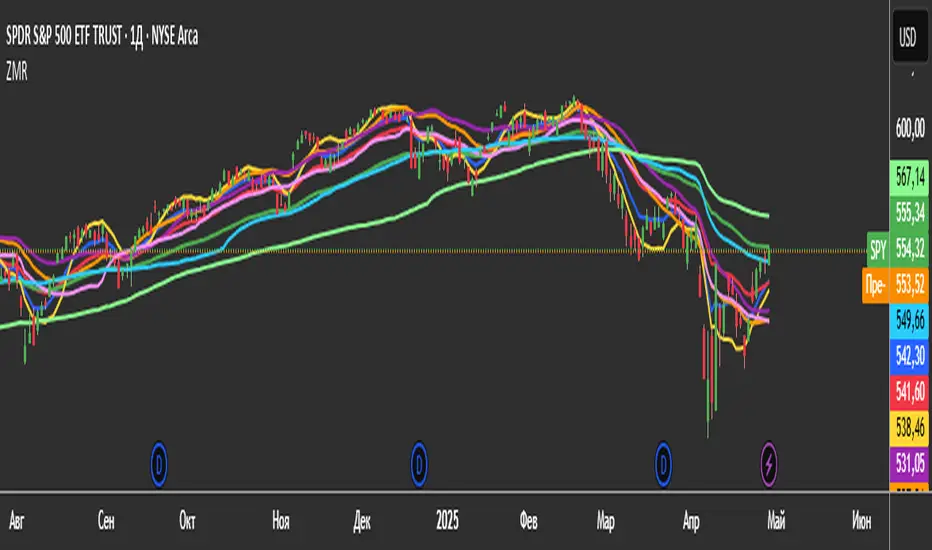
3 Zero Lag + 3 Moving Averages + 3 RVWAPThe "3 Zero Lag + 3 Moving Averages + 3 RVWAP" (ZMR) indicator combines three groups of tools for technical analysis.
1. Three Customizable Moving Averages (MAs):
Configuration for Each MA:
Choice of 7 types (SMA, EMA, WMA, HMA, VWMA, LSMA, SMMA).
Independent periods and price sources for each line.
Visualization:
MA1 (Blue), MA2 (Red), MA3 (Green).
2. Three Zero Lag EMAs (ZLEMA) with Individual Settings:
Lag Reduction: Corrects traditional EMA lag using:
Adjusted Price = 2 * Current Price - Price .
Flexibility:
Unique lengths (20, 50, 70) and individual price sources for each ZLEMA (HLC3, HL2, Close, etc.).
Colors:
ZLEMA1 (Yellow), ZLEMA2 (Orange), ZLEMA3 (Purple).
3. Three Rolling VWAPs with Custom Parameters:
Volume-Weighted Average Price (VWAP):
Calculated for three periods (20, 50, 100) with dedicated price sources for each VWAP.
Colors:
VWAP1 (Pink), VWAP2 (Light Blue), VWAP3 (Neon Green).
Cari dalam skrip untuk "vwap"
Rumpy's Multi Interval Extended VWAPsExperiment with various intervals of VWAPs and extending them 1 & 2 extra intervals. Uses base intervals from the standard 1 day to half yearly intervals (day/month/quarterly/half yearly).
VWAPs are calculated by the sum of typical price x volume divided by sum volume over the interval. With the 1 D (standard vwap ) the sums reset to zero at the end of the day.
The extensions instead of resetting to zero continues the calculation. Extending the interval an additional interval length.
Technically this means in the case of the standard VWAP that the 1st extension is actually the 2nd day of a 2 Day interval VWAP and the 2nd extension is the 3rd day of a 3 Day interval VWAP .
Same goes for the other intervals eg.
1 Month VWAP =>
1st extension : 2nd Month of a 2 Month interval VWAP
2nd extension : 3rd Month of a 3 Month interval VWAP
2nd extensions are disabled by default as there is usually often overlap, however there can be notable exceptions (such as the current 2nd Monthly extension on BTCUSD )
--------------------------------------
If you find it useful please consider a tip/donation :
BTC - 3BMEXEDyWJ58eXUEALYPadbn1wwWKmf6sA
--------------------------------------

NASDAQ VWAP Distance Histogram (Multi-Symbol)📊 VWAP Distance Histogram (Multi-Symbol)
This custom indicator plots a histogram of price strength relative to the VWAP (Volume-Weighted Average Price).
The zero line is VWAP.
Histogram bars above zero = price trading above VWAP (strength).
Histogram bars below zero = price trading below VWAP (weakness).
Unlike a standard VWAP overlay, this tool lets you monitor multiple symbols at once and aggregates them into a single, easy-to-read histogram.
🔑 Features
Multi-Symbol Support → Track up to 10 different tickers plus the chart symbol.
Aggregation Options → Choose between average or median deviation across enabled symbols.
Percent or Raw Values → Display distance from VWAP as % of price or raw price points.
Smoothing → Apply EMA smoothing to calm intraday noise.
Color-Coded Histogram → Green above VWAP, red below.
Alerts → Trigger when the aggregate crosses above/below VWAP.
Heads-Up Table → Shows number of symbols tracked and current aggregate reading.
⚡ Use Cases
Market Breadth via VWAP → Monitor whether your basket of stocks is trading above or below VWAP.
Index Substitution → Create your own “mini index” by tracking a hand-picked set of tickers.
Intraday Confirmation → Use aggregate VWAP strength/weakness to confirm entries and exits.
Relative Strength Spotting → Switch on/off specific tickers to see who’s holding above VWAP vs. breaking down.
🛠️ Settings
Include Chart Symbol → Toggle to include the current chart’s ticker.
Smoothing → EMA length (set to 0 to disable).
Percent Mode → Show results as % of price vs. raw difference.
Aggregate Mode → Average or median across all active symbols.
Symbol Slots (S1–S10) → Enter tickers to track alongside the chart.
⚠️ Notes
Works best on intraday charts since VWAP is session-based.
Designed for confirmation, not as a standalone entry/exit signal.
Ensure correct symbol format (e.g., NASDAQ:AAPL if needed).
✅ Tip: Combine this with your regular price action strategy. For example, if your setup triggers long and the histogram is well above zero, that’s added confirmation. If it’s below zero, caution — the basket shows weakness.

MVSF 6.0[ELPANO]The "MVSF 6.0 " indicator, which stands for Multi-Variable Strategy Framework, overlays on price charts to aid in trading decisions. It combines various moving averages and volume data to generate buy and sell signals based on predefined conditions.
Key features of the indicator include:
Moving Averages: It uses three exponential moving averages (EMAs) with lengths of 200, 100, and 50, and two simple moving averages (SMAs) with lengths of 14 and 9. These averages are combined into a single average line to detect trends.
Volume Analysis: The volume is assessed over a specified period (default is 2 bars) to determine its trend relative to its average, influencing the color and interpretation of signals.
Price Source and VWAP: Users can select the price (close, low, or high) used for calculations. The volume-weighted average price (VWAP) serves as a potential benchmark or condition in signal generation.
Signal Generation: Buy and sell signals are based on the relationship of the price to the average line and VWAP, the direction of the last candle, and the trend direction of the average line. These signals are visually represented on the chart.
Customization: Traders can toggle the visibility of signals, entry points, the average line, and even use these elements as conditions for filtering signals.
This script is designed to be flexible, allowing traders to modify settings according to their strategy needs. The description and implementation aim to provide clarity on how each component works together to assist in trading decisions, adhering to best practices for creating and publishing trading scripts.
*************************************
Der Indikator "MVSF 6.0 ", der für Multi-Variable Strategy Framework steht, wird über Preisdiagramme gelegt, um bei Handelsentscheidungen zu helfen. Er kombiniert verschiedene gleitende Durchschnitte und Volumendaten, um Kauf- und Verkaufssignale basierend auf vordefinierten Bedingungen zu generieren.
Wesentliche Merkmale des Indikators umfassen:
Gleitende Durchschnitte: Es werden drei exponentielle gleitende Durchschnitte (EMAs) mit Längen von 200, 100 und 50 sowie zwei einfache gleitende Durchschnitte (SMAs) mit Längen von 14 und 9 verwendet. Diese Durchschnitte werden zu einer einzelnen Durchschnittslinie kombiniert, um Trends zu erkennen.
Volumenanalyse: Das Volumen wird über einen festgelegten Zeitraum (standardmäßig 2 Balken) bewertet, um seinen Trend im Vergleich zum Durchschnitt zu bestimmen, was die Farbe und Interpretation der Signale beeinflusst.
Preisquelle und VWAP: Benutzer können den für Berechnungen verwendeten Preis (Schluss-, Tief- oder Hochkurs) auswählen. Der volumengewichtete Durchschnittspreis (VWAP) dient als mögliche Benchmark oder Bedingung bei der Generierung von Signalen.
Signalgenerierung: Kauf- und Verkaufssignale basieren auf dem Verhältnis des Preises zur Durchschnittslinie und zum VWAP, der Richtung der letzten Kerze und der Trendrichtung der Durchschnittslinie. Diese Signale werden visuell auf dem Diagramm dargestellt.
Anpassung: Händler können die Sichtbarkeit von Signalen, Einstiegspunkten, der Durchschnittslinie und sogar deren Verwendung als Bedingungen für die Filterung von Signalen ein- und ausschalten.
Dieses Skript ist so konzipiert, dass es flexibel ist und Händlern erlaubt, die Einstellungen gemäß ihren Strategiebedürfnissen zu modifizieren. Die Beschreibung und Implementierung zielen darauf ab, Klarheit darüber zu schaffen, wie jede Komponente zusammenarbeitet, um bei Handelsentscheidungen zu helfen, und halten sich an die besten Praktiken für die Erstellung und Veröffentlichung von Handelsskripten.

PivotBoss VWAP Bands (Auto TF) - FixedWhat this indicator shows (high level)
The indicator plots a VWAP line and three bands above (R1, R2, R3) and three bands below (S1, S2, S3).
Band spacing is computed from STD(abs(VWAP − price), N) and multiplied by 1, 2 and 3 to form R1–R3 / S1–S3. The script is timeframe-aware: on 30m/1H charts it uses Weekly VWAP and weekly bands; on Daily charts it uses Monthly VWAP and monthly bands; otherwise it uses the session/chart VWAP.
VWAP = the market’s volume-weighted average price (a measure of fair value). Bands = volatility-scaled zones around that fair value.
Trading idea — concept summary
VWAP = fair value. Price above VWAP implies bullish bias; below VWAP implies bearish bias.
Bands = graded overbought/oversold zones. R1/S1 are near-term limits, R2/S2 are stronger, R3/S3 are extreme.
Use trend alignment + price action + volume to choose higher-probability trades. VWAP bands give location and magnitude; confirmations reduce false signals.
Entry rules (multiple strategies with examples)
A. Momentum breakout (trend-following) — preferred on trending markets
Setup: Price consolidates near or below R1 and then closes above R1 with above-average volume. Chart: 30m/1H (Weekly VWAP) or Daily (Monthly VWAP) depending on your timeframe.
Entry: Enter long at the close of the breakout bar that closes above R1.
Stop-loss: Place initial stop below the higher of (VWAP or recent swing low). Example: if price broke R1 at ₹1,200 and VWAP = ₹1,150, set stop at ₹1,145 (5 rupee buffer below VWAP) or below the last swing low if that is wider.
Target: Partial target at R2, full target at R3. Trail stop to VWAP or to R1 after price reaches R2.
Example numeric: Weekly VWAP = ₹1,150, R1 = ₹1,200, R2 = ₹1,260. Buy at ₹1,205 (close above R1), stop ₹1,145, target1 ₹1,260 (R2), target2 ₹1,320 (R3).
B. Mean-reversion fade near bands — for range-bound markets
Setup: Market is not trending (VWAP flatish). Price rallies up to R2 or R3 and shows rejection (pin bar, bearish engulfing) on increasing or neutral volume.
Entry: Enter short after a confirmed rejection candle that fails to sustain above R2 or R3 (prefer confirmation: close back below R1 or below the rejection candle low).
Stop-loss: Just above the recent high (e.g., 1–2 ATR or a fixed buffer above R2/R3).
Target: First target VWAP, second target S1. Reduce size if taking R3 fade as it’s an extreme.
Example numeric: VWAP = ₹950, R2 = ₹1,020. Price spikes to ₹1,025 and forms a bearish engulfing candle. Enter short at ₹1,015 after the next close below ₹1,020. Stop at ₹1,035, target VWAP ₹950.
C. Pullback entries in trending markets — higher probability
Setup: Price is above VWAP and trending higher (higher highs and higher lows). Price pulls back toward VWAP or S1 with decreasing downside volume and a reversal candle forms.
Entry: Long when price forms a bullish reversal (hammer/inside-bar) with a close back above the pullback candle.
Stop-loss: Below the pullback low (or below S2 if a larger stop is justified).
Target: VWAP then R1; if momentum resumes, trail toward R2/R3.
Example numeric: Price trending above Weekly VWAP at ₹1,400; pullback to S1 at ₹1,360. Enter long at ₹1,370 when a bullish candle closes; stop at ₹1,350; first target VWAP ₹1,400, second target R1 ₹1,450.
Exit rules and money management
Basic exit hierarchy
Hard stop exit — when price hits initial stop-loss. Always use.
Target exit — take partial profits at R1/R2 (for longs) or S1/S2 (for shorts). Use trailing stops for the remainder.
VWAP invalidation — if you entered long above VWAP and price returns and closes significantly below VWAP, consider exiting (condition depends on timeframe and trade size).
Price action exit — reversal patterns (strong opposite candle, bearish/bullish engulfing) near targets or beyond signals to exit.
Trailing rules
After price reaches R2, move stop to breakeven + a small buffer or to VWAP.
After price reaches R3, trail by 1 ATR or lock a defined profit percentage.
Position sizing & risk
Risk per trade: commonly 0.5–2% of account equity.
Determine position size by RiskAmount ÷ (EntryPrice − StopPrice).
If the stop distance is large (e.g., trading R3 fades), reduce position size.
Filters & confirmation (to reduce false signals)
Volume filter: For breakouts, require volume above short-term average (e.g., >20-period average). Breakouts on low volume are suspect.
Trend filter: Only take breakouts in the direction of the higher-timeframe trend (for example, use Daily/Weekly trend when trading 30m/1H).
Candle confirmation: Prefer entries on close of the confirming candle (not intrabar noise).
Multiple confirmations: When R1 break happens but RSI/plotted momentum indicator does not confirm, treat signal as lower probability.
Special considerations for timeframe-aware logic
On 30m/1H the script uses Weekly VWAP/bands. That means band levels change only on weekly candles — they are strong, structural levels. Treat R1/R2/R3 as significant and expect fewer, stronger signals.
On Daily, the script uses Monthly VWAP/bands. These are wider; trades should allow larger stops and smaller position sizes (or be used for swing trades).
On other intraday charts you get session VWAP (useful for intraday scalps).
Example: If you trade 1H and the Weekly R1 is at ₹2,400 while session VWAP is ₹2,350, a close above Weekly R1 represents a weekly-level breakout — prefer that for swing entries rather than scalps.
Example trade walkthrough (step-by-step)
Context: 1H chart, auto-mapped → Weekly VWAP used.
Weekly VWAP = ₹3,000; R1 = ₹3,080; R2 = ₹3,150.
Price consolidates below R1. A large bullish candle closes at ₹3,085 with volume 40% above the 20-bar average.
Entry: Buy at close ₹3,085.
Stop: Place stop at ₹2,995 (just under Weekly VWAP). Risk = ₹90.
Position size: If risking ₹900 per trade → size = 900 ÷ 90 = 10 units.
Targets: Partial take-profit at R2 = ₹3,150; rest trailed with stop moved to breakeven after R2 is hit.
If price reverses and closes below VWAP within two bars, exit immediately to limit drawdown.
When to avoid trading these signals
High-impact news (earnings, macro announcements) that can gap through bands unpredictably.
Thin markets with low volume — VWAP loses significance when volumes are extremely low.
When weekly/monthly bands are flat but intraday price is volatile without clear structure — prefer session VWAP on smaller timeframes.
Alerts & automation suggestions
Alert on close above R1 / below S1 (use the built-in alertcondition the script adds). For higher-confidence alerts, require volume filter in the alert condition.
Automated order rules (if you automate): use limit entry at breakout close plus a small slippage buffer, immediate stop order, and OCO for TP and SL.

MJBFX VWAP WITH SIGNALSThe MJBFX VWAP Channel is a custom-built volume-weighted average price indicator designed around the MJBFX trading methodology.
This tool tracks multiple rolling VWAPs anchored to a user-defined timeframe (default: 1H), then calculates percentile levels (Max, Upper, Median, Lower, Min) to create a dynamic channel. These levels act as key support and resistance zones that adapt to market conditions.
🔶 Features:
Adjustable anchor period and VWAP count (up to 500 VWAPs)
Percentile-based VWAP levels (Max, Upper, Median, Lower, Min)
Customisable colours, widths, and line styles
Optional gradient channel fills
Anchor period highlights for session awareness
MJBFX Branded Signals:
🟠 Buy – Triggered when price crosses above the lower VWAP (MJBFX Orange)
⚪ Sell – Triggered when price crosses below the upper VWAP (MJBFX Grey)
Built-in alert conditions for automated trade notifications
🔶 How to Use:
The VWAP channel provides a dynamic structure for intraday trading.
Buy opportunities often occur when price sweeps below the lower band and reclaims it.
Sell opportunities often occur when price sweeps above the upper band and rejects.
Use in confluence with market structure, session timing, and your trading plan (e.g., MJB-FX Asian Sweep strategy).

Smoothed SuperTrend with VWAP Confirmation [CHE] Smoothed SuperTrend with Automated Optimization and VWAP Confirmation
Overview
The "Smoothed SuperTrend with VWAP Confirmation" is an advanced technical analysis indicator designed for precise trend identification and trading signal generation. This script integrates a smoothed version of the popular SuperTrend indicator with an additional layer of confirmation using the Volume-Weighted Average Price (VWAP). The combination of these two elements offers traders a powerful tool for identifying optimal entry and exit points in the market.
Key Features
1. Smoothed SuperTrend
- Super Smoother Algorithm: The SuperTrend in this script is not just a regular one; it is enhanced by the Super Smoother filter, which reduces market noise and provides more reliable trend signals.
- Customizable Parameters: Traders can adjust three different sets of SuperTrend parameters (factor and ATR length), allowing them to tailor the indicator to their specific trading strategies.
- Automatic Optimization: The script automatically evaluates the performance of each SuperTrend parameter set and selects the one with the best cumulative performance. This selection process can be set to pick either the best or the worst performing parameter set, depending on the trader's preference.
2. VWAP Confirmation
- Precise Trend Confirmation: Once the best-performing SuperTrend is identified, the script further refines the signals by using VWAP as a confirmation tool. VWAP is a highly respected indicator in the trading community, often used to assess the true average price of an asset.
- Long and Short Signal Generation: The script generates Long and Short signals only when the price action is confirmed by both the SuperTrend and VWAP. For a Long signal, the price must be above the VWAP, and for a Short signal, it must be below the VWAP. This dual confirmation ensures higher accuracy and reduces the likelihood of false signals.
3. Visual and Informative Labels
- Signal Labels: Upon confirmation of a trend reversal by both the SuperTrend and VWAP, the script plots clear labels on the chart, indicating confirmed Long or Short signals. These labels are customizable in terms of color, text, and size, ensuring they fit seamlessly into any chart setup.
- Best Parameters Display: At the close of the most recent bar, the script displays a label that provides detailed information about the best-performing SuperTrend parameters and their cumulative performance. This feature keeps traders informed about which settings are currently most effective.
Input Customization Options
1. Super Smoother Length
- Traders can define the length of the Super Smoother filter, which is used to smooth both price data and ATR (Average True Range) values. This input allows traders to control the sensitivity of the indicator, with shorter lengths providing faster responses and longer lengths offering smoother trends.
2. SuperTrend Parameters
- Factor: For each of the three SuperTrends, traders can set a unique factor that determines the distance of the SuperTrend bands from the average price. A higher factor results in wider bands and fewer signals, while a lower factor results in narrower bands and more signals.
- ATR Length: Traders can also specify the length of the ATR used in each SuperTrend calculation. A longer ATR period captures broader market volatility, while a shorter period focuses on more immediate price movements.
3. Label Settings
- Label Colors: The script allows full customization of label colors for Long and Short signals, ensuring that they match the trader’s chart aesthetics.
- Label Text Colors and Sizes: Traders can adjust the text color and size of the labels for Long, Short, and information labels, allowing them to prioritize visibility and readability on their charts.
4. Performance Selection Mode
- Best or Worst Performer: This input allows traders to select whether the script should optimize for the best or worst performing SuperTrend parameter set. This flexibility is useful in different market conditions, where a trader might want to analyze either the strongest trend or focus on a contrarian strategy.
5. VWAP Calculation
- The script automatically recalculates the VWAP based on trend changes, ensuring that the confirmation signals are as accurate and relevant as possible to the current market context.
Important Note
This script is designed to provide more accurate trend signals and confirmations, but like all technical indicators, it should not be used in isolation. It is recommended to use this tool as part of a broader trading strategy, including proper risk management and consideration of fundamental market conditions.
Conclusion
The "Smoothed SuperTrend with VWAP Confirmation" script is an innovative trading tool that combines the strengths of the SuperTrend and VWAP indicators. By integrating smoothing techniques and automatic parameter optimization, this indicator provides traders with more accurate and reliable trend signals. The added confirmation by VWAP further enhances the precision of the entry and exit points, making it an excellent choice for traders looking to improve their technical analysis and trading outcomes. This tool is especially valuable for those who prefer customizable inputs and a systematic approach to trading, ensuring that the indicator adapts to various market conditions and individual trading styles.
Best regards
Chervolino

True Moving VWAPHaven't found any moving VWAPs that calculate correctly (were weighted by time rather than volume) - this is correctly weighted VWAP.

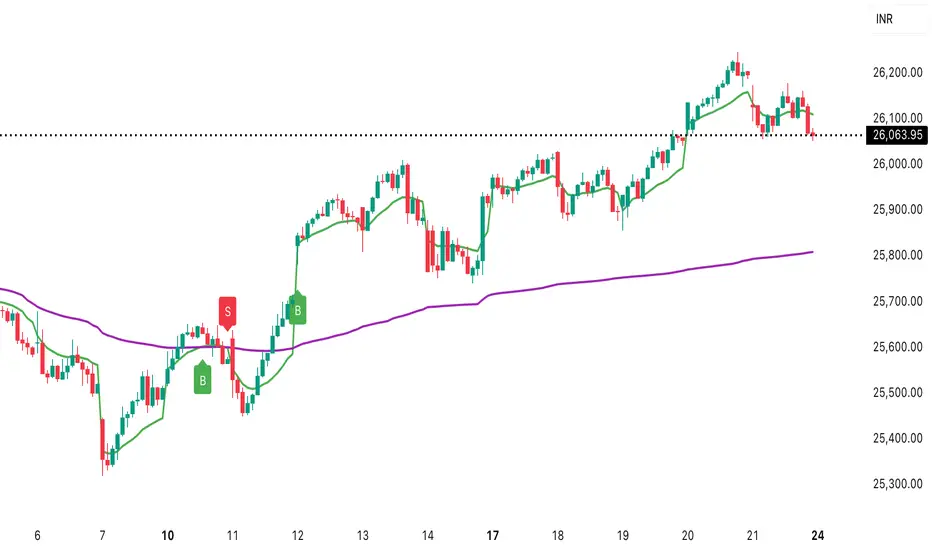
Daily vs Monthly VWAP CrossoverDaily vs Monthly VWAP Crossover Strategy
Description:
Overview This indicator is a trend-following tool designed to identify significant shifts in market sentiment by comparing short-term institutional value against the longer-term trend. It utilizes Anchored VWAP (Volume Weighted Average Price) logic to track the average price paid by traders for the current Day versus the current Month.
How It Works Unlike standard Moving Averages which lag significantly, VWAP factors in volume, making it a preferred benchmark for institutional traders.
Daily VWAP (Fast Line): Anchors at the start of the current trading day. It represents the intraday equilibrium price.
Monthly VWAP (Slow Line): Anchors at the start of the current month. It represents the broader value consensus for the month.
The indicator calculates these values cumulatively on every tick/bar, regardless of the chart timeframe selected (e.g., 30m, 1h).
Trading Logic & Signals The strategy is based on the concept of value migration:
BUY Signal (Bullish Reversal): Triggers when the Daily VWAP crosses ABOVE the Monthly VWAP. This suggests that short-term buying pressure and volume are pushing the price higher than the monthly average cost basis, indicating a potential breakout or trend continuation.
SELL Signal (Bearish Reversal): Triggers when the Daily VWAP crosses BELOW the Monthly VWAP. This indicates that intraday weakness has dragged the price below the month's average value, signaling potential downside momentum.
Features
Visual Crossovers: Clearly marked "B" (Buy) and "S" (Sell) labels on the chart.
Trend Background: The background color changes subtly (Green/Red) to indicate the current dominance of the Daily vs. Monthly trend.
Alerts: Fully compatible with TradingView alerts for real-time notifications on crossovers.
Best Practices
Timeframe: Designed optimally for intraday charts such as 30-minute or 1-hour timeframes.
Confirmation: As with any VWAP strategy, this works best when combined with price action analysis (e.g., breakout of key resistance) rather than used blindly in choppy, sideways markets.
Microstructure Participation & Acceptance Indicator📊 Microstructure Participation & Acceptance Indicator
An advanced participation-based filter combining VWAP distance analysis, volume delta detection, and real-time acceptance/rejection state identification—designed for smaller timeframe trading.
📊 FEATURES
VWAP Distance Normalization
Context-aware fair value measurement:
Automatically resets based on selected anchor (Session/Week/Month)
ATR-normalized distance calculation for universal application
Identifies when price is extended or compressed relative to equilibrium
Configurable extreme distance threshold (default: 1.5 ATR)
Adjustable source input (default: HLC3)
Volume Delta Proxy
Bull vs Bear participation tracking:
Calculates volume imbalance between bullish and bearish candles
EMA smoothing for cleaner signal generation (default: 9 periods)
Delta ratio measurement to identify dominant side
Expansion/compression detection to gauge momentum commitment
Configurable expansion threshold (default: 1.3x)
Acceptance/Rejection State Machine
Real-time market regime identification with six distinct states:
🟢 Accepted Long
Price moving away from VWAP with expanding bullish delta
Distance from VWAP increasing
Volume confirming the move
Indicates real buying pressure—trade WITH the move
🟢 Accepted Short
Price moving away from VWAP with expanding bearish delta
Distance from VWAP increasing
Volume confirming the move
Indicates real selling pressure—trade WITH the move
🟠 Fade Long
Price extended beyond threshold (>1.5 ATR above VWAP)
Delta not supporting the extension
Volume participation absent or diminishing
Potential mean-reversion short setup
🟠 Fade Short
Price extended beyond threshold (>1.5 ATR below VWAP)
Delta not supporting the extension
Volume participation absent or diminishing
Potential mean-reversion long setup
⚪ Chop
Price compressed near VWAP
Bollinger Bands tight (width compressed)
Delta neutral—no clear commitment
NO TRADE ZONE—wait for expansion
⚪ Neutral
Transitional state between regimes
Momentum shifting but not yet confirmed
Monitor for next acceptance signal
Bollinger Bands
Standard volatility measurement with TradingView default styling:
Adjustable period length (default: 20)
Configurable standard deviation multiplier (default: 2.0)
Visual fill between bands for volatility context
Used internally for chop/compression detection
Live Dashboard
Real-time metrics display (top-right corner):
Current market state with color coding
VWAP distance in ATR units
Delta ratio (bull/bear volume balance)
Delta state (Expanding/Compressing)
High-contrast design for instant readability
🎯 HOW TO USE
For Trend Trading:
Accepted Long/Short backgrounds indicate confirmed participation—stay with the trend
Strong moves typically travel 1-1.5 ATR from VWAP with delta support
Use VWAP as dynamic support/resistance
Combine with momentum indicators (MACD, RSI) for confluence
Price above VWAP + Accepted Long state = bullish bias
Price below VWAP + Accepted Short state = bearish bias
For Mean Reversion:
Fade Long/Short states signal overextension without participation
Price beyond 1.5 ATR from VWAP with weak delta = potential reversal
Look for price return to VWAP when extended
Bollinger Band extremes + Fade state = high-probability mean reversion setup
VWAP acts as mean reversion anchor during range-bound sessions
For Risk Management:
Chop state = avoid new entries
Bollinger Band compression + Chop = pre-expansion zone (wait for breakout)
Delta compression after strong move = early exhaustion warning
State transitions (Accepted → Neutral → Fade) = tighten stops
Signal Confirmation:
Strongest setups occur when multiple factors align:
BB breakout + Accepted state + price above/below VWAP
Price rejection at BB bands + Fade state
VWAP support/resistance hold + state transition
Delta expansion + distance increasing + trend direction
⚙️ SETTINGS
All components are fully customizable through organized input groups:
VWAP Distance Group:
VWAP source (default: HLC3)
Anchor period (Session/Week/Month)
ATR length for normalization (default: 14)
Extreme distance threshold in ATR multiples (default: 1.5)
Volume Delta Group:
Delta EMA length (default: 9)
Delta expansion threshold (default: 1.3)
Acceptance Logic Group:
Acceptance lookback period (default: 5)
Chop threshold in VWAP/ATR units (default: 0.3)
Bollinger Bands Group:
BB length (default: 20)
Standard deviation multiplier (default: 2.0)
Display Group:
Toggle state backgrounds
Toggle state change labels
Toggle VWAP line
Toggle Bollinger Bands
💡 EDUCATIONAL VALUE
This indicator teaches important concepts:
How institutional money identifies fair value (VWAP)
The difference between price movement and market acceptance
Why volume participation matters more than price action alone
How to distinguish between noise and committed directional moves
The relationship between volatility compression and expansion cycles
Why distance from equilibrium predicts mean reversion probability
⚠️ IMPORTANT NOTES
This indicator is for educational and informational purposes only
This is a filter, not a standalone trading system
No indicator is perfect—always use proper risk management
Past performance does not guarantee future results
Combine with your own analysis and risk tolerance
Test thoroughly on historical data before live trading
This is not financial advice—use at your own risk
🔧 TECHNICAL DETAILS
Pine Script Version 6
Overlay indicator (displays on price chart)
All calculations use standard, well-documented formulas
No repainting—all signals are confirmed on bar close
Compatible with all timeframes and instruments
Optimized for smaller timeframes (1-5 minute charts)
Minimal computational overhead
📝 CHANGELOG
Version 1.0
Initial release
VWAP distance normalization with ATR scaling
Volume delta proxy system (bull/bear EMA)
6-state acceptance/rejection state machine
Bollinger Bands integration
Real-time dashboard with live metrics
State change labels and background coloring
Full customization options
Developed for traders who need objective participation filters to distinguish high-probability setups from low-quality noise—without cluttering their charts with multiple indicator panels.

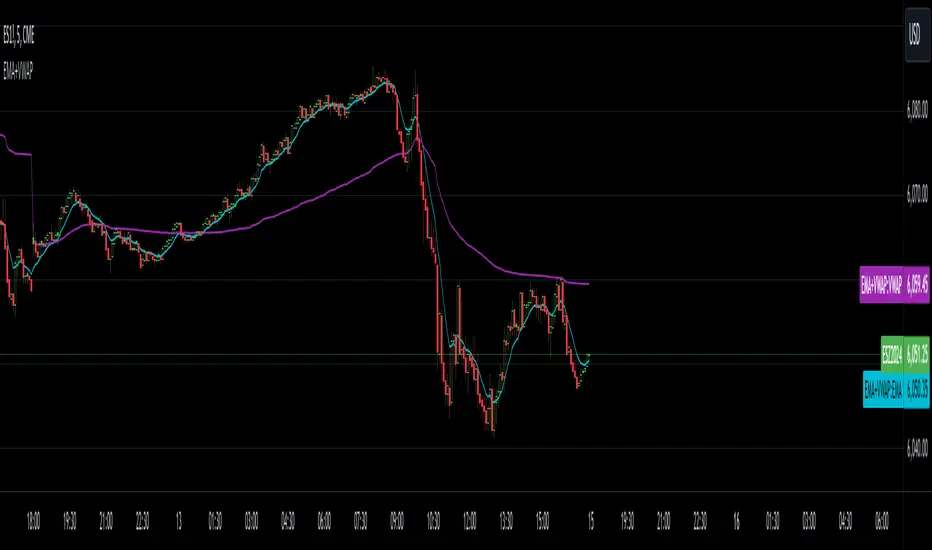
EMA with VWAPThis indicator combines two popular technical analysis tools: the Exponential Moving Average (EMA) and the Volume Weighted Average Price (VWAP), into a single, powerful overlay on your chart. It allows you to analyze both trend direction using the EMA and institutional interest and fair value using the VWAP, all while saving valuable indicator slots on your TradingView layout.
Key Features:
- Exponential Moving Average (EMA):
- Calculates the EMA based on a user-defined Length and Source (e.g., close, open, hl2).
- Includes an optional Offset to shift the EMA line forward or backward on the chart.
- Offers a Smoothing Line feature, allowing you to further smooth the EMA using various moving average types (SMA, EMA, SMMA (RMA), WMA, VWMA) with a customizable Smoothing Length.
- EMA and Smoothing Line can be toggled on or off.
- EMA and Smoothing Line have independent offset capabilities.
Volume Weighted Average Price (VWAP):
-Calculates the VWAP, a crucial indicator that reflects the average price weighted by volume.
- Offers a wide range of Anchor Periods for resetting the VWAP calculation, including: Session, Week, Month, Quarter, Year, Decade, Century, Earnings, Dividends, and Splits.
- Includes an optional Offset to shift the VWAP line.
- Option to Hide VWAP on 1D or Above timeframes to focus on intraday analysis.
- Provides up to three customizable Standard Deviation Bands above and below the VWAP, visually representing volatility and potential support/resistance levels.
- Bands can be calculated using either "Standard Deviation" or "Percentage" methods.
- Bands can be turned on or off independently.
How to Use:
- EMA: Use the EMA to identify the overall trend direction. An upward-sloping EMA suggests an uptrend, while a downward-sloping EMA suggests a downtrend. The Smoothing Line can help confirm the EMA's trend.
- VWAP: The VWAP acts as a benchmark for the "fair" price of an asset during the selected anchor period. Prices above the VWAP may indicate bullish sentiment, while prices below may indicate bearish sentiment.
- Bands: The Standard Deviation Bands can help identify potential overbought and oversold conditions. Price reaching the upper bands might suggest overbought levels, while price reaching the lower bands might suggest oversold levels.
Customization:
- The indicator offers extensive customization through its settings:
- EMA Settings: Adjust the EMA length, source, offset, smoothing method, and smoothing length.
- VWAP Settings: Choose the VWAP anchor period, source, offset, and whether to hide it on daily or higher timeframes.
- VWAP Bands Settings: Control the visibility, multiplier, and calculation method for each of the three standard deviation bands.
Benefits:
- Consolidated Analysis: Combines two essential indicators into one, providing a comprehensive view of price action and volume.
- Saves Indicator Slots: Frees up valuable indicator slots on your TradingView chart.
- Highly Customizable: Offers a wide range of settings to tailor the indicator to your specific trading style and preferences.
- Visual Clarity: Clearly displays the EMA, VWAP, and optional bands on the chart, facilitating quick and easy analysis.
This combined EMA and VWAP indicator is a valuable tool for traders of all levels, offering a powerful and flexible way to analyze market trends and identify potential trading opportunities.
TrendWave EMA/VWAP IndicatorThe TrendWave EMA/VWAP Indicator is a powerful technical analysis tool designed for traders seeking to enhance their market strategies. By combining the dynamic Exponential Moving Average (EMA) and the Volume Weighted Average Price (VWAP), this indicator provides valuable insights into price trends and potential trading signals, allowing for informed decision-making in various market conditions.
Key Features:
Exponential Moving Average (EMA):
The EMA component helps traders identify the direction of the prevailing trend by giving more weight to recent price action. This responsiveness makes the EMA an essential tool for trend-following strategies.
Customizable Length: Users can adjust the EMA length (default set to 50 periods) to align with their specific trading style and preferences.
Volume Weighted Average Price (VWAP):
The VWAP is crucial for evaluating the average price of a security throughout the trading day, factoring in volume. It serves as a benchmark for price action and can help traders identify significant support and resistance levels.
Real-time Benchmarking: The VWAP enables traders to assess current prices against historical averages, improving their entry and exit strategies.
Signal Generation:
The TrendWave EMA/VWAP Indicator generates clear buy and sell signals based on the interaction between the price and the VWAP:
Bullish Signal: Triggered when the price crosses above the VWAP, indicating a potential upward movement.
Bearish Signal: Triggered when the price crosses below the VWAP, suggesting a potential downward movement.
These signals are visually represented with intuitive arrows on the chart, facilitating quick recognition of trading opportunities.
User-Friendly Interface:
The indicator allows traders to enable or disable components (EMA and VWAP) based on their preferences, ensuring a personalized trading experience.
Clear color coding enhances visual clarity: the EMA is displayed in blue, while the VWAP is shown in orange.
Use Cases:
Trend Following: Use the EMA to confirm the direction of the trend and make trades that align with that trend.
Price Action Analysis: Employ the VWAP to determine the average trading price and identify key support/resistance levels.
Signal Confirmation: Combine signals from both the EMA and VWAP to enhance trading strategies and decision-making.
The TrendWave EMA/VWAP Indicator is an essential addition to any trader's toolkit. By leveraging the strengths of both the EMA and VWAP, this indicator empowers traders to make informed, data-driven decisions and capitalize on market movements with confidence.

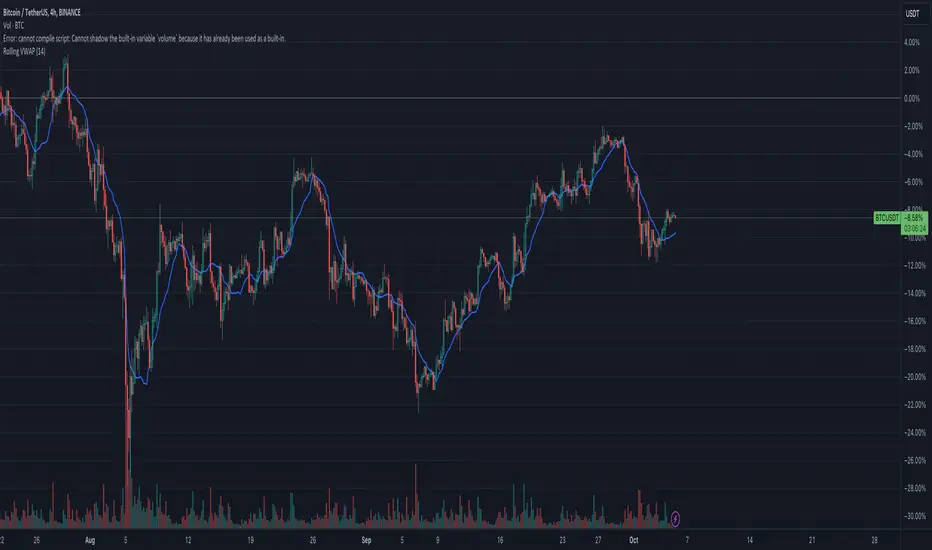
Rolling VWAPGuide for Traders
What is the Rolling VWAP?
The Volume Weighted Average Price (VWAP) is a key indicator used by traders to assess the average price of an asset, weighted by volume over a specified period. Unlike a simple moving average, the VWAP accounts for trading volume, making it a more accurate reflection of price action and market sentiment.
The Rolling VWAP in this script dynamically updates based on a user-defined period, allowing traders to view the average price over a chosen number of bars. This is particularly useful for identifying trends and potential entry or exit points in the market.
Key Benefits of Using Rolling VWAP
Better Market Insight: VWAP provides insight into where most trading is occurring, helping you gauge the strength of a price move.
Support and Resistance Levels: It often acts as dynamic support or resistance, signaling areas where price might reverse.
Trend Confirmation: A rising VWAP suggests a bullish trend, while a falling VWAP indicates a bearish trend.
Informed Entry/Exit Decisions: Use the VWAP to find entry points below it in an uptrend or exit points above it in a downtrend.
How to Use this Script:
Custom Period Input:
You can modify the "VWAP Period" to adjust the number of bars considered in the rolling calculation.
The default period is 14 bars, but you can set it based on your strategy (e.g., shorter for intraday trading, longer for swing trading).
Chart Interpretation
Bullish Signals: When the price is above the VWAP line, it suggests upward momentum, and you may consider buying opportunities.
Bearish Signals: When the price is below the VWAP, it indicates downward momentum, and you may consider selling or shorting opportunities.
Reversion to VWAP: Prices often revert to the VWAP after extended moves away from it, offering potential trade setups.
Combine with Other Indicators:
Momentum Indicators: Use with RSI, MACD, or moving averages for confirmation.
Volume Analysis: VWAP works well when combined with volume indicators to assess if a breakout is supported by high trading volume.
Customization:
Traders can customize the script's period and plot color to fit their charting preferences.
Practical Tips:
Intraday Traders: Use shorter periods (e.g., 5 or 10) to capture VWAP trends in fast-moving markets.
Swing Traders: Use longer periods (e.g., 50 or 100) to assess longer-term price and volume trends.
By integrating this Rolling VWAP into your strategy, you can better understand where the majority of trading volume has occurred, allowing you to make more informed decisions in your trading process.
F.B_Volume Weighted Average Price MTFThe F.B_Volume Weighted Average Price MTF (VWAP MTF) indicator calculates the volume-weighted average price of a security across different timeframes. The VWAP is a powerful indicator used by both institutional and retail traders to make better trading decisions.
Functionality:
Timeframe:
The indicator allows you to adjust the timeframe for the VWAP calculation via the settings. By default, the timeframe is set to weekly ("W").
Restart at new timeframe:
At each new period in the chosen timeframe, the VWAP calculations are reset, and a new VWAP is calculated.
VWAP Calculation:
The VWAP is calculated by the volume-weighted average of the typical prices (High, Low, and Close) of the security. This calculation takes into account the volume of each transaction to provide an accurate average price.
Visualization:
The VWAP is displayed as a line on the chart, and the color of the line changes depending on the price position relative to the VWAP:
Green: The current closing price is above the VWAP (bullish signal).
Red: The current closing price is below the VWAP (bearish signal).
Options:
Show barcolors:
This option allows you to display the colors of the candles based on their position relative to the VWAP (green for bullish, red for bearish).
Show previous VWAP close:
This option shows the closing value of the VWAP from the previous period to provide historical reference points.
Interpretation:
Bullish Signal:
If the current price is above the VWAP, this indicates that the market trend is upward, which could be considered a buying opportunity.
Bearish Signal:
If the current price is below the VWAP, this indicates that the market trend is downward, which could be considered a selling signal.

Dynamic Fair-Value Ribbon Pro @darshakssc1. What This Indicator Is (In Simple Terms)
The Dynamic Fair-Value Ribbon Pro is a visual tool that helps you see how price behaves around a statistically derived “fair-value zone”:
A colored ribbon/cloud marks a central “fair” area.
Areas above the ribbon are labeled as “Unfair High Zone”.
Areas below the ribbon are labeled as “Unfair Low Zone”.
A small state panel tells you where price currently sits relative to this ribbon.
All calculations are based only on historical price, volume, and volatility.
It does not predict future price, does not give buy/sell signals, and is not financial advice.
2. Adding the Indicator
Open a chart on TradingView.
Click on Indicators .
Search for “Dynamic Fair-Value Ribbon Pro” .
Click to add it to your chart.
You will see:
A cloud/ribbon around price.
Colored bars when price is outside the ribbon.
A panel in the top right describing the current state.
3. Core Concept: Fair vs Unfair Zones (Analytical Only)
The indicator tries to answer a descriptive question:
“Where is price trading relative to a historically derived central area?”
It does this by:
Calculating a central value (“fair mid”).
Building a band around that mid.
Coloring the chart depending on whether price is inside or outside that band.
It is not claiming that:
Price “must” return to the band.
Price is “overvalued” or “undervalued”.
Any state is good or bad.
It is simply a visual classification tool .
4. Engine Modes — How the Ribbon Is Calculated
Under “Fair-Value Engine” you can choose:
4.1 Mode 1: Range
Looks back over a chosen number of bars (default: 100).
Finds the highest high and lowest low in that window.
Defines a central “slice” of that range as the fair-value ribbon :
Range Mode: Lower Percent → bottom boundary of the slice (e.g., 30%).
Range Mode: Upper Percent → top boundary of the slice (e.g., 70%).
Effect:
The ribbon represents a middle portion of the historical range .
Above the ribbon = “Unfair High Zone” (analytical label only).
Below the ribbon = “Unfair Low Zone”.
This is purely statistical — it does not mean price is wrong or will revert.
4.2 Mode 2: VWAP + Stdev
In this mode, the central value is based on VWAP :
VWAP (Volume-Weighted Average Price) is used as the midline.
A standard deviation envelope is built around VWAP:
VWAP Mode: Stdev Multiplier controls how wide that envelope is.
Effect:
The ribbon shows where price is trading relative to a volume-weighted average .
Again, areas above and below are just described as “unfair” zones in a visual, analytical sense , not a predictive one.
5. ATR Adaptive Width — Making the Ribbon React to Volatility
Under “ATR Adaptive Width” :
Use ATR Adaptive Width:
On: the band width scales with volatility.
Off: band width stays fixed based on Range or VWAP settings.
ATR Length: how many bars to use for ATR.
Reference ATR (% of price): a reference level for normal volatility.
Min Width Scale / Max Width Scale: clamps the scaling so that the band doesn’t get too narrow or too wide.
What this does (analytically):
When volatility (ATR) is higher than the reference, the band can become wider .
When volatility is lower , the band can become narrower .
This is a mathematical rescaling only and does not imply any optimal levels or performance.
6. Visual Elements — What You See on the Chart
6.1 Fair-Value Ribbon (Cloud)
The cloud between Fair Ribbon Low and Fair Ribbon High is the fair zone .
Color can be changed via “Fair Ribbon Color” .
6.2 Midline
If “Show Center Line” is enabled:
A line runs through the middle of the ribbon.
In Range mode, this is the average of the upper and lower band.
In VWAP mode, it’s essentially the VWAP-based mid.
This line is for visual reference only and makes no claims about support, resistance, or reversion.
6.3 Bar Colors
Unfair High Zone: bars are colored with Unfair High Bar Color.
Unfair Low Zone: bars are colored with Unfair Low Bar Color.
Inside the ribbon:
If “Fade Bars Inside Fair Zone” is ON, bars may be more faded/neutral.
These colors are simply classification highlights ; they do not tell you what to do.
6.4 State Panel (Top Right)
If “Show State Panel” is enabled, you’ll see a small box that displays:
Current engine:
Range or VWAP+Stdev.
Current price state:
Inside Ribbon (Fair Zone)
Above Ribbon (Unfair High Zone)
Below Ribbon (Unfair Low Zone)
This is a quick summary of where price sits relative to the computed ribbon.
7. Typical Ways to Use It (Informational Only)
The indicator can help you visually:
See when price is spending time inside a historically defined central zone.
Notice when price is frequently trading outside that zone.
Compare different timeframes (e.g., 5m vs 1h vs 4h) to see how the fair zone shifts.
Experiment with:
Range length (shorter vs longer lookback).
VWAP vs Range mode.
ATR adaptation on/off.
Important:
Any interpretation of these visuals is entirely up to the user.
The script does not tell you to buy, sell, hold, or do anything specific.
8. Limitations and Important Notes
All calculations use past data only (price, volume, volatility).
The ribbon does not guarantee:
that price will revert,
that zones will hold,
or that any outcome will occur.
There are no built-in signals such as “long/short” or automatic entries/exits.
The script is best used as a supporting, visual layer alongside other tools or methods you choose.
9. Disclaimer
This indicator is:
Strictly informational and educational.
Not a trading system or strategy.
Not financial advice or a recommendation.
Not guaranteed to be accurate, complete, or suitable for any specific purpose.
Users should always perform their own research and due diligence.
Past behavior of any visual pattern or zone does not guarantee future behavior.

Daily HOD / LOD Anchored VWAP (24/7 Markets)mart Daily HOD/LOD Anchored VWAP (Auto Detect + Alerts)
This indicator automatically anchors VWAP at the High of Day (HOD) and Low of Day (LOD) for each session/day.
No more manual anchoring — the script tracks intraday highs and lows in real-time and resets cleanly at the start of each trading day or session.
✨ Features
✅ Auto-anchored AVWAP at daily High and Low
✅ Works for stock markets (with fixed sessions) and crypto markets (24/7)
✅ Clean reset every session/day
✅ Separate AVWAP lines for HOD and LOD
✅ Customizable colors & line widths
✅ Alerts included 🚨 (get notified instantly when a new High/Low AVWAP starts)
📈 Use Cases
Spot true intraday support/resistance levels
Track where institutions may be defending positions
Combine with price action, orderflow, or volume profile strategies
Perfect for intraday trading, scalping, and swing entries
⚡ Alerts
New HOD AVWAP → Fires when price makes a fresh high of day, starting a new anchored VWAP.
New LOD AVWAP → Fires when price makes a fresh low of day, starting a new anchored VWAP.
🛠️ Settings
Show/hide HOD or LOD VWAP
Customize line colors and thickness
Works seamlessly across stocks, futures, forex, and crypto
💡 Pro Tip:
AVWAP from the high and low of the day often acts as a magnet for price. Watch how price reacts when revisiting these levels — confluence with other indicators = high-probability setups.
⚠️ Disclaimer:
This script is for educational purposes only. It is not financial advice. Always manage your own risk.
Dual Vwap on IntradayIndicator Name: Dual VWAP on Intraday
Version: Pine Script v5
Description
This indicator plots two separate VWAP (Volume Weighted Average Price) lines on intraday charts, helping traders identify intraday trend bias and potential support/resistance zones.
The script is designed exclusively for intraday timeframes and will stop execution if used on daily or higher intervals.
🔍 How It Works
VWAP Calculation
Uses a custom function that calculates VWAP fresh for each trading session.
VWAP #1: Based on hl2 (average of high and low).
VWAP #2: Based on high price.
Dynamic Color Coding
The VWAP lines change color if the percentage change from the previous bar exceeds ±0.5%, signaling notable short-term volatility.
Otherwise, they retain their default colors:
Blue: VWAP (hl2 source)
Orange: VWAP (High source)
Intraday-Only Restriction
Prevents accidental use on higher timeframes to maintain accuracy.
📈 How to Use
Trend Confirmation: Both VWAPs above price → Bearish bias; both below → Bullish bias.
Support/Resistance: VWAP lines often act as strong intraday support or resistance.
Momentum Shift: Watch for price crossing either VWAP with strong candle bodies for potential reversals or breakouts.
Volatility Alerts: Darkened VWAP line indicates an intraday percentage change greater than 0.5%, signaling increased momentum.
⚠️ Notes
Works only on intraday timeframes (1m, 5m, 15m, etc.).
Best paired with volume and price action analysis.

EMA and VWAP by Phil VoEMA and VWAP by Phil Vo
Description
This indicator combines two powerful technical analysis tools: Exponential Moving Averages (EMAs) and Volume Weighted Average Price (VWAP). Designed to assist traders in identifying trends and key price levels, this script overlays two customizable EMAs and a daily VWAP on your chart.
* EMA 1 (Blue): A fast-moving EMA with a default period of 9, ideal for short-term trend analysis.
* EMA 2 (Red): A slower EMA with a default period of 21, useful for confirming longer-term trends.
* VWAP (Yellow): The Volume Weighted Average Price, calculated using the typical price (HLC3) and volume, resetting daily. It serves as a dynamic support/resistance level and reflects the average price weighted by volume.
Features
* Customizable EMAs: Adjust the periods of both EMAs via the settings (minimum period: 1).
* Visual Clarity: Each line is plotted in a distinct color (Blue for EMA 1, Red for EMA 2, Yellow for VWAP) with a linewidth of 2 for easy identification.
* Daily VWAP: The VWAP resets at the start of each trading day, providing a reliable intraday reference point.
* Tooltips: Hover over the input settings to see descriptions of each EMA period.
How to Use
1. Add the indicator to your chart.
2. Customize the EMA periods in the settings if desired (defaults are 9 and 21).
3. Use the EMAs to spot trends:
* When EMA 1 crosses above EMA 2, it may signal a bullish trend.
* When EMA 1 crosses below EMA 2, it may indicate a bearish trend.
4. Use the VWAP as a dynamic support/resistance level:
* Prices above VWAP might suggest bullish momentum.
* Prices below VWAP might indicate bearish pressure.
Settings
* EMA 1 Length: Set the period for the fast EMA (default: 9).
* EMA 2 Length: Set the period for the slow EMA (default: 21).
Notes
* The VWAP resets daily by default, making it most suitable for intraday trading.
* This script is open-source under the Mozilla Public License 2.0, so feel free to study or modify it!
Author
Created by Phil Vo. Happy trading!
How to Add This to TradingView
When you publish the script:
1. Paste the description above into the "Description" field in the "Publish Script" dialog.
2. Set the title as "EMA and VWAP by Phil Vo".
3. Choose "Public" visibility and "Open" access to share it with the community.
4. Add tags like "EMA", "VWAP", "Moving Average", "Trend", and "Volume" to help users find it.
This description provides a clear explanation of the indicator’s purpose, usage instructions, and customization options, making it accessible and helpful for TradingView users. Let me know if you’d like to adjust anything!
MACD Crossover Breakout Rays with VWAP & Breakout ConfirmationOverview
This script is designed to highlight potential strong breakout moves by combining MACD crossovers, VWAP confirmation, and price action breakouts. It helps traders identify momentum shifts and filter high-probability trade setups.
How It Works
1. MACD Crossover Detection
- The script detects bullish crossovers (MACD line crossing above the signal line) and bearish crossovers (MACD line crossing below the signal line).
- A horizontal ray is drawn at the high (bullish) or low (bearish) of the crossover candle.
2. Multi-Timeframe MACD Confirmation
- A secondary MACD crossover is checked on a lower timeframe (default: 5 minutes) to confirm the strength of the move.
- The script ensures alignment between the primary and lower timeframe MACD crossovers before signaling a strong move.
3. VWAP Confirmation
- A bullish breakout is valid only if the price is above the VWAP.
- A bearish breakout is valid only if the price is below the VWAP.
4. Breakout Validation
- The script waits for price action confirmation—a breakout is only valid when a candle closes above (bullish) or below (bearish) the horizontal ray.
- Once confirmed, the ray color changes to blue to signal a strong move.
5. Label Alerts for Strong Moves
- When all conditions align, the script prints "STRONG 💪 MOVE" above or below the breakout candle.
- The previous label is automatically removed to keep the chart clean.
Customization Options
- MACD Settings: Adjust fast/slow lengths and signal smoothing.
- Lower Timeframe Confirmation: Choose a different timeframe for multi-timeframe MACD validation.
- VWAP Filtering: Ensure breakouts align with volume-weighted trends.
- Ray Length & Colors: Customize the horizontal ray length, width, and colors.
- Breakout Confirmation Window: Adjust how many bars to check for MACD alignment.
Best Use Cases
✅ Identifying high-probability breakouts with trend confirmation.
✅ Filtering out false signals by requiring multi-timeframe agreement.
✅ Helping traders stay in momentum-driven moves with strong confirmation.
⚠ Note: This script is for educational purposes only and does not constitute financial advice. Always conduct your own analysis before making trading decisions.

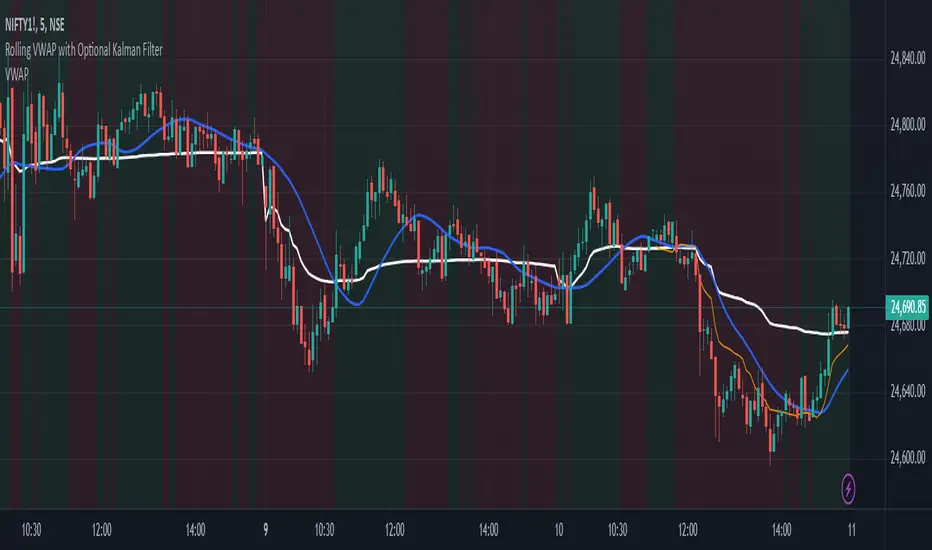
Rolling VWAP with Optional Kalman FilterThis script provides an advanced and customizable Rolling VWAP (Volume-Weighted Average Price) indicator, designed for traders who want to refine their trend analysis and improve decision-making. With a unique option to apply a Kalman Filter, you can smooth out VWAP values to reduce noise in volatile markets, making it easier to identify actionable trends.
Key Features:
Dynamic Rolling VWAP:
Choose the rolling window size (number of bars) to match your trading style, whether you’re an intraday scalper or a swing trader.
Kalman Filter Toggle:
Enable the Kalman filter to smooth VWAP values and eliminate market noise.
Adjustable Kalman Gain to control the level of smoothing, making it suitable for both fast and slow markets.
Price Source Flexibility:
Use the Typical Price ((H+L+C)/3) or the Close Price as the basis for VWAP calculation.
Visual Enhancements:
Background shading highlights whether the price is above (bullish) or below (bearish) the VWAP, helping traders make quick visual assessments.
A legend dynamically updates the current VWAP value.
Dual View Option:
Compare the raw Rolling VWAP and the Kalman-filtered VWAP when the filter is enabled, giving you deeper insight into market trends.
Use Cases:
Intraday Traders: Identify key price levels for re-entry or exits using a short rolling window and responsive filtering.
Swing Traders: Analyze broader trends with a longer rolling window and smoother VWAP output.
Volatile Markets: Use the Kalman filter to reduce noise and avoid false signals during high market volatility.
How to Use:
Adjust the Rolling Window to set the number of bars for VWAP calculation.
Toggle Kalman Filter on/off depending on your preference for raw or smoothed VWAP values.
Fine-tune the Kalman Gain for the desired level of smoothing.
Use the shading to quickly assess whether the price is trading above or below the VWAP for potential entry/exit signals.
Eze Profit - VWAP + MACD Combined SignalThe Eze Profit - VWAP + MACD Combined Signal is an advanced trading tool designed to help traders align price trends with momentum confirmation for better decision-making. By combining Volume-Weighted Average Price (VWAP) and Moving Average Convergence Divergence (MACD), this indicator provides clear entry and exit signals, allowing traders to follow trends and take advantage of momentum shifts.
How It Works:
VWAP:
VWAP represents the average price of an asset, weighted by volume, over a specific period.
It acts as a dynamic support/resistance level and trend filter. Price above VWAP indicates bullish conditions, while price below VWAP suggests bearish conditions.
MACD:
MACD measures momentum through the difference between fast and slow exponential moving averages (EMAs).
Signals are generated when the MACD line crosses its signal line:
Bullish Crossover: Indicates increasing upward momentum.
Bearish Crossunder: Indicates increasing downward momentum.
Combined Logic:
Long Signal: Triggered when price is above VWAP, and MACD exhibits a bullish crossover.
Short Signal: Triggered when price is below VWAP, and MACD exhibits a bearish crossunder.
The script tracks the trader's "in-position" state to prevent redundant signals and ensure clarity.
How to Use:
Use this script to identify potential long and short trading opportunities:
Buy Signal: Enter a long position when the price moves above VWAP and MACD confirms bullish momentum.
Sell Signal: Exit or short when the price drops below VWAP and MACD confirms bearish momentum.
Combine with additional tools like support/resistance, volume analysis, or candlestick patterns for confirmation.
Features:
VWAP Trend Filter: Dynamically adjusts to the trading session to identify overall trend direction.
MACD Momentum Confirmation: Detects key momentum shifts with configurable settings for fast, slow, and signal lengths.
Position State Tracking: Avoids signal redundancy by monitoring open positions.
Buy/Sell Visualizations: Plots Buy/Sell signals directly on the chart for ease of use.
Alerts: Notifies traders in real-time when a long or short signal is triggered.
Customizable Settings:
MACD Fast Length, Slow Length, and Signal Smoothing parameters.
VWAP timeframe resolution to adapt to different trading styles (e.g., intraday or daily).
Credits:
This script is based on standard VWAP and MACD calculations provided by TradingView’s library and has been enhanced with unique logic for combined signal generation.
Notes:
This indicator is intended for educational purposes and should not be considered financial advice. Use it as part of a broader trading strategy alongside other tools for optimal results.

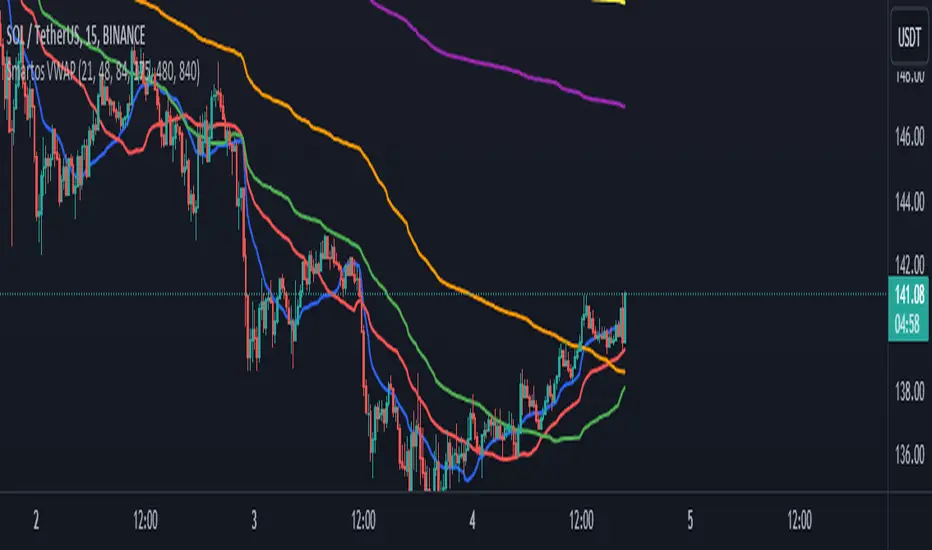
Smartos VWAPSmartos VWAP Indicator Description
Smartos VWAP is a versatile and customizable technical analysis tool designed for traders and analysts to gauge the average price of a security based on its trading volume. The indicator calculates the Volume Weighted Average Price (VWAP) over six different customizable periods, allowing users to adapt the analysis to their trading strategies.
Key Features:
Volume Weighted Average Price (VWAP): The Smartos VWAP provides a dynamic measure of the average price at which a security has traded throughout the day, weighted by volume. This makes it a useful reference point for assessing price levels.
Customizable Periods: The indicator allows users to set six different candle lengths for VWAP calculations, with default values of 21, 48, 84, 175, 480, and 840 candles. Users can easily modify these values to suit their trading preferences.
Multiple VWAP Lines: The indicator plots six distinct VWAP lines on the chart, each representing a different period. This enables traders to observe price action relative to multiple VWAPs, helping identify trends and potential support and resistance levels.
Visual Clarity: Each VWAP line is color-coded for easy differentiation, making it simple for traders to analyze price movements and the relationship between the current price and the average price over the selected periods.
Usage:
Traders can use the Smartos VWAP indicator to make informed decisions regarding entry and exit points, as well as to assess overall market sentiment. By observing the position of the price relative to the VWAP lines, traders can gain insights into potential bullish or bearish trends.
Zigzag Tails [Trendoscope®] 🎲 Introducing Zigzag Tails Indicator by Trendoscope.
The Zigzag Tails Indicator, a groundbreaking tool from Trendoscope, redefines technical analysis by seamlessly integrating anchored VWAPs (Volume Weighted Average Prices) and Average Price calculations with Zigzag pivot points. This advanced indicator recalculates Average Price or VWAP from one Zigzag pivot to the next, offering unparalleled insights into market movements.
🎯 Innovative Design
Each Zigzag pivot can feature up to three distinct tails, corresponding to the high, low, and close prices of each candle. Users have the flexibility to select between Average Price and VWAP for display on their charts. By default, the indicator plots all three tails, but individual tail visibility is customizable via the settings panel.
Average Price Mode: When selected, tails depict the average price across a specified number of bars.
VWAP Mode: In this mode, tails represent the VWAP, calculated for a given price over a set number of bars.
🎯 Dynamic Dotted Tail
The Zigzag Tails Indicator features dotted tails that extend from the last Zigzag pivot to the current bar. These dotted tails dynamically adapt to market changes and are subject to repainting with the emergence of new Zigzag pivots.
When repainting is enabled, the dotted tails originate from the last unconfirmed Zigzag pivot, extending to the current bar. This setting offers a more immediate, albeit tentative, visual representation of market trends.
With repainting disabled, the dotted tails will be anchored from the last confirmed Zigzag pivot to the current bar, providing a more stable but slightly delayed market analysis.
Irrespective of the repaint option, the dotted dynamic tails is always expected to repaint.
🎯 Practical Applications
The Zigzag Tails Indicator provides more accurate support and resistance levels than traditional VWAP, rolling VWAP, or moving averages. Its precision makes it an invaluable tool for identifying trends, as well as potential trend continuations or reversals.
🛠 Indicator Settings
Zigzag Configuration:
Zigzag Length determines the loopback length for the foundational Zigzag calculation.
Number of Bars represent the calculation distance. This limitation is added to avoid runtime errors on lower timeframes. The calculations run through lots of loops. Hence, if it is run across too many bars, we may get timeout issues.
Repaint: Activating this will also display the last, unconfirmed Zigzag pivot. Since the last pivot is inherently tentative, it may repaint with the arrival of new bars. A pivot is confirmed only when a subsequent unconfirmed pivot emerges on the chart.
Tail Configuration
Tail Type: Choose between average and VWAP for the tail calculation. The average option plots a simple average, while the VWAP option calculates an anchored VWAP from pivot to pivot.
Display Options: Tailored display options for High, Low, Close prices, with customizable colors for each tail type.
Inspired by the ideas of @KioseffTrading's implementation of Zigzag Anchored VWAP
