VWAP Confluência 3x VWAP Confluence 3x — Daily · Weekly · Anchored
Purpose
A pragmatic VWAP suite for execution and risk management. It plots three institutional reference lines: Daily VWAP, Weekly VWAP, and an Anchored VWAP (AVWAP) starting from a user-defined event (news, earnings, session open, swing high/low).
Why it matters
VWAP is the market’s “fair price” weighted by where volume actually traded. Confluence across timeframes and events turns noisy charts into actionable bias and clean levels.
What it does
Daily VWAP — resets each trading day; intraday “fair value.”
Weekly VWAP — resets each week; swing context and larger player defense.
Anchored VWAP — starts at a precise timestamp you set (e.g., news release).
Price source toggle — Typical Price
(
𝐻
+
𝐿
+
𝐶
)
/
3
(H+L+C)/3 or Close.
Visibility switches — enable/disable each line independently.
Anchor marker — labels the first bar of the AVWAP.
Inputs
Show Daily VWAP (on/off)
Show Weekly VWAP (on/off)
Show Anchored VWAP (on/off)
Price Source: Typical (H+L+C)/3 or Close
Anchor Time: timestamp of your event (uses the chart/exchange timezone)
How to anchor to a news event
Find the exact release time as shown in your chart’s timezone.
Open the indicator settings → set Anchor Time to that minute.
The AVWAP begins at that bar and accumulates forward.
Playbook (examples, not signals)
Strong long bias: price above Daily and Weekly VWAP; AVWAP reclaimed after news.
Strong short bias: price below Daily and Weekly; AVWAP reject after news.
Mean-revert zones: price stretches far from the active VWAPs and snaps back; size around VWAP with tight risk.
Targets: opposite VWAP, prior day/week highs/lows, or liquidity pools near AVWAP.
Best used with
Session highs/lows, liquidity sweeps, volume profile, and time-of-day filters.
Notes & limitations
Works best on markets with reliable volume (equities, futures, liquid crypto). FX spot uses synthetic volume—interpret accordingly.
Anchor Time respects the chart’s timezone. Convert news times before setting.
This is an indicator, not a backtestable strategy. No trade advice.
Disclaimer
For educational purposes only. Trading involves risk. Do your own research and manage risk responsibly.
Cari dalam skrip untuk "vwap"

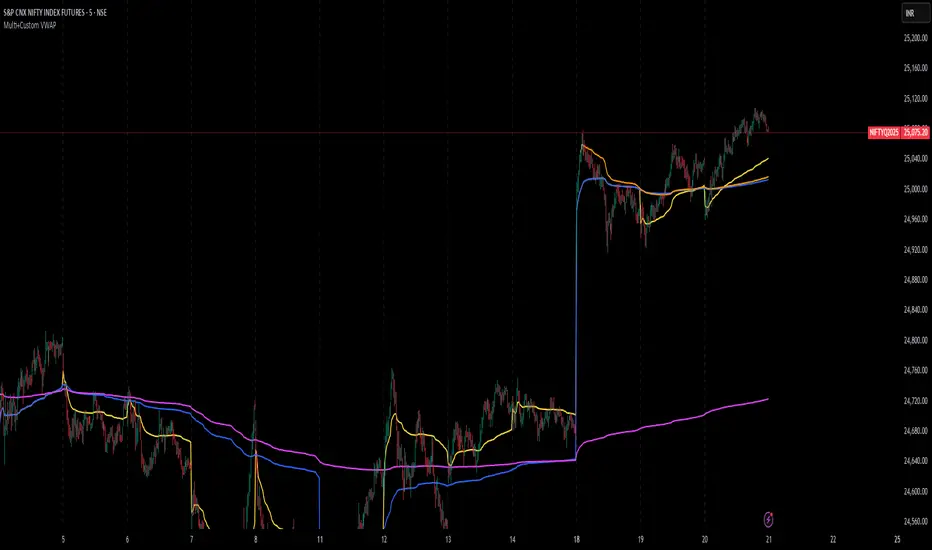
Multi+Custom VWAPMulti-VWAP (Session, Weekly, Monthly, Custom)
Description:
This script plots multiple VWAP (Volume Weighted Average Price) levels on the chart, giving traders a broader perspective of price action across different time horizons.
Features:
Session VWAP → Resets at the start of each trading session.
Weekly VWAP → Resets every Monday.
Monthly VWAP → Resets at the start of each new month.
Custom VWAP → User can specify a custom start date and time, and the script will calculate VWAP from that moment until the current bar.
Use Cases:
Compare intraday (session) VWAP with higher-timeframe VWAPs (weekly & monthly) to spot confluence levels.
Track how price interacts with institutional benchmarks.
Use custom VWAP to anchor from specific events (earnings, news releases, breakouts, etc.).
Notes:
Works on any timeframe and instrument that has volume data.
Designed to be clean and minimal with adjustable colors and line styles.
Useful for day traders, swing traders, and long-term investors who monitor VWAP across multiple time horizons.
(JS) Interchanging ATR & VWAP BandsOkay so this is pretty simple, but I think it's a great tool for day trading especially. I just took the default VWAP and Keltner channel scripts and combined them together.
The top option allows you to choose which one you'd prefer to use, "Use ATR instead of VWAP" .
The next options, "ATR Source", "KC Length", and "ATR Length" are the parameters for the ATR Bands.
"Number of Bands" allows you to choose how many bands you'd like to be on display (you can choose 1-8).
"Use Expoential MA" and "Band Style" are more default parameters from Keltner Channels used to set up the ATR Bands.
The "ATR Bands" are just stacked Keltner Channels separated by 1 ATR each, whereas the "VWAP Bands" are separated by standard deviation just like the default script from Trading View.
In these example chart, you can see the weekly VWAP with 8 deviation bands and 5 ATR bands with Keltner Channels.

(JS) VWAP BandsThis is a pretty simple script here - I took the VWAP and combined it with Bollinger Bands.
The bands can vary a lot based on chart resolution, so I wanted to make sure the resolution could be modified so you can use the resolution you're most comfortable with, or find the most success with.
Length:
Length of bars used to calculate the bands.
Standard Deviation Band 1-3:
There's three bands all together, this option allows you to modify the number of standard deviations per band.
VWAP Period:
This modifies when you want the VWAP to begin (Session, Week, Month, Year).
Offset:
This moves the VWAP and the bands the amount of bars you select, default is of course set to zero.
Source:
This selects the source of calculation, HLC/3 is the default VWAP calculation.
This is a pretty self explanatory script, I thought being able to see the standard deviations of the VWAP could prove to be useful - hope you all like it!

2 VWAP with selective timeframe and Display liked Ichimoku CloudSET:CKP
This is my first indicator of VWAP that I fork from the original script by public script "VWAP Periodic".
You can see that original script by type "VWAP Periodic" from "New" in "Pine Indicator".
The reason that I want to share my script is only one thing. That I need to discuss, Is this indicator can identify the trend and can use it to adapt to the "Buy-On-Dip" strategy?
Double VWAP can show you 2 lines of VWAP form different periods as my default is "Week" and "Month" timeframe.
Not at all, it fulfils with the background of the simple colour which can be defined Trend just liked "Ichimoku Cound" (Yes indeed, green is uptrend and red is downtrend).
I hope this indicator will help :)
Wishing you good health and get wealth too. :) :) :)
---------------------------------------------------------------------------------------------
สวัสดีครับมิตรสหายทุกท่าน อินดิเคเตอร์ที่ผมจะมานำเสนอมิตรสหายนี้ เป็นอินดี้ที่จะแสดงเส้น VWAP ได้ทั้งหมด 2 เส้น โดยท่านสามารถระบุ Timeframe ของ VWAP ที่ท่านต้องการได้เลยครับ
ก่อนอื่นผมของออกตัวก่อนครับ ว่าอินดิเคเตอร์นี้ผมโฟร์คมาจาก Original Public Script จากใน Pinescript แห่ง Trading View นี่ละครับ จากอินดิเคเตอร์ที่มีชื่อว่า "VWAP Periodic" ซึ่งท่านสามารถ กดดู Original Script ได้จากการกดที่
1) ไพน์อินดิเคเตอร์
2) กดเลือกคำว่า "ใหม่"
3) หาอินดิเคเตอร์ที่ชื่อว่า "VWAP Periodic"
้เท่านี้ท่านก็จะได้สคลิปต้นแบบที่ผมนำมาปรับใช้ได้ทันทีครับ
แต่กระนั้นแล้ว ผมจะเปิดโชว์สคริปของผมที่นำมาโฟร์คแล้วให้ทุกท่านได้รับชมกันด้านล่างในส่วนของโค้ดนะครับ
จุดประสงค์ของอินดิเคเตอร์นี้คือได้ฟังแนวคิดของ VWAP จากกัลยาณมิตรเทรดเดอร์ด้วยกันแล้วรู้สึกคลิ๊ก กับอินดิเคเตอร์นี้มากครับ
จะมีอะไรดีไปกว่าการได้รู้ต้นทุนราคาของแต่ละช่วงเวลา ทั้งไทม์เฟรมที่ใหญ่อย่างระดับ "เดือน (เส้นสีเขียว)" และ ระดับ "สัปดาห์ (เส้นสีแดง)" ได้พร้อมกันและดูแท่งเทียนเพื่อ "จับจังหวะซื้อ"(ในไทม์เฟรม ระดับ วัน) ที่ราคาต่ำกว่าค่า VWAP อีกเล่าอรชุน
จุดประสงค์หลักของอินดิเคเตอร์นี้ คือมีไว้เพื่อระบุเทรนด์โดยอาศัยการดูระยะห่างของเส้น VWAP ทั้ง 2 เส้นนี้ และระบุ "จุดกลับตัว" เมื่อก้อนเมฆสีเขียวและแดงเริ่มหายไป เสมือนกับอินดิเคเตอร์ "เมฆหมอกแห่งอิชิโมคุ"
นอกจากนี้เมื่อราคาหุ้นปรับตัวเป็นเทรนด์ขาขึ้นแล้ว เรายังสามารถซื้อเฉลี่ยขาขึ้น หรือใช้กลยุทธ์ Buy-on-Dip ได้อีกด้วยครับ โดยเฉลี่ยซื้อเมื่อราคาตกย่อมาอยู่ที่เส้นสีเขียว แบบนี้เป็นต้นครับ
ผมหวังว่าอินดิเคเตอร์นี้จะเป็นประโยชน์ให้แก่มิตรสหาย และกัลยาณมิตรเทรดเดอร์ทุกท่านนะครับ
ผมขออวยพรให้ทุกท่านมีความสุข ออกจากสนามแข่งหนูนี้ ได้รับอิสระภาพทางการเงิน และ "มีสุขภาพที่แข็งแรง" Work life balance ทุกท่านครับ
ขอบคุณครับ :) :) :)

Custom MTF VWAP 5x This is a combination of all VWAPs I use to find high probability trade setups and targets by only taking trades when different VWAPs align

RSI VWAP EMA ON CHART1. Understand the components
VWAP (Volume Weighted Average Price)
Green: price is above VWAP → bullish trend
Red: price is below VWAP → bearish trend
Blue: price exactly at VWAP → neutral
Acts as a dynamic trend line and support/resistance.
4 Moving Averages (MA1–MA4)
Customizable lengths and type (SMA or EMA).
Useful for trend confirmation and dynamic support/resistance.
Typically:
MA1 = fastest (short-term)
MA4 = slowest (long-term)
When price is above multiple MAs → strong bullish trend; below → bearish trend.
RSI Overlay with VWAP Alignment
RSI line normalized to price scale.
Background shading indicates momentum aligned with VWAP trend:
Green shading: RSI > 50 and price above VWAP → bullish momentum
Red shading: RSI < 50 and price below VWAP → bearish momentum
Gray areas: neutral or momentum does not align with VWAP.
2. Basic usage workflow
Trend Confirmation
Look at VWAP color: price above → bullish, below → bearish.
Check RSI + VWAP shading: green confirms bullish momentum, red confirms bearish momentum.
Check MA alignment: shorter MAs above longer MAs = stronger bullish trend; vice versa for bearish.
Entry Signals (Scalping)
Long (Buy) Setup
Price above VWAP (green)
RSI green shading (RSI > 50)
Shorter MAs above longer MAs (trend support)
Short (Sell) Setup
Price below VWAP (red)
RSI red shading (RSI < 50)
Shorter MAs below longer MAs
Exits / Stops
Exit if price closes against VWAP trend (e.g., price drops below VWAP during a bullish trade).
Use nearest MA support/resistance as stop-loss or take-profit zones.
3. Optional adjustments for scalping
RSI length / thresholds
Shorter RSI (7–10) → faster response for scalping.
Standard RSI (14) → smoother, fewer false signals.
MA lengths
Short-term: 20–50
Medium-term: 50–100
Long-term: 100–200
Can tweak for the timeframe you trade (1m, 5m, 15m).
Timeframe
VWAP works best on intraday charts (1m, 5m, 15m).
Use higher timeframe (e.g., 15m or 1h) for trend direction and lower timeframe (1m–5m) for entries.
4. Example Scalping Setup
Bullish setup (buy):
Price above VWAP → VWAP green
RSI > 50 and green shading
Shorter MAs above longer MAs
Enter on small pullback or breakout
Stop: below nearest MA or VWAP
Bearish setup (sell):
Price below VWAP → VWAP red
RSI < 50 and red shading
Shorter MAs below longer MAs
Enter on minor bounce or breakdown
Stop: above nearest MA or VWAP
5. Visual cues summary
Element Interpretation
VWAP Green Price above VWAP → bullish trend
VWAP Red Price below VWAP → bearish trend
RSI Green Shading Bullish momentum aligns with VWAP
RSI Red Shading Bearish momentum aligns with VWAP
MA Alignment Trend strength (short above long = bullish, short below long = bearish)

Origin VWAP: OVWAPDraw a VWAP support/resistance line anchored to the origin of the data series (like a daily VWAP, but from the beginning of time, never resetting).
Ideally the origin would be the first bar after the IPO. Tradingview (or your connected broker) doesn't always have a complete dataset, and in that case the OVWAP will be 'wrong', but converging to the correct value over time.
You can try to simulate this with the built-in VWAP indicator but it has several bugs and limitations. Firstly, the longest time period is century, but it is not 100 years, ie. a rolling century but the beginning of the century: 21 years ago. Secondly, even if your dataset is less than 21 years, if you use a lower time frame then the built-in VWAP's origin becomes the left-most loaded bar (about 5,000 bars ago) - it will draw the wrong value. The new Anchored VWAP drawing tool can't be used on lower time frames as it won't draw the line at all unless it sees the point where you anchored it.
You may want to cut 'n paste this code to use in some larger strategy. Unfortunately that's probably not possible. This script uses the 'resolution=' option of 'study()' set to '1W', so the whole script runs at the 1 week resolution. You would think it would be possible to instead use the 'security()' function to request data at the '1W' resolution, but it just resamples the current data set and so is limited to the rightmost 5,000 bars.
Look in the options to enable standard deviation lines.

Smoothed VWAP Bands + EMAsSmoothed VWAP bands
With my script, you take the raw standard deviation and apply an EMA (exponential moving
Advantages:
1. Less noise:
* The bands don’t jump around with every tiny price spike.
* Makes it easier to judge real price extremes.
2. Better zone visualization:
* Inner and outer bands are smoother and more visually “stable.”
* Easier to see meaningful trends, support/resistance, and breakout zones.
3. Fewer fakeouts:
* Traders can filter out small false signals because smoothed bands only move when volatility actually changes.
4. Dynamic to volatility:
* EMA smoothing keeps the bands adaptive:
* In quiet periods, bands tighten.
* In volatile periods, bands expand.
* But it avoids extreme jitter caused by every micro-move.
Safe Zone Rules
1. Long entries (green zone):
* Price above VWAP (trend bullish).
* Price inside inner band ±1σ (not touching outer extremes).
* Optional: candle close confirmation (price fully above inner band).
2. Short entries (red zone):
* Price below VWAP (trend bearish).
* Price inside inner band ±1σ.
* Optional: candle close confirmation.
3. Outer bands (±2σ):
* Considered overextended zones → avoid entries to reduce fakeouts.
4. Visual cues:
* Safe zones shaded lightly green/red inside inner band.
* Outer bands remain unshaded (for context).
Here’s a cheat sheet for trading the Smoothed VWAP Bands + EMAs that shows safe entry zones and trend alignment clearly.
Smoothed VWAP Bands + EMAs Cheat Sheet
Price Action Relative to Bands & EMAs
+2σ (Outer Upper Band)
----------------
Extreme volatility zone
Avoid entries here
+1σ (Inner Upper Band)
----------------
Safe zone limit for longs
Consider profit taking here
VWAP Line (Green = Bullish, Red = Bearish)
==================
Core trend indicator
Only trade in VWAP trend direction
-1σ (Inner Lower Band)
----------------
Safe zone limit for shorts
Good for entries in trend direction
-2σ (Outer Lower Band)
----------------
Extreme volatility zone
Avoid entries here
1️⃣ Trend Direction with VWAP & EMAs
* VWAP → shows the overall session trend.
* Price above VWAP → bullish
* Price below VWAP → bearish
* EMA 5 (blue) → short-term momentum
* EMA 20 (orange) → medium-term trend
Rule: Only take trades in the direction of the trend:
* Long trades → price > VWAP and EMA 5 > EMA 20
* Short trades → price < VWAP and EMA 5 < EMA 20
This prevents chasing trades against the trend and reduces fakeouts.
2️⃣ Entry Zones Using Smoothed VWAP Bands
* Inner band (±1σ) → “safe entry zone”
* Outer band (±2σ) → volatility extremes → avoid entries here
Rule: Enter longs inside the inner band above VWAP and shorts inside the inner band below VWAP.
Best used on intraday timeframes.
15, 5, 2, 1 min charts.

Adaptive CE-VWAP Breakout Framework [KedArc Quant]Description
A structured framework that unites three complementary systems into one charting engine:
Chandelier Exit (CE) – ATR-based trailing logic that defines trend direction, stop placement, and risk/reward overlays.
Swing-Anchored VWAP (SWAV) – a dynamically anchored VWAP that re-starts from each confirmed swing and adapts its smoothness to volatility.
Pivot S/R with Volume Breaks – confirmed horizontal levels with alerts when broken on expanding volume.
This script builds a single workflow for bias → trigger → managementwithout mixing unrelated indicators. Each module is internally linked rather than layered cosmetically, making it a true analytical framework—not.
Acknowledgment
Special thanks to Dynamic Swing Anchored VWAP by Zeiierman, whose swing-anchoring concept inspired a part of the SWAV module’s implementation and adaptation logic.
Support and Resistance Levels with Breaks by LuxAlgo for S/R breakout logic.
How this helps traders
Trend clarity – CE color-codes direction and provides evolving stops.
Context value – SWAV traces adaptive mean paths so traders see where price is heavy or light.
Action filter – Pivot+volume logic highlights true structural breaks, filtering false moves.
Discipline tool – Optional R:R boxes visualize risk and target zones to enforce planning.
Entry / Exit guidelines (for study purposes only)
Bias Use CE direction: green = long bias red = short bias
Entry
1. Breakout method– Trade in CE direction when a pivot level breaks on valid volume.
2. VWAP confirmation– Prefer breaks occurring around the nearest SWAV path (fair-value cross or re-test).
Exit
Stop = CE line / recent swing HL / ATR × (multiplier)
Target = R-multiple × risk (default 2 R)
Optional live update keeps SL/TP aligned with current CE state.
Core formula concepts
ATR Stop: Stop = High/Low – ATR × multiplier
VWAP calc: Σ(price × vol) / Σ(vol) anchored at swing pivot, adapted by APT (Adaptive Price Tracking) ratio ∝ ATR volatility.
Volume oscillator: 100 × (EMA₅ – EMA₁₀)/EMA₁₀; valid break when threshold %.
Input configuration (high-level)
Master Controls
Show CE / SWAV modules Theme & Fill opacity
CE Section
ATR period & multiplier Use Close for extremums
Show buy/sell labels Await bar confirmation
Risk-Reward overlay: R-multiple, Stop basis (CE/Swing/ATR×), Live update toggle
SWAV Section
Swing period Adaptive Price Tracking length Volatility bias (ATR-based adaptation) Line width
Pivot & Volume Breaks
Left/Right bar windows Volume threshold % Show Break labels and alerts
Best timeframes
Intraday: 5 m – 30 m for breakout confirmation
Swing: 1 h – 4 h for trend context
Settings scale with instrument volatility—adjust ATR period and volume threshold to match liquidity.
Glossary
ATR: Average True Range (volatility metric)
CE: Chandelier Exit (trailing stop/trend filter)
SWAV: Swing-Anchored VWAP (anchored mean price path)
Pivot H/L: Confirmed local extrema using left/right bar windows
R-multiple: Profit target as a multiple of initial risk
FAQ
Q: Does it repaint? A: No—pivots wait for confirmation and VWAP updates forward-only.
Q: Can modules be disabled? A: Yes—each section has its own toggle.
Q: Can it trade automatically? A: This is an indicator/study, not an auto-strategy.
Q: Is this financial advice? A: No—educational use only.
Disclaimer
This script is for educational and analytical purposes only.
It is not financial advice. Trading involves risk of loss. Past performance does not guarantee future results. Always apply sound risk management.

Smart Money LITE — Daily Sweep → HQ Signals (VWAP • FVG • CHoCH) 🔗 PRO VERSION (VWAP + FVG + CHoCH — full confirmations, all timeframes):
chartedgepro.gumroad.com/l/rmnbhw
Daily liquidity sweep → confluence signals with VWAP, FVG & CHoCH. Works on all timeframes & markets (Indices, Forex, Crypto).
WHAT IT DOES
Smart Money LITE+ highlights high-quality LONG/SHORT signals only after daily liquidity is swept (previous day high/low) with confluence from VWAP, FVG and structure (BOS/CHoCH).
Works on all timeframes and across markets: indices, forex, crypto.
KEY FEATURES (Lite)
• Daily sweep logic (PDH/PDL) + previous day zones
• VWAP + deviation bands (optional) and proximity filter
• 3-bar FVG boxes (visual) with adjustable extension
• ATR/volatility filter, optional HTF trend filter
• Anti-spam cooldown, clean LONG/SHORT labels
• Alerts: HQ LONG / HQ SHORT
HOW TO USE
1. Wait for price to sweep PDH/PDL → indicator opens “signal window”.
2. Look for confluence: VWAP touch/proximity + CHoCH or BOS in direction.
3. Enter with proper risk management (stop beyond swing/zone, partials).
SETTINGS TIPS
• Enable “Require VWAP Confluence?” for strictest setups.
• Use “HTF Trend Filter?” to align with higher-timeframe EMA trend.
• Adjust “After sweep (bars)” to define signal validity window.
• FVGs are visual in Lite — advanced filtering and confirmation are in Pro.
WHO IT'S FOR
Scalpers, intraday, and swing traders looking for objective, visual signals based on liquidity sweeps and VWAP/FVG confluence.
PRO VERSION (full confirmations)
Adds advanced FVG/iFVG logic, more confluence filters, dynamic risk tools and extended alert packages — optimized for all timeframes.
👉 chartedgepro.gumroad.com/l/rmnbhw
NOTES
• For educational purposes only. No financial advice.
• “Lite” is open-source; redistribution of code follows TradingView rules.

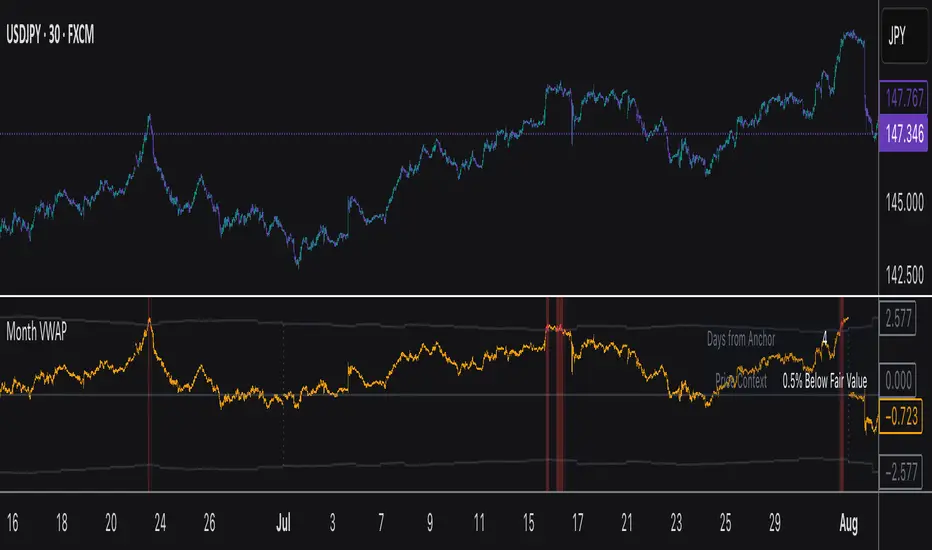
Monthly VWAPDescription
This indicator identifies potential mean reversion opportunities by tracking price deviations from monthly VWAP with dynamic volatility-adjusted thresholds.
Core Logic:
The indicator monitors when price moves significantly away from monthly VWAP and looks for potential reversal opportunities. It uses ATR-based dynamic thresholds that adapt to current market volatility, combined with volume confirmation to filter out weak signals.
Key Features:
Adaptive Thresholds: ATR-based bands that adjust to market volatility
Volume Confirmation: Requires average volume spike to validate signals
Monthly Reset: VWAP anchors reset each month for fresh reference levels
Visual Clarity: Color-coded deviation line with background highlights for active signals
Info Panel: Shows days from anchor and current price context vs fair value
Signal Generation:
Buy Signal: Price below monthly VWAP by threshold amount with elevated volume
Sell Signal: Price above monthly VWAP by threshold amount with elevated volume
Neutral: Price within threshold range or insufficient volume
Best Used For:
Mean reversion strategies in ranging markets
Identifying potential oversold/overbought conditions
Understanding price position relative to monthly fair value
2-Day Volume Weighted Average Price (VWAP)This indicator extends TradingView’s built-in VWAP by calculating a volume-weighted average price over a continuous two-day window (yesterday + today), anchoring VWAP at the start of yesterday’s session and carrying it through to today’s close, but only plotting the segment that falls within the current trading session—yesterday’s data feeds into the calculation to ensure today’s VWAP reflects the prior session’s volume and price action, while the line drawn on your chart always begins at today’s session open.
Standard Deviation Bands: Optional ±1σ, ±2σ, and ±3σ envelopes, exactly as in the default VWAP, but based on the rolling two-day data.

Anchored VWAP Pro (Final Visibility Enhanced)This is a fully customizable Anchored VWAP (Volume Weighted Average Price) indicator designed for traders who prioritize precision, clarity, and macro trend analysis.
Unlike traditional VWAPs tied to daily or session data, this version allows you to manually anchor the VWAP to any candle in history—ideal for macro swing trading, cycle lows, breakouts, and reaccumulation phases.
Features:
• Manual Anchor Date: Set the exact year, month, and day for your VWAP to begin
• Custom Price Source: Choose between HLC3, close, or any OHLC-based input
• VWAP Bands: Two standard deviation bands for identifying overextension or fair value zones
• Full Visual Control:
• Toggle each band on/off individually
• Adjust color, line width, and line style (solid, dotted, dashed)
• Built for Clarity: Designed to stand out on both light and dark charts
This script is ideal for:
• Identifying macro confluence zones
• Defining risk during trend pullbacks
• Confirming breakout legitimacy
• Layering with other tools like Market Cipher, VRVP, and Fib levels
Inspired by the work of LonesomeTheBlue, Algokid, and other pros—this is a cleaner, more flexible and updated alternative for precision trading.
Script created and published by @ImmortalEmerson
For advanced swing traders, crypto analysts, and macro trend specialists.
Z-Score Triggered VWAP# Z-Score Triggered VWAP Indicator
This custom indicator combines Volume-Weighted Average Price (VWAP) with Z-Score analysis to create a dynamic, volume-sensitive trading tool. It's designed to identify significant volume events and adjust the VWAP calculation accordingly, providing traders with a more responsive and adaptive price average.
## Key Features:
1. **Z-Score Triggered VWAP**: The indicator calculates a new VWAP when the volume Z-Score crosses above a user-defined threshold, allowing it to adapt to significant volume events.
2. **Customizable Timeframes**: Users can set different timeframes for Z-Score calculation and VWAP plotting, enabling multi-timeframe analysis.
3. **Dynamic Bands**: The indicator plots two sets of bands around the VWAP, calculated using standard deviation multipliers, which can be customized by the user.
4. **Visual Cues**: New VWAP start points are marked with yellow circles, helping traders identify where calculations reset.
5. **Real-time Information**: The current Z-Score and VWAP start information are displayed on the chart, providing immediate context.
6. **Flexible Appearance**: Users can customize colors and choose whether to display bands, enhancing chart readability.
7. **Multiple Alert Conditions**: The indicator includes alert conditions for price crossovers of the VWAP and all band levels.
## How It Works:
1. The indicator calculates the volume Z-Score on a user-specified timeframe, comparing current volume to historical volume over a lookback period.
2. When the volume Z-Score exceeds the threshold, a new VWAP calculation is triggered, resetting the cumulative values used in the VWAP formula.
3. The VWAP is continuously calculated and plotted on the chart, along with upper and lower bands based on price deviation from the VWAP.
4. Traders can use the VWAP line and bands to identify potential support/resistance levels and overbought/oversold conditions.
5. The Z-Score trigger helps ensure that the VWAP remains relevant by adapting to significant changes in trading volume.
## Trading Applications:
- **Dynamic Support/Resistance**: Use the VWAP and bands as potential support and resistance levels that adapt to changing market conditions.
- **Trend Identification**: The slope of the VWAP can help identify the overall trend direction.
- **Mean Reversion**: Look for potential reversals when price reaches the outer bands.
- **Volume Analysis**: The Z-Score trigger points highlight periods of unusual volume, which may precede significant price moves.
- **Risk Management**: Use the bands as potential stop-loss or take-profit levels.
This indicator is suitable for traders who want a more dynamic alternative to traditional VWAP indicators, especially those trading in markets with variable volume patterns. It combines volume analysis with price action, providing a comprehensive view of market behaviour
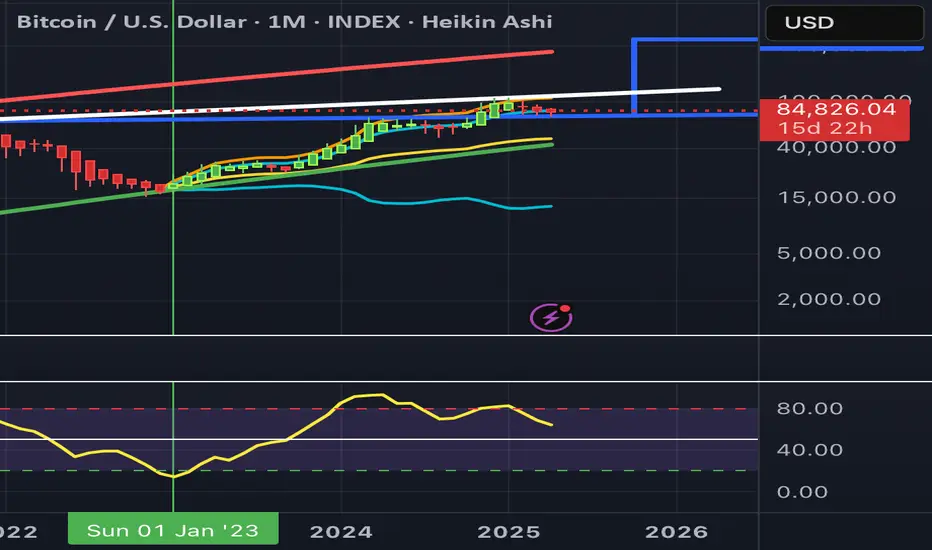
Rolling VWAP [QuantraSystems]Rolling VWAP
Introduction
The Rolling VWAP (R͜͡oll-VWAP) indicator modernizes the traditional VWAP by recalculating continuously on a rolling window, making it adept at pinpointing market trends and breakout points.
Its dual functionality includes both the dynamic rolling VWAP and a customizable anchored VWAP, enhanced by color-coded visual cues, thereby offering traders valuable flexibility and insight for their market analysis.
Legend
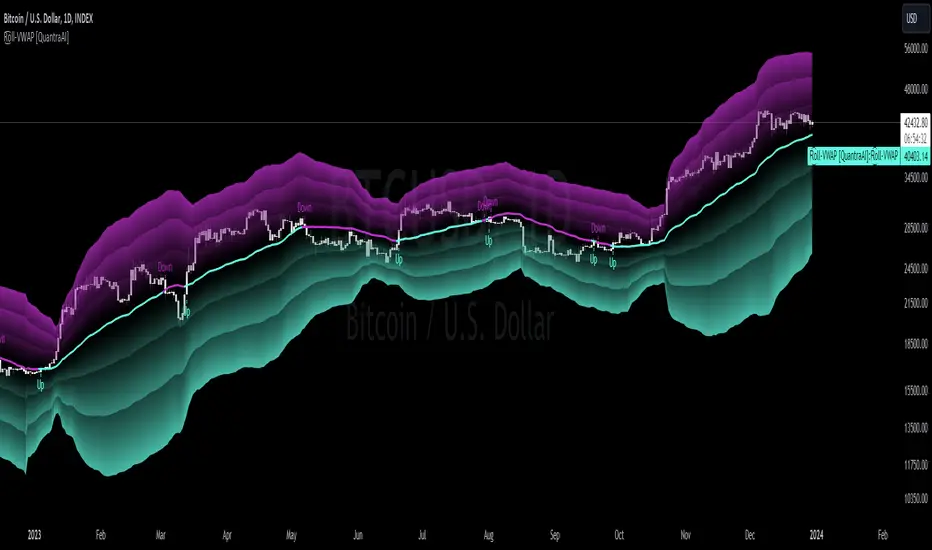
In the Image you can see the BTCUSD 1D Chart with the R͜͡oll-VWAP overlay.
You can see the individually activatable Standard Deviation (SD) Bands and the main VWAP Line.
It also features a Trend Signal which is deactivated by default and can be enabled if required.
Furthermore you can find the coloring of the VWAP line to represent the Trend.
In this case the trend itself is defined as:
Close being greater than the VWAP line -> Uptrend
Close below the VWAP line -> Downtrend
Notes
The R͜͡oll-VWAP can be used in a variety of ways.
Volatility adjusted expected range
This aims to identify in which range the asset is likely to move - according to the historical values the SD Bands are calculated and thus their according probabilities displayed.
Trend analysis
Trending above or below the VWAP shows up or down trends accordingly.
S/R Levels
Based on the probability distribution the 2. SD often works as a Resistance level and either mid line or 1. SD lines can act as S/R levels
Unsustainable levels
Based on the probability distributions a SD level of beyond 2.5, especially 3 and higher is hit very seldom and highly unsustainable.
This can either mean a mean reversion state or a momentum slowdown is necessary to get back to a sustainable level.
Please note that we always advise to find more confluence by additional indicators.
Traders are encouraged to test and determine the most suitable settings for their specific trading strategies and timeframes.
Methodology
The R͜͡oll-VWAP is based on the inbuilt TV VWAP.
It expands upon the limitations of having an anchored timeframe and thus a limited data set that is being reset constantly.
Instead we have integrated a rolling nature that continuously calculates the VWAP over a customizable lookback.
To also keep the base utility it is possible to use the anchored timeframes as well.
Furthermore the visualization has been improved and we added the coloring of the main VWAP line according to the Trend as stated above.
The applicable Trend signals are also part of that.
The parameter settings and also the visualizations allow for ample customizations by the trader.
For questions or recommendations, please feel free to seek contact in the comments.
Impatient TS VWAP BandsImpatient VWAP bands are based of Traderskew's VWAP bands but are for more impatient traders.
Wicking or crossing down through the upper band indicates a good short trade entry for range-bound trading periods while wicking or crossing up through the lower band indicates a good long entry in range-bound conditions.
By default, impatience is disabled. If it is turned on, adjusting impatience determines how quickly the bands approach price: higher impatience approaches price faster. Rebound indicates how far from price the bands bounce after hitting price.

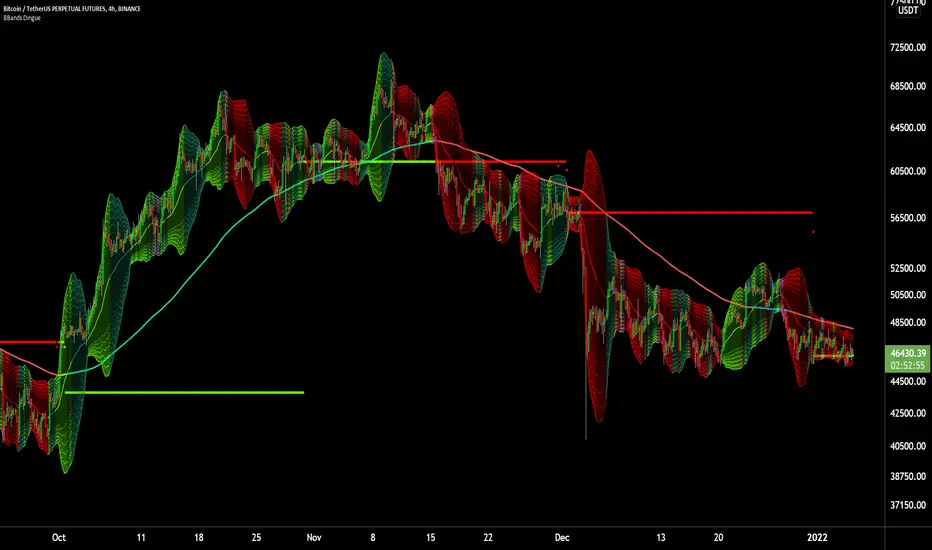
6X Bollinger Bands + MA + VWAP Dingue V56X Bollinger Bands Dingue V5 - This is the updated version for Pine Script 5
This indicator lets you quickly see all the intricacies of the Bollinger Bands; it simplifies its usage and maximizes the results.
Color-coded if the price is above or under the middle and based on direction.
Color-coded for expansion and contraction of the bands.
Option to plot ‘Squeezed bands’. It will show above the bands when they become smaller than the setting chosen. This helps identify build-up that might explode one way or another.
- 6x independent Bands can be adjusted as you want. It gives you possibilities in how you see variance, trends, support and resistance.
You can also select the MA type: SMA EMA WMA VWAM FRAMA … to explore new ways to see the Bollinger bands.
New in this version, you can now add a separate ‘Long MA’ that you can select independently from the Bands. Ex. Plot 200 SMA This helps in building a strategy with the trend and the bands.
Like the MA above, you can also plot 2 different VWAP independently from the Bands. This also helps knowing where the price stands compared to the bigger time frame VWAP’s price.
'Tool tips' explain other settings, if you have any questions, feel free to ask in the comments below.
Thank you for the feedback and check all my ‘Dingue’ indicators.
Volume Profile Free Ultra SLI (100 Levels Value Area VWAP) - RRBVolume Profile Free Ultra SLI by RagingRocketBull 2019
Version 1.0
This indicator calculates Volume Profile for a given range and shows it as a histogram consisting of 100 horizontal bars.
This is basically the MAX SLI version with +50 more Pinescript v4 line objects added as levels.
It can also show Point of Control (POC), Developing POC, Value Area/VWAP StdDev High/Low as dynamically moving levels.
Free accounts can't access Standard TradingView Volume Profile, hence this indicator.
There are several versions: Free Pro, Free MAX SLI, Free Ultra SLI, Free History. This is the Free Ultra SLI version. The Differences are listed below:
- Free Pro: 25 levels, +Developing POC, Value Area/VWAP High/Low Levels, Above/Below Area Dimming
- Free MAX SLI: 50 levels, 2x SLI modes for Buy/Sell or even higher res 150 levels
- Free Ultra SLI: 100 levels, packed to the limit, 2x SLI modes for Buy/Sell or even higher res 300 levels
- Free History: auto highest/lowest, historic poc/va levels for each session
Features:
- High-Res Volume Profile with up to 100 levels (line implementation)
- 2x SLI modes for even higher res: 300 levels with 3x vertical SLI, 100 buy/sell levels with 2x horiz SLI
- Calculate Volume Profile on full history
- POC, Developing POC Levels
- Buy/Sell/Total volume modes
- Side Cover
- Value Area, VAH/VAL dynamic levels
- VWAP High/Low dynamic levels with Source, Length, StdDev as params
- Show/Hide all levels
- Dim Non Value Area Zones
- Custom Range with Highlighting
- 3 Anchor points for Volume Profile
- Flip Levels Horizontally
- Adjustable width, offset and spacing of levels
- Custom Color for POC/VA/VWAP levels, Transparency for buy/sell levels
WARNING:
- Compilation Time: 1 min 20 sec
Usage:
- specify max_level/min_level/spacing (required)
- select range (start_bar, range length), confirm with range highlighting
- select volume type: Buy/Sell/Total
- select mode Value Area/VWAP to show corresponding levels
- flip/select anchor point to position the buy/sell levels
- use Horiz Buy/Sell SLI mode with 100 or Vertical SLI with 300 levels if needed
- use POC/Developing POC/VA/VWAP High/Low as S/R levels. Usually daily values from 1-3 days back are used as levels for the current day.
SLI:
use SLI modes to extend the functionality of the indicator:
- Horiz Buy/Sell 2x SLI lets you view 100 Buy/Sell Levels at the same time
- Vertical Max_Vol 3x SLI lets you increase the resolution to 300 levels
- you need at least 2 instances of the indicator attached to the same chart for SLI to work
1) Enable Horiz SLI:
- attach 2 indicator instances to the chart
- make sure all instances have the same min_level/max_level/range/spacing settings
- select volume type for each instance: you can have a buy/sell or buy/total or sell/total SLI. Make sure your buy volume instance is the last attached to be displayed on top of sell/total instances without overlapping.
- set buy_sell_sli_mode to true for indicator instances with volume_type = buy/sell, for type total this is optional.
- this basically tells the script to calculate % lengths based on total volume instead of individual buy/sell volumes and use ext offset for sell levels
- Sell Offset is calculated relative to Buy Offset to stack/extend sell after buy. Buy Offset = Zero - Buy Length. Sell Offset = Buy Offset - Sell Length = Zero - Buy Length - Sell Length
- there are no master/slave instances in this mode, all indicators are equal, poc/va levels are not affected and can work independently, i.e. one instance can show va levels, another - vwap.
2) Enable Vertical SLI:
- attach the first instance and evaluate the full range to roughly determine where is the highest max_vol/poc level i.e. 0..20000, poc is in the bottom half (third, middle etc) or
- add more instances and split the full vertical range between them, i.e. set min_level/max_level of each corresponding instance to 0..10000, 10000..20000 etc
- make sure all instances have the same range/spacing settings
- an instance with a subrange containing the poc level of the full range is now your master instance (bottom half). All other instances are slaves, their levels will be calculated based on the max_vol/poc of the master instance instead of local values
- set show_max_vol_sli to true for the master instance. for slave instances this is optional and can be used to check if master/slave max_vol values match and slave can read the master's value. This simply plots the max_vol value
- you can also attach all instances and set show_max_vol_sli to true in all of them - the instance with the largest max_vol should become the master
Auto/Manual Ext Max_Vol Modes:
- for auto vertical max_vol SLI mode set max_vol_sli_src in all slave instances to the max_vol of the master indicator: "VolumeProfileFree_MAX_RRB: Max Volume for Vertical SLI Mode". It can be tricky with 2+ instances
- in case auto SLI mode doesn't work - assign max_vol_sli_ext in all slave instances the max_vol value of the master indicator manually and repeat on each change
- manual override max_vol_sli_ext has higher priority than auto max_vol_sli_src when both values are assigned, when they are 0 and close respectively - SLI is disabled
- master/slave max_vol values must match on each bar at all times to maintain proper level scale, otherwise slave's levels will look larger than they should relative to the master's levels.
- Max_vol (red) is the last param in the long list of indicator outputs
- the only true max_vol/poc in this SLI mode is the master's max_vol/poc. All poc/va levels in slaves will be irrelevant and are disabled automatically. Slaves can only show VWAP levels.
- VA Levels of the master instance in this SLI mode are calculated based on the subrange, not the whole range and may be inaccurate. Cross check with the full range.
WARNING!
- auto mode max_vol_sli_src is experimental and may not work as expected
- you can only assign auto mode max_vol_sli_src = max_vol once due to some bug with unhandled exception/buffer overflow in Tradingview. Seems that you can clear the value only by removing the indicator instance
- sometimes you may see a "study in error state" error when attempting to set it back to close. Remove indicator/Reload chart and start from scratch
- volume profile may not finish to redraw and freeze in an ugly shape after an UI parameter change when max_vol_sli_src is assigned a max_vol value. Assign it to close - VP should redraw properly, but it may not clear the assigned max_vol value
- you can't seem to be able to assign a proper auto max_vol value to the 3rd slave instance
- 2x Vertical SLI works and tested in both auto/manual, 3x SLI - only manual seems to work (you can have a mixed mode: 2nd instance - auto, 3rd - manual)
Notes:
- This code uses Pinescript v3 compatibility framework
- This code is 20x-30x faster (main for cycle is removed) especially on lower tfs with long history - only 4-5 sec load/redraw time vs 30-60 sec of the old Pro versions
- Instead of repeatedly calculating the total sum of volumes for the whole range on each bar, vol sums are now increased on each bar and passed to the next in the range making it a per range vs per bar calculation that reduces time dramatically
- 100 levels consist of 50 main plot levels and 50 line objects used as alternate levels, differences are:
- line objects are always shown on top of other objects, such as plot levels, zero line and side cover, it's not possible to cover/move them below.
- all line objects have variable lengths, use actual x,y coords and don't need side cover, while all plot levels have a fixed length of 100 bars, use offset and require cover.
- all key properties of line objects, such as x,y coords, color can be modified, objects can be moved/deleted, while this is not possible for static plot levels.
- large width values cause line objects to expand only up/down from center while their length remains the same and stays within the level's start/end points similar to an area style.
- large width values make plot levels expand in all directions (both h/v), beyond level start/end points, sometimes overlapping zero line, making them an inaccurate % length representation, as opposed to line objects/plot levels with area style.
- large width values translate into different widths on screen for line objects and plot levels.
- you can't compensate for this unwanted horiz width expansion of plot levels because width uses its own units, that don't translate into bars/pixels.
- line objects are visible only when num_levels > 50, plot levels are used otherwise
- Since line objects are lines, plot levels also use style line because other style implementations will break the symmetry/spacing between levels.
- if you don't see a volume profile check range settings: min_level/max_level and spacing, set spacing to 0 (or adjust accordingly based on the symbol's precision, i.e. 0.00001)
- you can view either of Buy/Sell/Total volumes, but you can't display Buy/Sell levels at the same time using a single instance (this would 2x reduce the number of levels). Use 2 indicator instances in horiz buy/sell sli mode for that.
- Volume Profile/Value Area are calculated for a given range and updated on each bar. Each level has a fixed length. Offsets control visible level parts. Side Cover hides the invisible parts.
- Custom Color for POC/VA/VWAP levels - UI Style color/transparency can only change shape's color and doesn't affect textcolor, hence this additional option
- Custom Width - UI Style supports only width <= 4, hence this additional option
- POC is visible in both modes. In VWAP mode Developing POC becomes VWAP, VA High and Low => VWAP High and Low correspondingly to minimize the number of plot outputs
- You can't change buy/sell level colors from input (only transparency) - this requires 2x plot outputs => 2x reduces the number of levels to fit the max 64 limit. That's why 2 additional plots are used to dim the non Value Area zones
- You can change level transparency of line objects. Due to Pinescript limitations, only discrete values are supported.
- Inverse transp correlation creates the necessary illusion of "covered" line objects, although they are shown on top of the cover all the time
- If custom lines_transp is set the illusion will break because transp range can't be skewed easily (i.e. transp 0..100 is always mapped to 100..0 and can't be mapped to 50..0)
- transparency can applied to lines dynamically but nva top zone can't be completely removed because plot/mixed type of levels are still used when num_levels < 50 and require cover
- transparency can't be applied to plot levels dynamically from script this can be done only once from UI, and you can't change plot color for the past length bars
- All buy/sell volume lengths are calculated as % of a fixed base width = 100 bars (100%). You can't set show_last from input to change it
- Range selection/Anchoring is not accurate on charts with time gaps since you can only anchor from a point in the future and measure distance in time periods, not actual bars, and there's no way of knowing the number of future gaps in advance.
- Adjust Width for Log Scale mode now also works on high precision charts with small prices (i.e. 0.00001)
- in Adjust Width for Log Scale mode Level1 width extremes can be capped using max deviation (when level1 = 0, shift = 0 width becomes infinite)
- There's no such thing as buy/sell volume, there's just volume, but for the purposes of the Volume Profile method, assume: bull candle = buy volume, bear candle = sell volume
P.S. I am your grandfather, Luke! Now, join the Dark Side in your father's steps or be destroyed! Once more the Sith will rule the Galaxy, and we shall have peace...

Volume Profile Free MAX SLI (50 Levels Value Area VWAP) by RRBVolume Profile Free MAX SLI by RagingRocketBull 2019
Version 1.0
All available Volume Profile Free MAX SLI versions are listed below (They are very similar and I don't want to publish them as separate indicators):
ver 1.0: style columns implementation
ver 2.0: style histogram implementation
ver 3.0: style line implementation
This indicator calculates Volume Profile for a given range and shows it as a histogram consisting of 50 horizontal bars.
It can also show Point of Control (POC), Developing POC, Value Area/VWAP StdDev High/Low as dynamically moving levels.
Free accounts can't access Standard TradingView Volume Profile, hence this indicator.
There are several versions: Free Pro, Free MAX SLI, Free History. This is the Free MAX SLI version. The Differences are listed below:
- Free Pro: 25 levels, +Developing POC, Value Area/VWAP High/Low Levels, Above/Below Area Dimming
- Free MAX SLI: 50 levels, packed to the limit, 2x SLI modes for Buy/Sell or even higher res 150 levels
- Free History: auto highest/lowest, historic poc/va levels for each session
Features:
- High-Res Volume Profile with up to 50 levels (3 implementations)
- 20-30x faster than the old Pro versions especially on lower tfs with long history
- 2x SLI modes for even higher res: 150 levels with 3x vertical SLI, 50 buy/sell levels with 2x horiz SLI
- Calculate Volume Profile on full history
- POC, Developing POC Levels
- Buy/Sell/Total volume modes
- Side Cover
- Value Area, VAH/VAL dynamic levels
- VWAP High/Low dynamic levels with Source, Length, StdDev as params
- Show/Hide all levels
- Dim Non Value Area Zones
- Custom Range with Highlighting
- 3 Anchor points for Volume Profile
- Flip Levels Horizontally
- Adjustable width, offset and spacing of levels
- Custom Color for POC/VA/VWAP levels and Transparency for buy/sell levels
Usage:
- specify max_level/min_level/spacing (required)
- select range (start_bar, range length), confirm with range highlighting
- select volume type: Buy/Sell/Total
- select mode Value Area/VWAP to show corresponding levels
- flip/select anchor point to position the buy/sell levels
- use Horiz SLI mode for 50 Buy/Sell or Vertical SLI for 150 levels if needed
- use POC/Developing POC/VA/VWAP High/Low as S/R levels. Usually daily values from 1-3 days back are used as levels for the current day.
SLI:
- use SLI modes to extend the functionality of the indicator:
- Horiz Buy/Sell 2x SLI lets you view 50 Buy/Sell Levels at the same time
- Vertical Max_Vol 3x SLI lets you increase the resolution to 150 levels
- you need at least 2 instances of the indicator attached to the same chart for SLI to work
1) Enable Horiz SLI:
- attach 2 indicator instances to the chart
- make sure all instances have the same min_level/max_level/range/spacing settings
- select volume type for each instance: you can have a buy/sell or buy/total or sell/total SLI. Make sure your buy volume instance is the last attached to be displayed on top of sell/total instances without overlapping.
- set buy_sell_sli_mode to true for indicator instances with volume_type = buy/sell, for type total this is optional.
- this basically tells the script to calculate % lengths based on total volume instead of individual buy/sell volumes and use ext offset for sell levels
- Sell Offset is calculated relative to Buy Offset to stack/extend sell after buy. Buy Offset = Zero - Buy Length. Sell Offset = Buy Offset - Sell Length = Zero - Buy Length - Sell Length
- there are no master/slave instances in this mode, all indicators are equal, poc/va levels are not affected and can work independently, i.e. one instance can show va levels, another - vwap.
2) Enable Vertical SLI:
- attach the first instance and evaluate the full range to roughly determine where is the highest max_vol/poc level i.e. 0..20000, poc is in the bottom half (third, middle etc) or
- add more instances and split the full vertical range between them, i.e. set min_level/max_level of each corresponding instance to 0..10000, 10000..20000 etc
- make sure all instances have the same range/spacing settings
- an instance with a subrange containing the poc level of the full range is now your master instance (bottom half). All other instances are slaves, their levels will be calculated based on the max_vol/poc of the master instance instead of local values
- set show_max_vol_sli to true for the master instance. for slave instances this is optional and can be used to check if master/slave max_vol values match and slave can read the master's value. This simply plots the max_vol value
- you can also attach all instances and set show_max_vol_sli to true in all of them - the instance with the largest max_vol should become the master
Auto/Manual Ext Max_Vol Modes:
- for auto vertical max_vol SLI mode set max_vol_sli_src in all slave instances to the max_vol of the master indicator: "VolumeProfileFree_MAX_RRB: Max Volume for Vertical SLI Mode". It can be tricky with 2+ instances
- in case auto SLI mode doesn't work - assign max_vol_sli_ext in all slave instances the max_vol value of the master indicator manually and repeat on each change
- manual override max_vol_sli_ext has higher priority than auto max_vol_sli_src when both values are assigned, when they are 0 and close respectively - SLI is disabled
- master/slave max_vol values must match on each bar at all times to maintain proper level scale, otherwise slave's levels will look larger than they should relative to the master's levels.
- Max_vol (red) is the last param in the long list of indicator outputs
- the only true max_vol/poc in this SLI mode is the master's max_vol/poc. All poc/va levels in slaves will be irrelevant and are disabled automatically. Slaves can only show VWAP levels.
- VA Levels of the master instance in this SLI mode are calculated based on the subrange, not the whole range. Cross check with the full range.
WARNING!
- auto mode max_vol_sli_src is experimental and may not work as expected
- you can only assign auto mode max_vol_sli_src = max_vol once due to some bug with unhandled exception/buffer overflow in Tradingview. Seems that you can clear the value only by removing the indicator instance
- sometimes you may see a "study in error state" error when attempting to set it back to close. Remove indicator/Reload chart and start from scratch
- volume profile may not finish to redraw and freeze in an ugly shape after an UI parameter change when max_vol_sli_src is assigned a max_vol value. Assign it to close - VP should redraw properly, but it may not clear the assigned max_vol value
- you can't seem to be able to assign a proper auto max_vol value to the 3rd slave instance
- 2x Vertical SLI works and tested in both auto/manual, 3x SLI - only manual seems to work
Notes:
- This code is 20x-30x faster (main for cycle is removed) especially on lower tfs with long history - only 2-3 sec load/redraw time vs 30-60 sec of the old Pro versions
- Instead of repeatedly calculating the total sum of volumes for the whole range on each bar, vol sums are now increased on each bar and passed to the next in the range making it a per range vs per bar calculation that reduces time dramatically
- hist_base for levels still results is ugly redraw
- if you don't see a volume profile check range settings: min_level/max_level and spacing, set spacing to 0 (or adjust accordingly based on the symbol's precision, i.e. 0.00001)
- you can view either of Buy/Sell/Total volumes, but you can't display Buy/Sell levels at the same time using a single instance (this would 2x reduce the number of levels). Use 2 indicator instances in horiz buy/sell sli mode for that.
- Volume Profile/Value Area are calculated for a given range and updated on each bar. Each level has a fixed length. Offsets control visible level parts. Side Cover hides the invisible parts.
- Custom Color for POC/VA/VWAP levels - UI Style color/transparency can only change shape's color and doesn't affect textcolor, hence this additional option
- Custom Width - UI Style supports only width <= 4, hence this additional option
- POC is visible in both modes. In VWAP mode Developing POC becomes VWAP, VA High and Low => VWAP High and Low correspondingly to minimize the number of plot outputs
- You can't change buy/sell level colors from input (only plot transparency) - this requires 2x plot outputs => 2x reduces the number of levels to fit the max 64 limit. That's why 2 additional plots are used to dim the non Value Area zones
- All buy/sell volume lengths are calculated as % of a fixed base width = 100 bars (100%). You can't set show_last from input to change it
- There's no such thing as buy/sell volume, there's just volume, but for the purposes of the Volume Profile method, assume: bull candle = buy volume, bear candle = sell volume
P.S. Gravitonium Levels Are Increasing. Unobtainium is nowhere to be found!
Links on Volume Profile and Value Area calculation and usage:
www.tradingview.com
stockcharts.com
onlinelibrary.wiley.com

Money Flow Index + VWAP Trend FilterThis indicator combines the volume-weighted momentum analysis of the Money Flow Index (MFI) with the trend-filtering capabilities of the Volume Weighted Average Price (VWAP) to generate reliable buy and sell signals. By requiring MFI overbought/oversold conditions to align with the trend direction relative to VWAP, this indicator reduces false signals, making it ideal for trading on timeframes like 5-minute to 4-hour charts.
How It Works
The indicator uses two technical components to produce signals:
Money Flow Index (MFI) for Momentum Extremes:
The MFI, calculated over a default 14-period length, measures buying and selling pressure using price and volume data. A buy signal is triggered when MFI crosses above the oversold level (default: 20), indicating potential buying pressure, while a sell signal occurs when MFI crosses below the overbought level (default: 80), suggesting selling pressure.
Volume Weighted Average Price (VWAP) for Trend Direction:
The VWAP calculates the average price of an asset, weighted by volume, resetting at the start of each trading session (e.g., daily for stocks). It acts as a dynamic support/resistance level. A bullish trend is confirmed when the price is above the VWAP, and a bearish trend when the price is below the VWAP. This ensures MFI signals are filtered to align with the broader trend direction, plotted as a purple line on the chart.
Signal Generation
Signals are generated using the previous bar’s values to prevent repainting:
Buy Signal: The MFI crosses above the oversold level, and the price is above the VWAP (bullish trend). Displayed as a green upward triangle below the bar.
Sell Signal: The MFI crosses below the overbought level, and the price is below the VWAP (bearish trend). Displayed as a red downward triangle above the bar.

Rolling VWAP - Vhunt Scalper botBINANCE:ADAUSDTPERP
Modified VWAP to use scalping in lower timeframe.
Use 1minute TF for best results but can also use up to 30min.
This indicator is made for crypto but may also work for other assets.
The bands serve as support and resistance and used for opening quick profit position if conditions below are met:
Indicators:
Blue - modified rolling vwap
Orange - Band1
Green - Band2
Opening position Conditions:
Long:
Band2 < Band1
Price < Band2
Short:
Band2 > Band1
Price > Band2

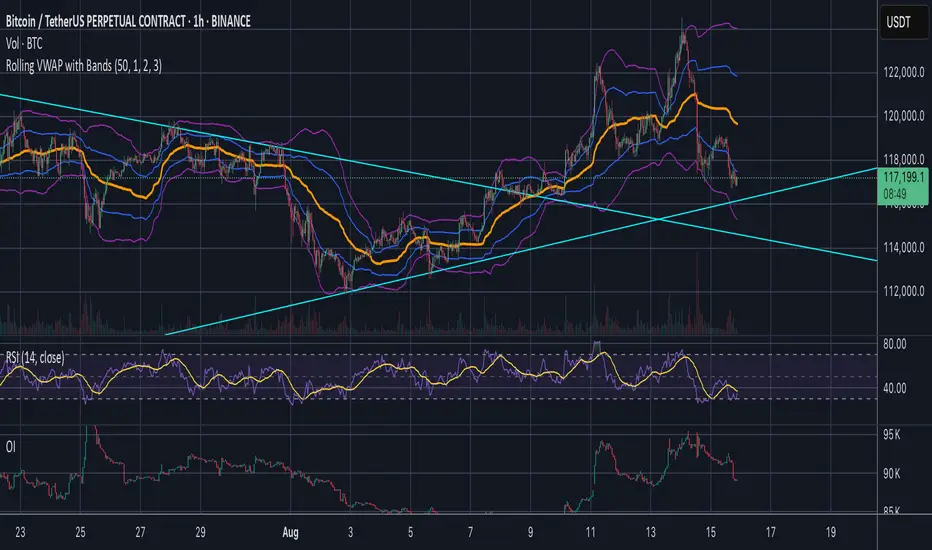
Jose's Rolling VWAP with BandsRolling VWAP with Customizable Deviation Bands
This indicator plots a rolling Volume Weighted Average Price (VWAP) over a user-defined lookback period, rather than resetting each day or from a fixed anchor point. The rolling calculation makes it act more like a moving average — but weighted by volume — providing a smoother, more adaptive central price line.
It also includes up to three optional deviation bands, which can be independently toggled on/off and assigned their own multipliers. These bands are calculated using the chosen lookback’s standard deviation, giving traders a quick visual of price dispersion around VWAP.
Features:
Adjustable rolling VWAP lookback length
Up to 3 customizable standard deviation bands
Individual checkboxes for enabling/disabling each band
Independent multiplier control for each band
Works on any timeframe and symbol
Uses:
Identify overextended price moves relative to VWAP
Spot dynamic support/resistance zones
Gauge mean reversion opportunities
Confirm trend strength when price hugs or breaks away from VWAP